. 2021 Mar 5;12(1):1428.
doi: 10.1038/s41467-021-21702-6.

Deciphering the state of immune silence in fatal COVID-19 patients

Affiliations

Deciphering the state of immune silence in fatal COVID-19 patients

Pierre Bost et al. Nat Commun. .

Abstract

Since the beginning of the SARS-CoV-2 pandemic, COVID-19 appeared as a unique disease with unconventional tissue and systemic immune features. Here we show a COVID-19 immune signature associated with severity by integrating single-cell RNA-seq analysis from blood samples and broncho-alveolar lavage fluids with clinical, immunological and functional ex vivo data. This signature is characterized by lung accumulation of naïve lymphoid cells associated with a systemic expansion and activation of myeloid cells. Myeloid-driven immune suppression is a hallmark of COVID-19 evolution, highlighting arginase-1 expression with immune regulatory features of monocytes. Monocyte-dependent and neutrophil-dependent immune suppression loss is associated with fatal clinical outcome in severe patients. Additionally, our analysis shows a lung CXCR6+ effector memory T cell subset is associated with better prognosis in patients with severe COVID-19. In summary, COVID-19-induced myeloid dysregulation and lymphoid impairment establish a condition of 'immune silence' in patients with critical COVID-19.


Conflict of interest statement

The authors declare no competing interests.

Figures
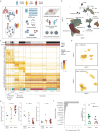
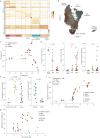
Fig. 1
Fig. 1. Establishment of a BAL and blood-derived immune cell atlas from patients with COVID-19.
a Description of the cohort highlighting the source of BAL (only from severe patients, in red) and blood samples (from severe and mild patients and healthy donors, in red, orange and blue, respectively). b Two-dimensional UMAP embedding of the scRNA-seq data. Dots (cells) are colored according to their respective metacluster (Epithelial cells, lymphocytes, neutrophils, and monocytes/macrophages). c Expression heatmap of the 14 significant clusters detected in our scRNA-seq dataset. The top five best markers were selected for each cluster. d Two-dimensional density plot of the UMAP embedding of the BAL (upper panel) or the blood (lower panel) cells. e Proportion of neutrophils, lymphocytes, and monocytes/macrophages in blood samples across patient status. For each of the cell types, an ANOVA test was performed and corrected for multiple-testing by Bonferroni correction (one-sided Fisher test). Median and 5–95% theoretical quantiles are shown. N = 32 independent clinical samples were used, including 5 derived from healthy patients, 6 from mild patients, and 21 from severe patients. f Expression of the SPP1 (osteopontin) gene across cell types (left panel) and distribution of Macrophages (1) among total BAL cells based on severe patient clinical outcome (right panel). A two-sided Welch’s t test was performed to compare proportion between the two groups of patients (t = 2.2 with a degree of freedom equal to 16.5). Median and 5–95% theoretical quantiles are shown. Normality was tested using a one-sided Shapiro–Wilk test for each individual group (p = 0.064 and p = 0.32 respectively). N = 21 independent clinical samples were used, including 13 derived from patients who survived and 8 from deceased patients.
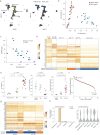
Fig. 2
Fig. 2. Analysis of blood myeloid cells shows unique features associated with patient status and outcome.
a Expression heatmap of the 10 clusters identified among the blood neutrophils. b Two-dimensional UMAP embedding of the blood neutrophil. Cells are colored according to their cluster. c Scatter plot of the Correspondence Analysis (CA) of the blood neutrophil populations. d Proportion of resting neutrophils (left panel), ISGs neutrophils (middle panel) and immature neutrophils (right panel) among blood neutrophils according to patient clinical status. A one-sided Tukey’s range test was used in the left panel while Kruskal–Wallis rank test was used in both middle and right panel. Median and 5–95% theoretical quantiles are shown. Normality of the distribution in the left panel was assessed using a Shapiro–Wilk test in each group individually (p = 0.39, p = 0.99, and p = 0.043, respectively). N = 32 independent clinical samples were used, including 5 derived from healthy patients, 6 from mild patients, and 21 from severe patients. e T-cell suppression ability of CD14+ monocytes according to clinical status (right) or to ICU outcome (severe patients only, right panel). A Tukey’s range test was used in the left panel while a two-sided Welch’s t test was performed in the right panel (t = 4.9 with a degree of freedom equal to 11.8). Median and 5–95% theoretical quantiles are shown. Normality of the distribution in the right panel was assessed using a Shapiro–Wilk test in each group individually (p=0.91 and p=0.7 respectively). In the left panel, N = 29 independent clinical samples were used, including 4 derived from healthy patients, 7 from mild patients and 18 from severe patients. In the right panel, N = 18 independent clinical samples were used, including 11 derived from patients who survived and 7 from deceased patients. f Association between CD14+ monocytes ARG1 Mean Fluorescence Intensity (MFI) and immunesuppression. The dashed line corresponds to the fitted Hill-like function. N = 29 independent clinical samples were used, including 4 derived from healthy patients, 7 from mild patients and 18 from severe patients. g Association between CD14+ monocytes HLA-DR Mean Fluorescence Intensity (MFI) and immunesuppression. Source data are provided as a Source Data file.
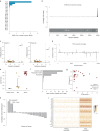
Fig. 3
Fig. 3. Cellular clusters associated with better patient prognosis.
a Two-dimensional UMAP embedding of lymphocytes colored according to their cluster (left panel) or their tissue (right panel). b Correspondence Analysis (CA) of blood and BAL lymphocytes. c Association between SOFA score and CA dimension 1 score of BAL samples. d Expression heatmap of the BAL lymphocytes belonging to the cell clusters that are associated with CA dimension 1. The 10 best markers are shown for each cluster. e Distribution of CA dimension 2 score of blood samples according to clinical status (left panel), and proportion of resting (middle panel) and activated NK (right panel) according to clinical status. A one-sided Tukey’s range test was used to compute the shown p values. Median and 5–95% theoretical quantiles are shown. N = 32 independent clinical samples were used, including 5 derived from healthy patients, 6 from mild patients, and 21 from severe patients. f Ranked Pearson correlation between biological features and CA dimension 2. g Expression heatmap of the blood lymphocytes belonging to the cell clusters that are associated with CA dimension 2. The 20 best markers are shown for each cluster. h Mean expression of CXCR6 across different tissues and cell types (left panel) and among the different BAL lymphocytes clusters associated with CA dimension 1. Source data are provided as a Source Data file.
Fig. 4
Fig. 4. Analysis of viral landscape in patients with severe COVID-19.
a Number of SARS-CoV-2 UMIs in each BAL sample. b Coverage plot of SARS-CoV-2 genome. c Viral-Track analysis of patients 4 and 25. d Coverage plot of HSV-1 genome. e Quantification of IgG targeting the RBD domain of the SARS-CoV-2’s spike protein. OD: optical density. Median and 5–95% theoretical quantiles are shown. N = 30 independent clinical samples were used, including 5 derived from healthy patients, 6 from mild patients, and 19 from severe patients. f Mean number of SARS-CoV-2 UMIs across patient 8 cell clusters. g CA analysis of total blood cell population. h Correlation between cell clusters proportion and total blood CA dimension 1. i Expression heatmap of cells belonging to resting or ISGs neutrophils in peripheral blood. Source data are provided as a Source Data file.

References

    1. Zhou P, et al. A pneumonia outbreak associated with a new coronavirus of probable bat origin. Nature. 2020;579:270–273. doi: 10.1038/s41586-020-2012-7. - DOI - PMC - PubMed
    1. Lavezzo E. et al. Suppression of a SARS-CoV-2 outbreak in the Italian municipality of Vo’. Nature584, 425–429 (2020). - PubMed
    1. Zhou F, et al. Clinical course and risk factors for mortality of adult inpatients with COVID-19 in Wuhan, China: a retrospective cohort study. Lancet. 2020;395:1054–1062. doi: 10.1016/S0140-6736(20)30566-3. - DOI - PMC - PubMed
    1. Huang C, et al. Clinical features of patients infected with 2019 novel coronavirus in Wuhan, China. Lancet. 2020;395:497–506. doi: 10.1016/S0140-6736(20)30183-5. - DOI - PMC - PubMed
    1. Chen G, et al. Clinical and immunological features of severe and moderate coronavirus disease 2019. J. Clin. Invest. 2020;130:2620–2629. doi: 10.1172/JCI137244. - DOI - PMC - PubMed

Publication types