. 2021 Mar 5;12(1):1455.
doi: 10.1038/s41467-021-21804-1.

Tumor methionine metabolism drives T-cell exhaustion in hepatocellular carcinoma

Affiliations

Tumor methionine metabolism drives T-cell exhaustion in hepatocellular carcinoma

Man Hsin Hung et al. Nat Commun. .

Abstract

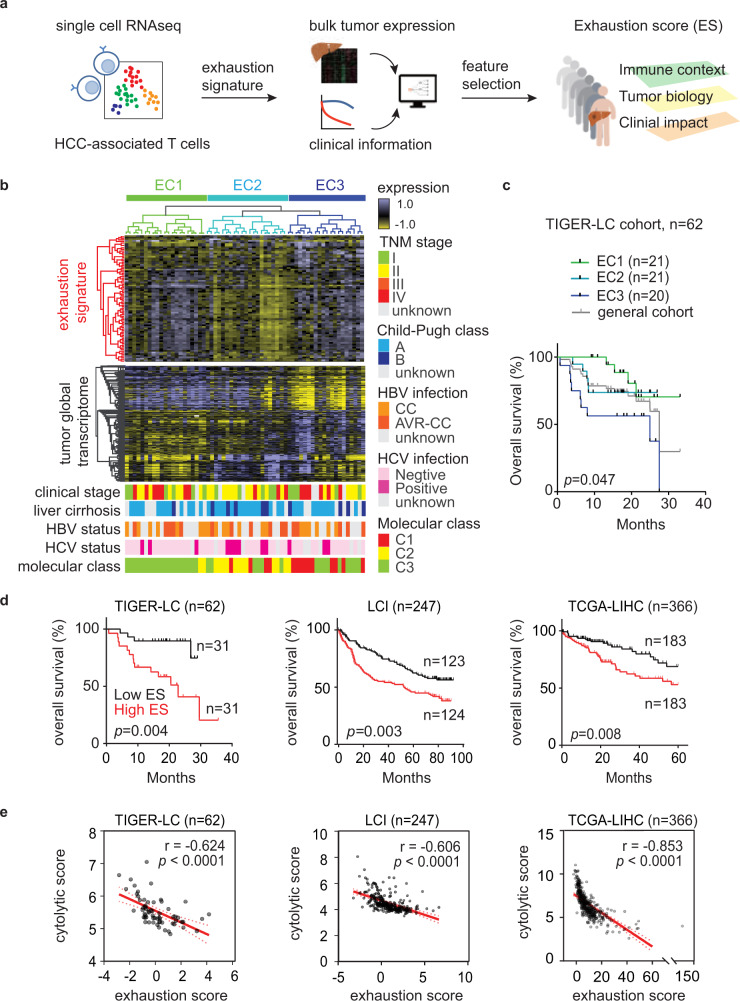
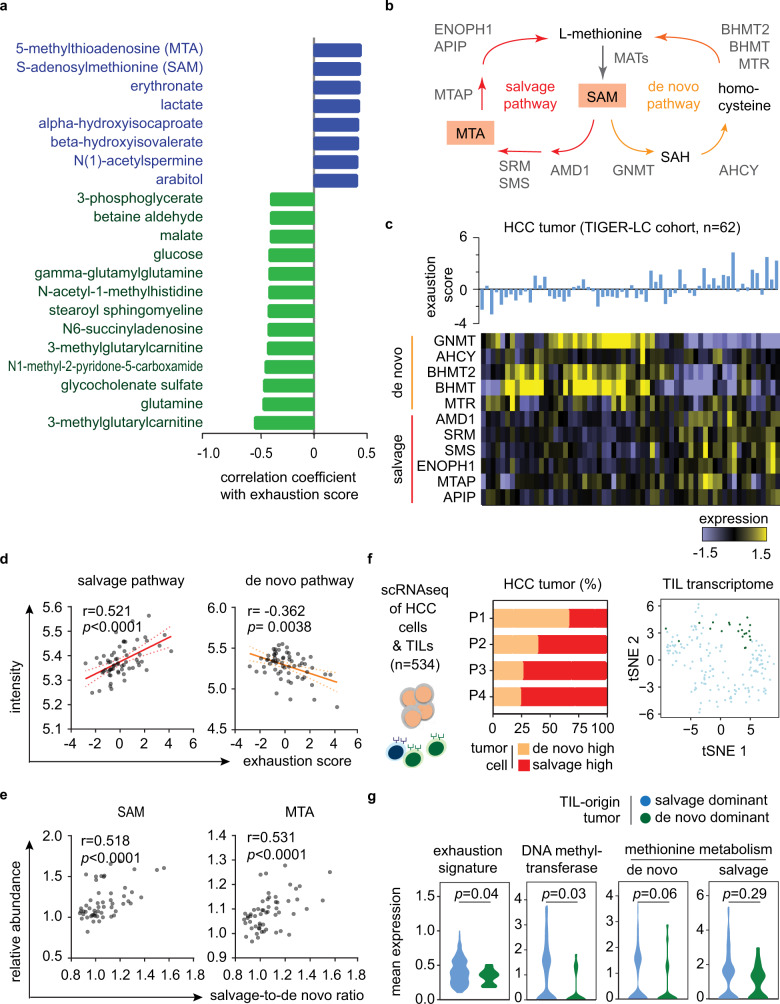
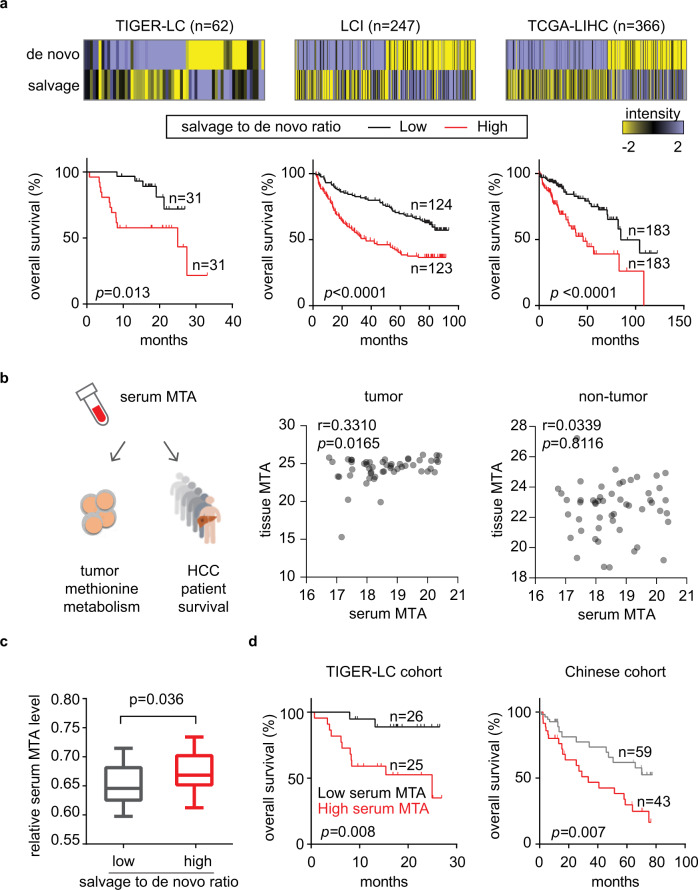
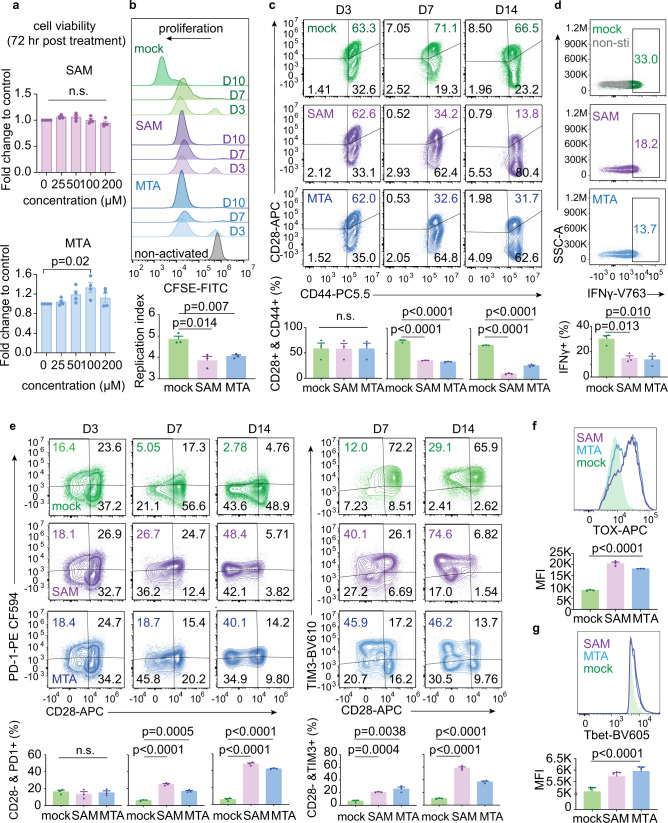
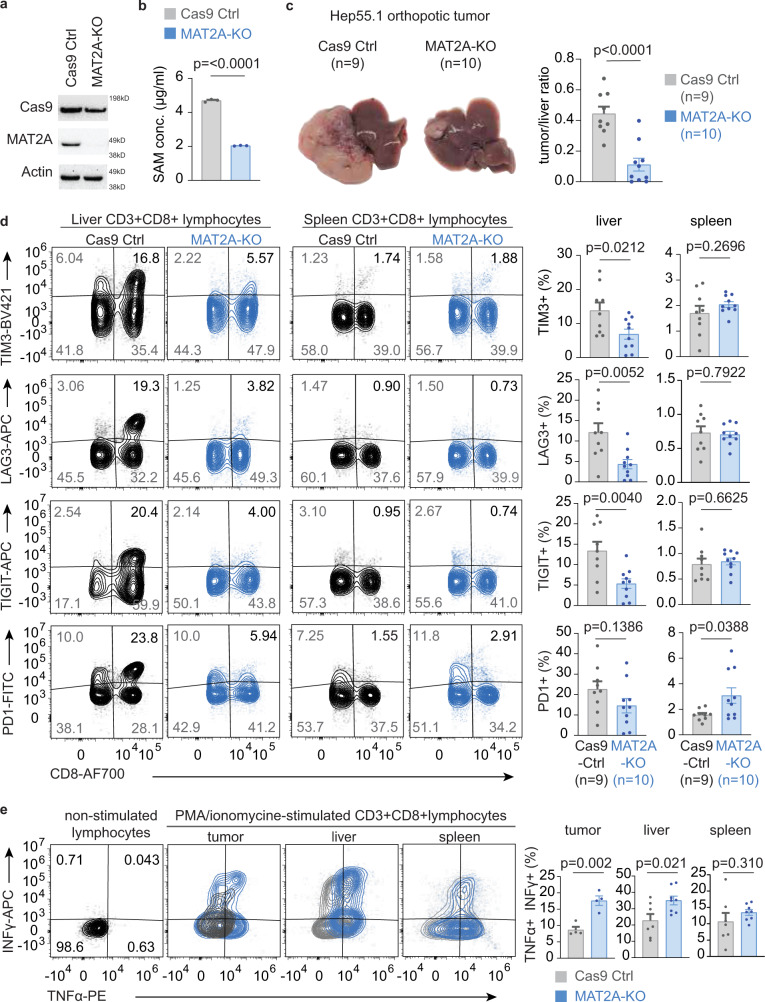
T-cell exhaustion denotes a hypofunctional state of T lymphocytes commonly found in cancer, but how tumor cells drive T-cell exhaustion remains elusive. Here, we find T-cell exhaustion linked to overall survival in 675 hepatocellular carcinoma (HCC) patients with diverse ethnicities and etiologies. Integrative omics analyses uncover oncogenic reprograming of HCC methionine recycling with elevated 5-methylthioadenosine (MTA) and S-adenosylmethionine (SAM) to be tightly linked to T-cell exhaustion. SAM and MTA induce T-cell dysfunction in vitro. Moreover, CRISPR-Cas9-mediated deletion of MAT2A, a key SAM producing enzyme, results in an inhibition of T-cell dysfunction and HCC growth in mice. Thus, reprogramming of tumor methionine metabolism may be a viable therapeutic strategy to improve HCC immunity.


Conflict of interest statement

The authors declare no competing interests.

Figures

Fig. 1
Fig. 1. Identification of exhaustion score that models CD8+ T-cell dysfunction in HCC.
a Study overview. b The expression of T-cell exhaustion signature links to tumor transcriptome and patient survival. The upper heatmap reveals the results of unsupervised hierarchical clustering of tumor samples (TIGER-LC cohort, N = 62) based on 82 genes associated with exhausted CD8 T cells (Supplementary Data 1) and the lower heatmap shows the most variable genes (n = 1533, Supplementary Data 2), and important clinical and molecular characters associated with exhaustion signature among tumor samples. According to the expressions of T-cell exhaustion genes, patients are divided into three different exhaustion clusters (ECs). c Kaplan–Meier survival analysis of the 62 HCC patients based on the ECs with two-sided log-rank p value. The survival curve of the overall cohort was shown here (gray) but was not included for the calculation of p value. d Exhaustion score predicts HCC patient survival. Patients from TIGER-LC cohort, LCI cohort, and TCGA-LIHC cohort are stratified by the median value of exhaustion score in each cohort, and the results of Kaplan–Meier survival analysis are shown here and the survival significance is determined using a two-sided log-rank test. e The correlation of exhaustion score and cytolytic score in HCC tumors. Correlation coefficient and P values are based on two-sided Spearman’s rank correlation coefficient test. Source data are provided as a Source Data file.
Fig. 2
Fig. 2. Dysregulation of methionine recycling machinery leads to increasing tumor SAM and MTA content and drives T-cell exhaustion in HCC Tumor.
a The waterfall plot demonstrates the correlation between ES and the tumor-to-non-tumor level of different metabolites in HCC tumors of TIGER-LC cohort (Supplementary Table 5). b Schema of methionine recycling machinery. c Heatmap reveals the expressions of genes involving methionine recycling pathways (lower panel) and the associated tumor ES (upper panel) in HCC tumors. d The relationship of ES and the expressions of salvage pathway and de novo pathway in HCC tumors. (n = 62) Correlation coefficient and P values are based on two-sided Spearman’s rank correlation coefficient test. e The relationships of the tumor SAM and MTA contents with the salvage-to-de novo ratio. (n = 62) Correlation coefficient and P values are assessed by two-sided Spearman’s rank correlation coefficient test. f, g Single-cell transcriptomic study on HCC tumors validates the metabolic interaction linking cancer methionine metabolism and T-cell exhaustion. Single-cell transcriptome of malignant cells and associated T cells are obtained from four HCC patients (GEO125449, n = 534). We defined malignant cells as salvage-high or de novo-high by the mean value of the salvage-to-de novo ratio of all malignant cells. We then reconstructed each tumor according to the proportion of salvage-high (colored in red) or de novo-high (colored in orange) cancer (f, left panel). According to the dominant methionine metabolic status of HCC cells, tumors from P3 and P4 are defined as salvage-dominant tumors and P1 tumor is considered as de novo-dominant tumor. 175T cells associated with the above-mentioned tumors are identified. t-SNE plot showed the transcriptome differences among T cells originated from salvage-dominant tumors to de novo-dominant tumor (f, right panel). The expressions of T-cell exhaustion-specific genes, DNA methyltransferase genes, and methionine metabolic genes of T cells were examined and summarized using violin plots g. Statistical significance is determined by two-sided independent t test. Source data are provided as a Source Data file.
Fig. 3
Fig. 3. Methionine metabolic reprogramming and serum MTA level predict HCC patient survival.
a Kaplan–Meier survival curves of patients with high versus low salvage-to-de novo ratio. The median value of the salvage-to-de novo ratio is used to divide patient into two groups and the P value is computed using a two-sided log-rank test. Heatmap attached to each cohort summarizes the intensity of salvage pathway and de novo pathway in individual HCC tumor. b The relationship of serum MTA level with the MTA level in matched tumor (right) and non-tumor (left) tissues. (n = 52) Serum MTA level is adjusted to corresponding serum methionine level for this and subsequent analysis. Correlation coefficient and P values are based on two-sided Spearman’s rank correlation coefficient test. c Serum MTA level corresponding to tumor methionine metabolic status. Comparison of serum MTA was performed on patients with available serum metabolome data and methionine metabolic status was defined by the median value of tumor salvage-to-de novo ratio (n = 20 in low salvage-to-de novo group, n = 26 in high salvage-to-de novo group). The boxplots summarize the distribution of serum MTA level in tumors with high- or low- tumor salvage-to-de novo ratio. The minimum and maximum values are described by the extension of whiskers; the medium value is indicated by the middle line within box, and the 25th and 75th percentiles are indicated by the edges of box. Statistical significance is determined by two-sided independent t test. d Serum MTA predicts HCC patient survival. HCC patients from TIGER-LC cohorts (n = 51) and from LCI cohort (n = 102) are separated by median serum MTA level and Kaplan–Meier survival analysis are shown here with two-sided log-rank p value. (Supplementary Data 4). Source data are provided as a Source Data file.
Fig. 4
Fig. 4. SAM and MTA treatment promotes dysfunction of human CD8+ T cells in vitro.
a The viabilities of activated CD8+ T cells after exposing to indicated concentrations of SAM or MTA for 72 h. Data are presented as mean ± S.D.; n = 4 independent biological experiments. P value was calculated using a one-way ANOVA test with Tukey’s multiple comparisons test for subgroup comparison. b Representative histogram of CFSE-labeled human peripheral CD8+ T cells underwent indicated treatments and indicated time points. The effects of different treatments on cell proliferation are compared using the proliferation index estimated by FlowJo (lower panel). Data are presented as mean ± S.D. and p value between mock and each treatment was calculated using two-sided independent t test. (n = 3 independent biological experiments). c Representative expressions of CD44 and CD28 of human CD8+ T cells underwent SAM, MTA or mock control treatment for 3, 7, and 4 days. Expressions of CD44 and CD28 on CD3+ CD4− CD8+ CD45+ cell were analyzed and the average fraction of cells positive for CD44 and CD28 at various time points are shown at the bottom panel. Bar, mean; error bars, S.D.; n = 3 independent biological experiments. Statistical significance was assessed by two-sided independent t test. d SAM/MTA treatment attenuated interferon-gamma secretion after PMA/ionomycin stimulation. Representative interferon-gamma expression of cells CD3+ CD4− CD8+ CD45+ T underwent indicated treatments were shown. The average fraction of cells with increasing interferon-gamma expression is shown below. Bar, mean; error bars, S.D.; n = 3 independent biological experiments. P value between mock and each treatment was calculated using two-sided independent t test. e Representative expressions of PD1, TIM3, and CD28 of human CD8+ T cells underwent SAM, MTA, or mock control treatment for 3, 7, and 14 days. The average fraction of CD3+ CD4− CD8+ CD45+ T cells positive for CD28, PD1, and TIM3 at various time points are shown at the bottom panel. Data are presented as mean ± S.D. and p value between mock and each treatment was calculated using two-sided independent t test. (n = 3 independent biological experiments). f, g SAM/MTA treatments promote the expressions of TOX and Tbet in CD8+ T cells. Representative histograms and median fluorescence intensity (MFI) of TOX and Tbet in CD3+ CD8+ TOX+ T cells f and CD3+ CD8+ Tbet+ T cells g were shown. Bar, mean; error bars, S.D.; n = 3 independent biological experiments. P value was calculated using a one-way ANOVA test with Tukey’s multiple comparisons tests. Source data are provided as a Source Data file.
Fig. 5
Fig. 5. Knockout of MAT2A reduces SAM production and suppressive in vivo tumorigenesis and T-cell dysfunction in HCC.
a Representative immunoblot of Hep-55.1 cells with stable MAT2A-KO and control of three independent experiments. Corresponding molecular weight markers of each blot were labeled at the right edge of image and the original full scan images could be find in the Source Data. b Intracellular concentration of SAM of Hep-55.1 cells with stable MAT2A-KO and control. Bar, mean; error bar, S.D. n = 3. Statistical significance is determined by two-sided independent t test. c Representative livers of mice carrying Hep-55.1 tumors with and without MAT2A-KO (left). The average ratio of tumor-to-liver weight is shown at the left panel (n = 9 in Cas9-Ctrl and n = 10 in MAT2A-KO). Bar, mean; error bar, S.D. Statistical significance is determined by two-sided independent t test. d Representative expressions of TIM3, LAG3, TIGIT, and PD1 on CD8+ T cells isolated from tumor-carrying livers and spleens. The average fraction of cells positive for each markers from liver or spleen were shown at the right two panels (n = 9 in Cas9-Ctrl, n = 10 in MAT2A-KO). Bar, mean; error bar, S.D. Statistical significance is determined by two-sided independent t test. e Representative expressions of interferon-gamma (INFγ) and tumor necrosis factor- alpha (TNFα) of CD8+ T cells after PMA/ionomycin stimulation. The average fraction of CD8+ T cells positive for INFγ and TNFα is summarized by bar plots. Lymphocytes obtained from tumors (n = 4 biological independent samples from Cas9-Ctrl and from MAT2A-KO tumors), liver (n = 7 biological independent samples from Cas9-Ctrl mice, n = 8 in biological independent samples MAT2A-KO) and spleen (n = 7 biological independent samples in Cas9-Ctrl, n = 8 biological independent samples in MAT2A-KO) were stimulated with PMA/ionomycin for 4 h and stained for cytokine expressions. Bar, mean; error bar, S.D. Statistical significance is determined by two-sided independent t test. Source data are provided as a Source Data file.
Fig. 6
Fig. 6. SAM and MTA treatment reduced the global chromatin accessibilities of activated CD8+ T cell.
a Principal component analysis of peak accessibility in SAM-, MTA-, and mock-treated activated CD8+ T cells, as well as non-activated CD8+ T cells. Dot represented the consensus peaks of CD8+ T cells underwent indicated treatment (n = 3 in each treatment condition). b Chromatin accessibility heatmap of SAM-, MTA-, and mock-treated activated CD8+ T cells. c Number of peak changes by treatments. (FDR < 0.05). d Heatmap of accessibility intensity in 3019 loci associated with T-cell signaling pathway. e ATAC-seq coverage at CD28 and PDCD1. Peaks were highlighted in yellow. f Sequence motifs enriched in the open chromatin regions of mock-treated or SAM/MTA-treated activated CD8 T cells. g Pathway analysis of the most variable peaks associated with SAM/MTA treatment (FDR < 0.05). h SAM/MTA-induced chromatin changes correlated with T-cell transcriptome changes in clinical HCC tumors. The differentially expressed ATAC-seq peaks (FDR < 0.05, fold change >1.5) and the most differentially expressed genes in HCC tumors of TIGER-LC cohort (FDR < 0.05) were compared. After excluding tumor-specific genes, we identified 12 genes as SAM/MTA-driven T-cell genes, defined as genes showed the most variable chromatin changes in SAM/MTA-treated CD8+ T cells and, coincidentally, were significantly upregulated in salvage-dominant HCC tumors. The expressions of SAM/MTA-driven T-cell genes were examined in HCC-infiltrating T cells (GEO125449). The boxplots summarize the distribution of the mean expression of SAM/MTA-driven T-cell genes obtained from salvage-dominant tumors (n = 154 T lymphocytes from three patients) to de novo-dominant tumors (n = 21 T lymphocytes from one patient). The minimum and the maximum values are described by the extension of whiskers; the medium value is indicated by the middle line within box, and the 25th and 75th percentiles are indicated by the edges of box. Statistical significance is determined by two-sided independent t test. ATAC-sequencing data are available at the GEO repository under Study Accession GSE166213. Source data are provided as a Source Data file.

References

    1. Zindl CL, Chaplin DD. Tumor immune evasion. Science. 2010;328:697–698. doi: 10.1126/science.1190310. - DOI - PMC - PubMed
    1. Milo I, et al. The immune system profoundly restricts intratumor genetic heterogeneity. Sci. Immunol. 2018;3:eaat1435. doi: 10.1126/sciimmunol.aat1435. - DOI - PubMed
    1. Thommen DS, Schumacher TN. T cell dysfunction in cancer. Cancer Cell. 2018;33:547–562. doi: 10.1016/j.ccell.2018.03.012. - DOI - PMC - PubMed
    1. Wherry EJ, Kurachi M. Molecular and cellular insights into T cell exhaustion. Nat. Rev. Immunol. 2015;15:486–499. doi: 10.1038/nri3862. - DOI - PMC - PubMed
    1. Wang Z, et al. Methionine is a metabolic dependency of tumor-initiating cells. Nat. Med. 2019;25:825–837. doi: 10.1038/s41591-019-0423-5. - DOI - PubMed

Publication types

MeSH terms