. 2021 Mar 5;7(1):24.
doi: 10.1038/s41531-021-00171-0.

Gait speed in clinical and daily living assessments in Parkinson's disease patients: performance versus capacity

Affiliations

Gait speed in clinical and daily living assessments in Parkinson's disease patients: performance versus capacity

Arash Atrsaei et al. NPJ Parkinsons Dis. .

Abstract

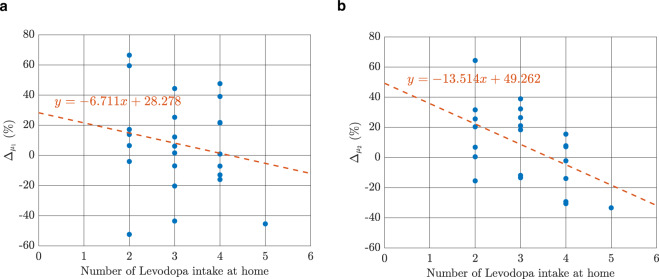
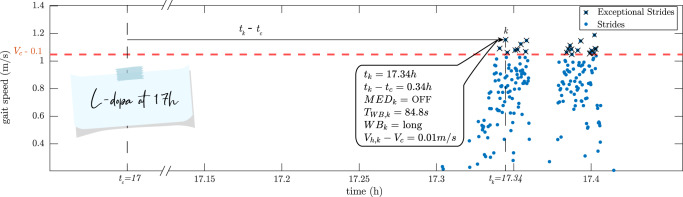
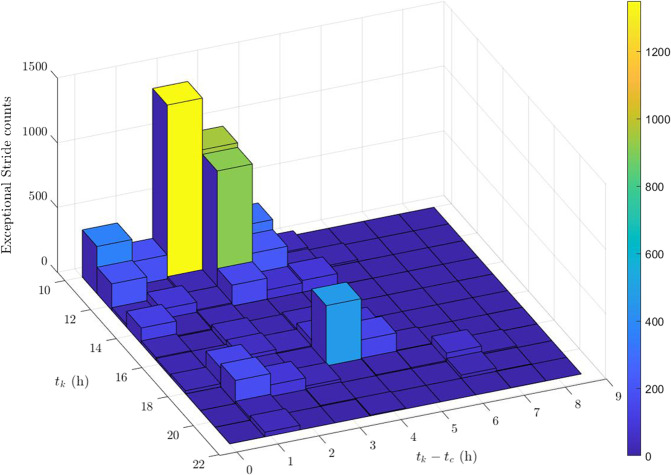
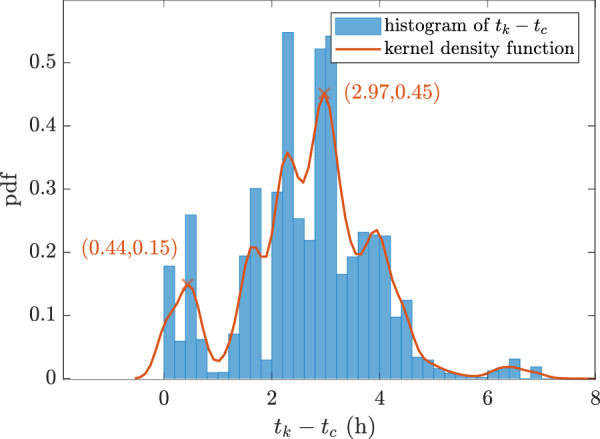
Gait speed often referred as the sixth vital sign is the most powerful biomarker of mobility. While a clinical setting allows the estimation of gait speed under controlled conditions that present functional capacity, gait speed in real-life conditions provides the actual performance of the patient. The goal of this study was to investigate objectively under what conditions during daily activities, patients perform as well as or better than in the clinic. To this end, we recruited 27 Parkinson's disease (PD) patients and measured their gait speed by inertial measurement units through several walking tests in the clinic as well as their daily activities at home. By fitting a bimodal Gaussian model to their gait speed distribution, we found that on average, patients had similar modes in the clinic and during daily activities. Furthermore, we observed that the number of medication doses taken throughout the day had a moderate correlation with the difference between clinic and home. Performing a cycle-by-cycle analysis on gait speed during the home assessment, overall only about 3% of the strides had equal or greater gait speeds than the patients' capacity in the clinic. These strides were during long walking bouts (>1 min) and happened before noon, around 26 min after medication intake, reaching their maximum occurrence probability 3 h after Levodopa intake. These results open the possibility of better control of medication intake in PD by considering both functional capacity and continuous monitoring of gait speed during real-life conditions.


Conflict of interest statement

The authors declare no competing interests.

Figures

Fig. 1
Fig. 1. Distribution of gait speed at home and the average values of the gait speed for the clinical assessments for each patient.
For each patient, the average gait speed during the 20-m walking test was considered as their capacity.
Fig. 2
Fig. 2. An example of the gait speed probability density function (pdf) for one of the patients (P6).
The distribution is shown at (a) home and (b) at the clinic. The red fitted curves are the first and second terms of the bimodal Gaussian distribution introduced by Eq. 1, the parameters c1, c2, μ1, μ2, σ1, and σ2 are the Gaussian mixture model parameters defined in Eq. 1.
Fig. 3
Fig. 3. The gait speed probability density function (pdf) for all the patients together.
The distribution is shown at (a) home normalized by Vh,95 and (b) the clinic normalized by Vc,95, the red fitted curves are the first and second terms of the bimodal Gaussian distribution introduced by Eq. 1.
Fig. 4
Fig. 4. The boxplots comparing the gait speed distribution between the clinic and home for all the patients.
(a) The percentage of the difference between clinic and home for preferred gait speeds μ1and μ2, (b) the area under the ROC curve (AUC) of CDFclinic versus CDFhome: Center line: median; box limits: upper and lower quartiles; whiskers: 1.5 × interquartile range.
Fig. 5
Fig. 5. The relationship between the number of medication doses taken during the interval of data recording in home assessment.
This linear relationship is shown for (a) Δμ1and (b) Δμ2.
Fig. 6
Fig. 6. The information extracted for Exceptional Stride k for one of the patients as an example.
Each blue dot shows the gait speed of a gait cycle at a specific time of the day during daily activities. This patient took Levodopa at time tc=17h. Vc is the capacity of the patient, i.e., gait speed during fast walking test in the clinic. The Exceptional Strides have marked with black crosses. k is one example of the Exceptional Strides with the information extracted according to section II-F. No walking with a duration of more than 15 s occurred after 17 h and before 17.3 h.
Fig. 7
Fig. 7. 3D Histogram plot of Exceptional Stride time of occurrence (tk) and their time difference from their corresponding previous medication intake (tktc).
The yellow bar demonstrates the highest peak of the Exceptional Strides that occurred around 10:00 to 10:30 and had a time difference of ~2 h with their previous medication intake. Therefore, they correspond to the medication doses taken around 8:00 to 8:30.
Fig. 8
Fig. 8. The probability distribution function (pdf) of Exceptional Strides in relation to medication intake time (blue) with the fitted Gaussian mixture model (red).
Two peaks can be distinguished from the kernel smoothening function at 0.44 and 2.97 h.

References

    1. Morris M, Iansek R, Matyas T, Summers J. Abnormalities in the stride length-cadence relation in Parkinsonian gait. Mov. Disord. 1998;13:61–69. doi: 10.1002/mds.870130115. - DOI - PubMed
    1. Jankovic J. Parkinson’s disease: clinical features and diagnosis. J. Neurol., Neurosurg. Psychiatry. 2008;79:368–376. doi: 10.1136/jnnp.2007.131045. - DOI - PubMed
    1. Iarkov A, Barreto GE, Grizzell JA, Echeverria V. Strategies for the treatment of Parkinsonas disease: beyond dopamine. Front. Aging Neurosci. 2020;12:4. doi: 10.3389/fnagi.2020.00004. - DOI - PMC - PubMed
    1. Ramaker C, Marinus J, Stiggelbout AM, van Hilten BJ. Systematic evaluation of rating scales for impairment and disability in Parkinson’s disease. Mov. Disord. 2002;17:867–876. doi: 10.1002/mds.10248. - DOI - PubMed
    1. Heijmans M, et al. Monitoring Parkinsonas disease symptoms during daily life: a feasibility study. npj Park Dis. 2019;5:1–6. doi: 10.1038/s41531-019-0074-8. - DOI - PMC - PubMed

LinkOut - more resources