. 2021 Mar 5;12(1):1480.
doi: 10.1038/s41467-021-21771-7.

Inherently confinable split-drive systems in Drosophila

Affiliations

Inherently confinable split-drive systems in Drosophila

Gerard Terradas et al. Nat Commun. .

Abstract

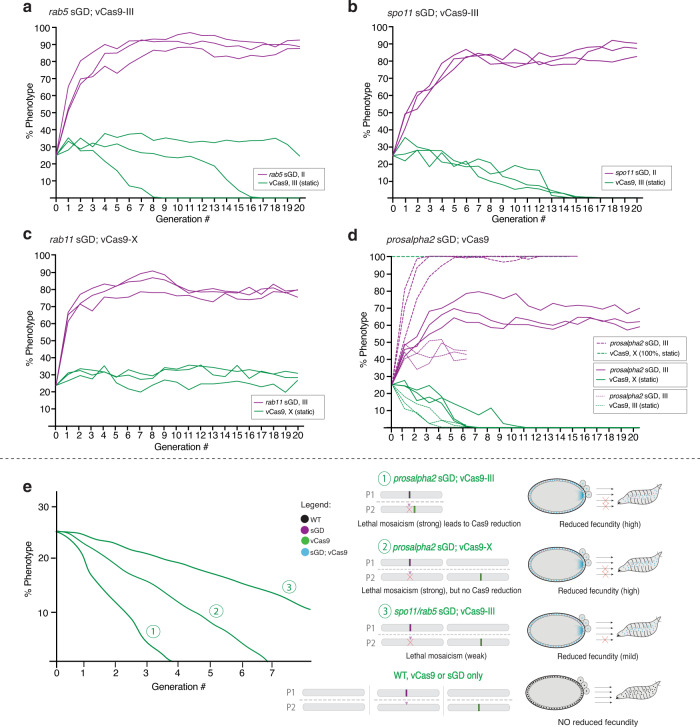
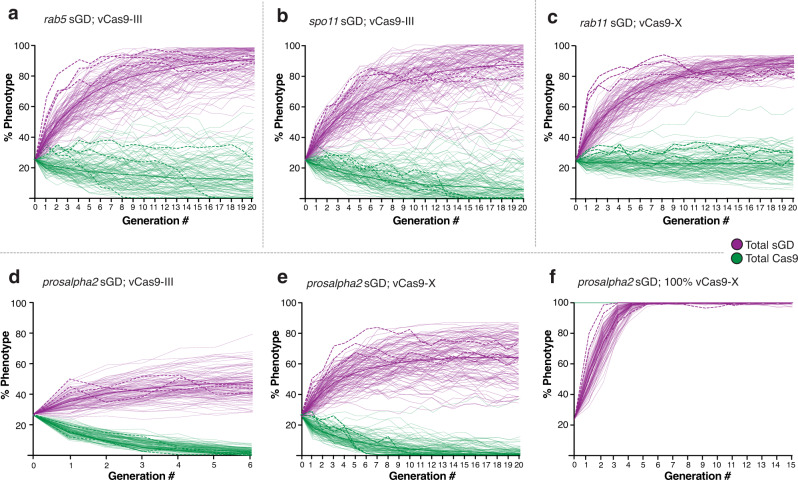
CRISPR-based gene-drive systems, which copy themselves via gene conversion mediated by the homology-directed repair (HDR) pathway, have the potential to revolutionize vector control. However, mutant alleles generated by the competing non-homologous end-joining (NHEJ) pathway, resistant to Cas9 cleavage, can interrupt the spread of gene-drive elements. We hypothesized that drives targeting genes essential for viability or reproduction also carrying recoded sequences that restore endogenous gene functionality should benefit from dominantly-acting maternal clearance of NHEJ alleles combined with recessive Mendelian culling processes. Here, we test split gene-drive (sGD) systems in Drosophila melanogaster that are inserted into essential genes required for viability (rab5, rab11, prosalpha2) or fertility (spo11). In single generation crosses, sGDs copy with variable efficiencies and display sex-biased transmission. In multigenerational cage trials, sGDs follow distinct drive trajectories reflecting their differential tendencies to induce target chromosome damage and/or lethal/sterile mosaic Cas9-dependent phenotypes, leading to inherently confinable drive outcomes.


Conflict of interest statement

E.B. has equity interests in Synbal and Agragene, companies that may potentially benefit from the research results and also serve on the company’s Scientific Advisory Board and Board of Directors. O.S.A. also has equity interests in Agragene. The terms of this arrangement have been reviewed and approved by the University of California, San Diego in accordance with its conflict of interest policies. The remaining authors declare no competing interests.

Figures

Fig. 1
Fig. 1. Experimental design of the split gene-drive system in essential loci.
a Schematic of the genetic constructs engineered and tested in the study. All constructs contain a recoded cDNA of the target gene that restores its functionality upon insertion of the transgene, a specific gRNA, and expression of 3xP3-tdTomato. Static Cas9 lines encode a nanos or vasa-driven Cas9 and a selectable marker, Opie2-dsRed or 3xP3-GFP, respectively. b Outline of the genetic cross schemes used to demonstrate the driving efficiency of each sGD, comparing systems where the sGD, Cas9 and wildtype (WT, +) are located in the same (right panel) or different chromosomes (left panel). F1 trans-heterozygotes (carriers of both Cas9 and sGD in trans) were singly crossed to WT individuals to assess germline transmission rates by scoring % of the fluorescence markers in F2 progeny. The conversion event at the sGD locus is shown with a triangle in F1 individuals. c Overview of how data is plotted throughout the paper. F1 germline inheritance is plotted in two independent columns, one that refers to the static Cas9, which should be inherited at Mendelian ratios since it does not have driving capacity, and a second column that displays the biased inheritance of the sGD transgene. Graph contains no empirical data. d Chromosomal location and insertion sites of all sGD and static Cas9 transgenes in the Drosophila melanogaster genome.
Fig. 2
Fig. 2. sGD elements display different super-Mendelian inheritance patterns depending on the trans-heterozygote progenitor sex.
Genetic crosses performed using the sGD transgenes in combination with vasa or nanos-driven Cas9 lines located in the first (X), second (II) or third (III) chromosomes. Graph contains data for a rab5; b spo11; c rab11; and d prosalpha2 sGDs. Single F1 germline conversion was assessed by scoring the markers for both transgenes in the F2 progeny. Inheritance of Cas9 and sGD is depicted using green and purple dots, respectively. Each single cross is shown as a single data point. Values for inheritance mean, number of crosses (N) and individuals scored (n) are shown atop of the graph in line with each respective dataset. Sex of the parental (F1) trans-heterozygote is indicated in the X-axis. sGD-Cas9 combinations depicted in bold represent pairings that were progressed to cage trials and further genotypic studies. Error bars represent mean values ± SEM. Stars represent statistical significance (****p < 0.0001; ***p < 0.001; **p < 0.01; *p < 0.05) for F1 male-to-female sGD-copying differences (black, two-sided t-test) and to detect Cas9 being inherited below Mendelian frequencies (green, χ2). Raw phenotypical data is provided as “Supplementary Data 1”.
Fig. 3
Fig. 3. Profiles of NHEJ events in single-generation crosses versus multigenerational cages.
Production of NHEJ events in single crosses (ad) and cage trials (eh). For single-cross data, target regions were amplified from single non-fluorescent F2 individuals generated in Fig. 2, sequenced through Sanger sequencing and analyzed. A bar depicts the % of sGD+ (purple) and % of non-fluorescent (sGD, gray) flies for each tested locus. Genotypic data is depicted in pie charts representing the prevalence of specific indel mutations in sGD individuals for a rab5, b spo11, c rab11, d prosalpha2 loci. Each section of the pie chart describes the kind of NHEJ that is formed and its percentage among the total tested sGD (NHEJ/WT) heterozygotes. The specific sequence of prominent NHEJ events, along with its corresponding prevalence, is reported under each pie chart. gRNA sequence of each sGD is depicted in blue with its PAM sequence shown in red. To generate the NHEJ cage trial data (eh), non-fluorescent sGD individuals were pooled at every generation and used to amplify their target site region, which was deep sequenced to assess formation of NHEJ alleles. WT sequences (gray), in frame deletions (blue), frameshift deletions (red) and insertions (yellow) are shown in bars at each generation to represent the distribution of alleles in the sGD population (left) and among the total population (sGD+ and sGD, right). Purple diagonally-dotted bars show the sGD+ population percentage.
Fig. 4
Fig. 4. sGD driving experiments in cage trials.
Virgin sGD/Cas9 trans-heterozygotes and WT flies were seeded at a 1:3 ratio. Each generation, flies in a cage were randomly split in half. One half was scored for eye fluorescence (Gn) while the other was used to seed fresh cages (Gn+1). Purple traces indicate sGD+ progeny, green traces indicate Cas9+ progeny. Experiments were done in triplicate and each line represents a separate cage. a rab5 sGD; vCas9-III. The sGD prevalence increases exponentially in the cage (84±6%) up to G4 and then plateaus slowly. sGD highest percentage occurs at G10 (92 ± 4%). Cas9 decreases in two of the three cages from 25% to 0% by G8 and G15, respectively. b spo11 sGD; vCas9-III. All three replicates reach their highest prevalence in the cage (85 ± 2%) by G6-7 and then plateau. Cas9 decreases linearly from 25% to 0% by G15 in all three replicates. c rab11 sGD; vCas9-X. sGD proportions in the cage slowly increase linearly (83±6%) up to G8. Cas9 remains steady at seeding levels (28 ± 3%), suggesting continuous Mendelian transmission. d prosalpha2 sGD drive dynamics depend on the location of the static Cas9, as well as seeding ratios. Bold lines reflect sGD; vCas9-X, thin dashes show cage trials using vCas9-III and thicker dashes depict drive in a vCas9-X-saturated population. Prosalpha2 sGD; vCas9 combinations produce different driving fates and outcomes, providing a flexible tool for deployment. e Hypothesis on cage and drive behavior of the different sGDs and vCas9 reduction over time. Raw phenotypic scoring is provided as “Supplementary Data 2”.
Fig. 5
Fig. 5. Mathematical model simulations recapitulate cage trial experimental data.
Four mathematical models were designed based on target gene biology and behavior: split drive in autosomes targeting viability (a), split drive in autosomes affecting fecundity (b), linked split drive (d) and X-linked Cas9 split drive targeting viability (c, e, f). Simulations were run using estimated and fitted parameter values and 100 stochastic model realizations depicted in thin purple (sGD) and green (Cas9) lines. Thicker lines show the mean of those 100 simulations. For comparison, dashed curves represent the collected experimental data.

References

    1. McFarlane GR, Whitelaw CBA, Lillico SG. CRISPR-based gene drives for pest control. Trends Biotechnol. 2018;36:130–133. doi: 10.1016/j.tibtech.2017.10.001. - DOI - PubMed
    1. Adolfi A, et al. Efficient population modification gene-drive rescue system in the malaria mosquito Anopheles stephensi. Nat. Commun. 2020;11:5553. doi: 10.1038/s41467-020-19426-0. - DOI - PMC - PubMed
    1. Hammond A, et al. A CRISPR-Cas9 gene drive system targeting female reproduction in the malaria mosquito vector Anopheles gambiae. Nat. Biotechnol. 2016;34:78–83. doi: 10.1038/nbt.3439. - DOI - PMC - PubMed
    1. Macias, V. M., Ohm, J. R. & Rasgon, J. L. Gene drive for mosquito control: Where did tt come from and where are we headed? Int. J. Environent. Res. Public Health14, 10.3390/ijerph14091006 (2017). - PMC - PubMed
    1. Li, M. et al. Development of a confinable gene drive system in the human disease vector Aedes aegypti. eLife9, 10.7554/eLife.51701 (2020). - PMC - PubMed

Publication types

LinkOut - more resources