. 2021 Jul;26(7):3383-3394.
doi: 10.1038/s41380-021-01048-7. Epub 2021 Mar 5.

Circadian rhythms in bipolar disorder patient-derived neurons predict lithium response: preliminary studies

Affiliations

Circadian rhythms in bipolar disorder patient-derived neurons predict lithium response: preliminary studies

Himanshu K Mishra et al. Mol Psychiatry. 2021 Jul.

Abstract

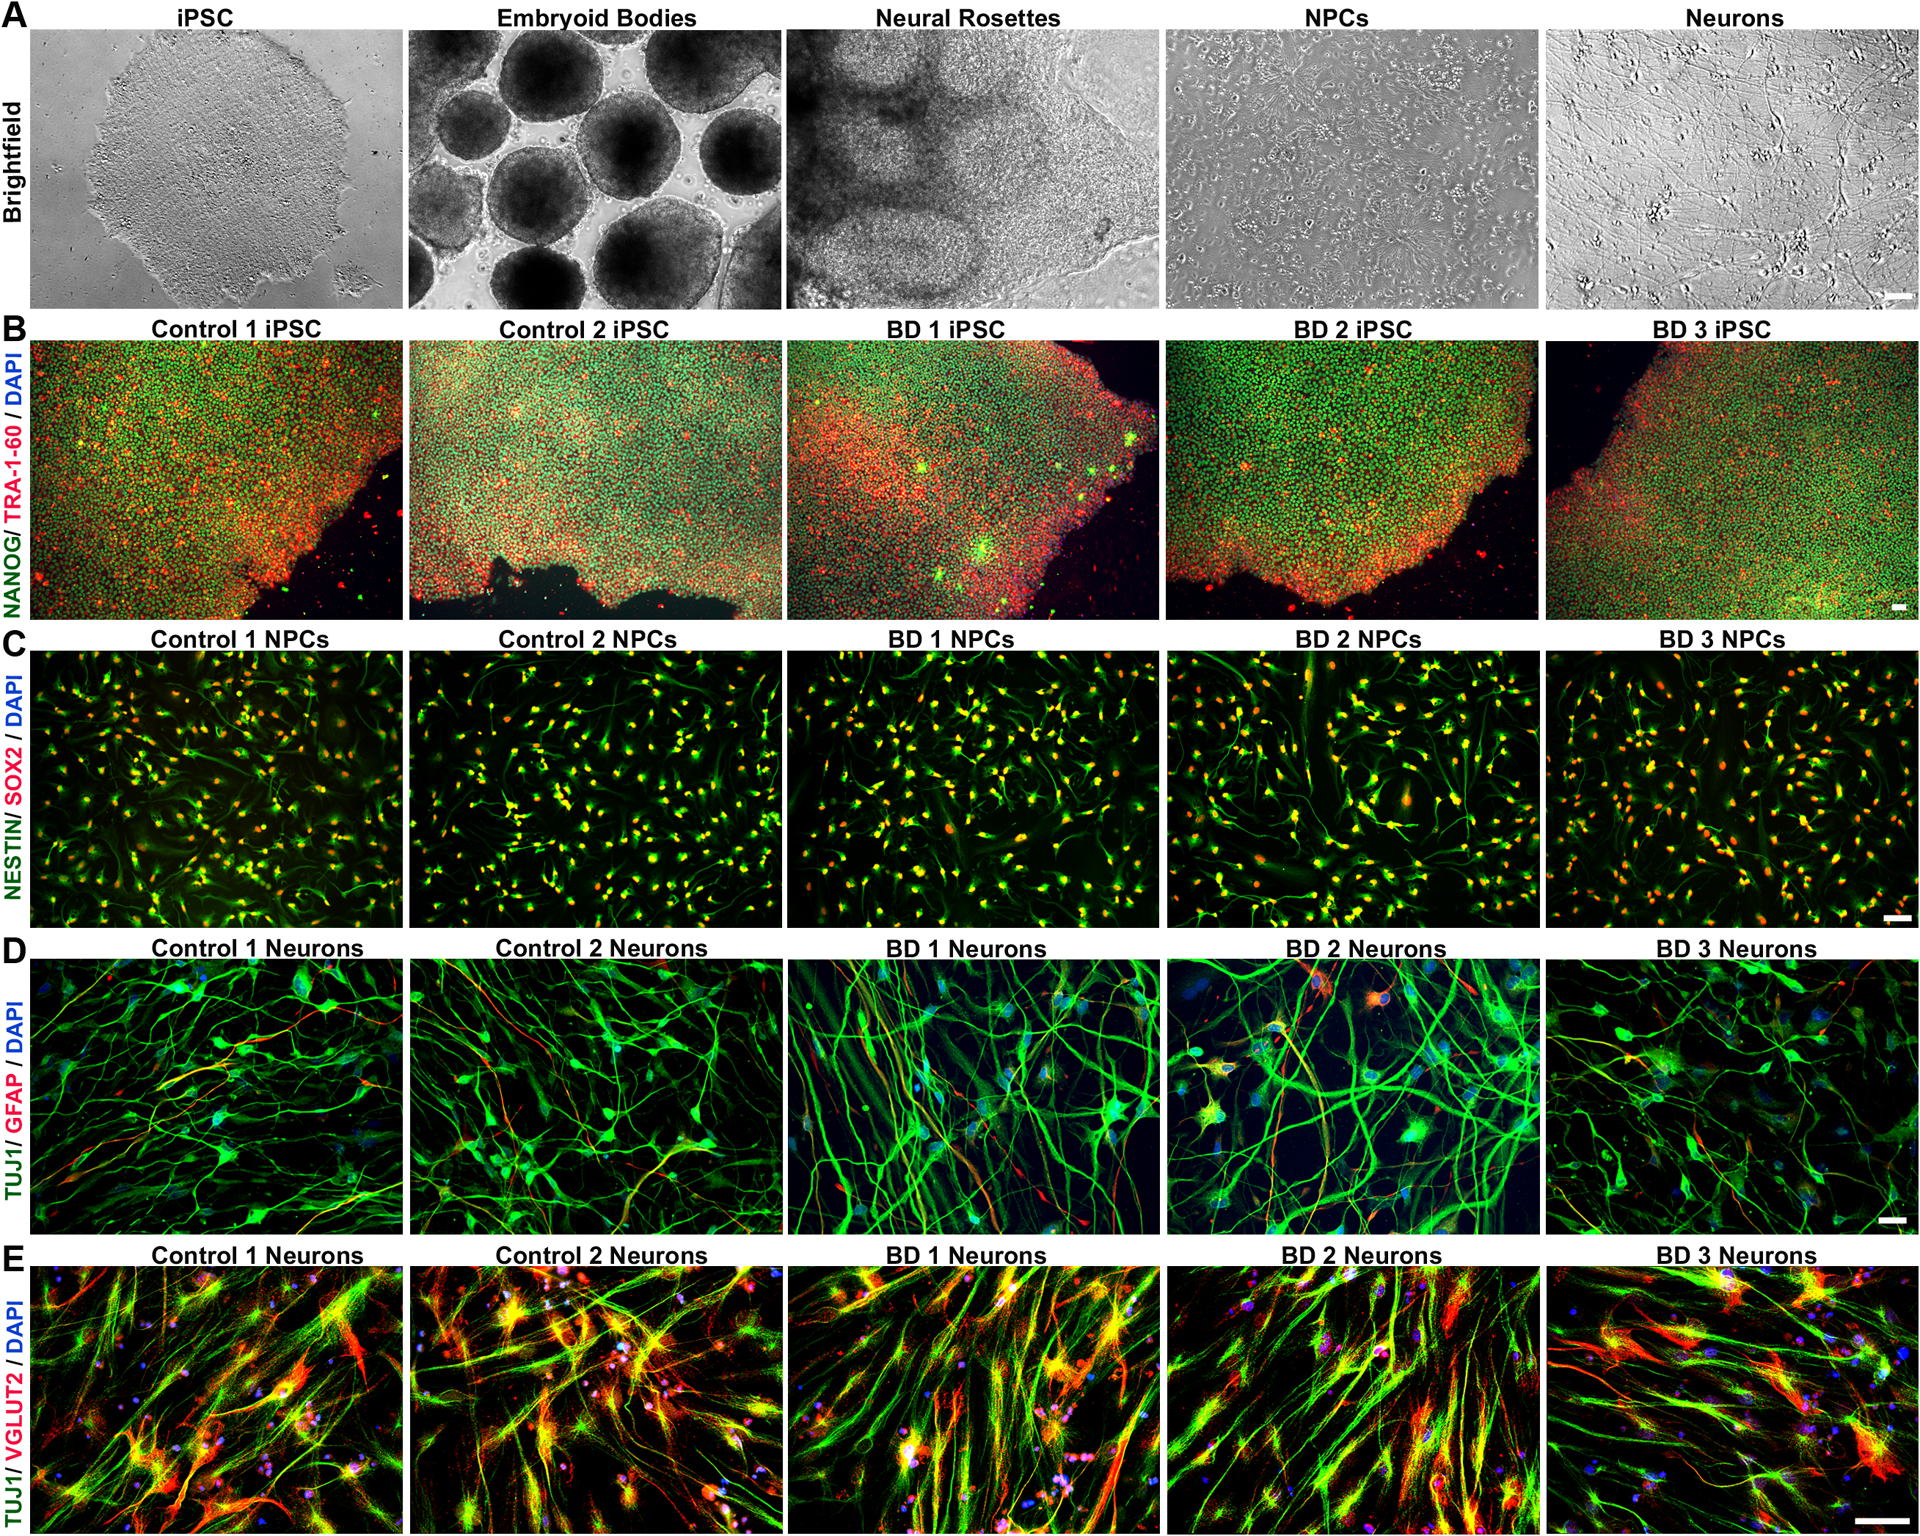
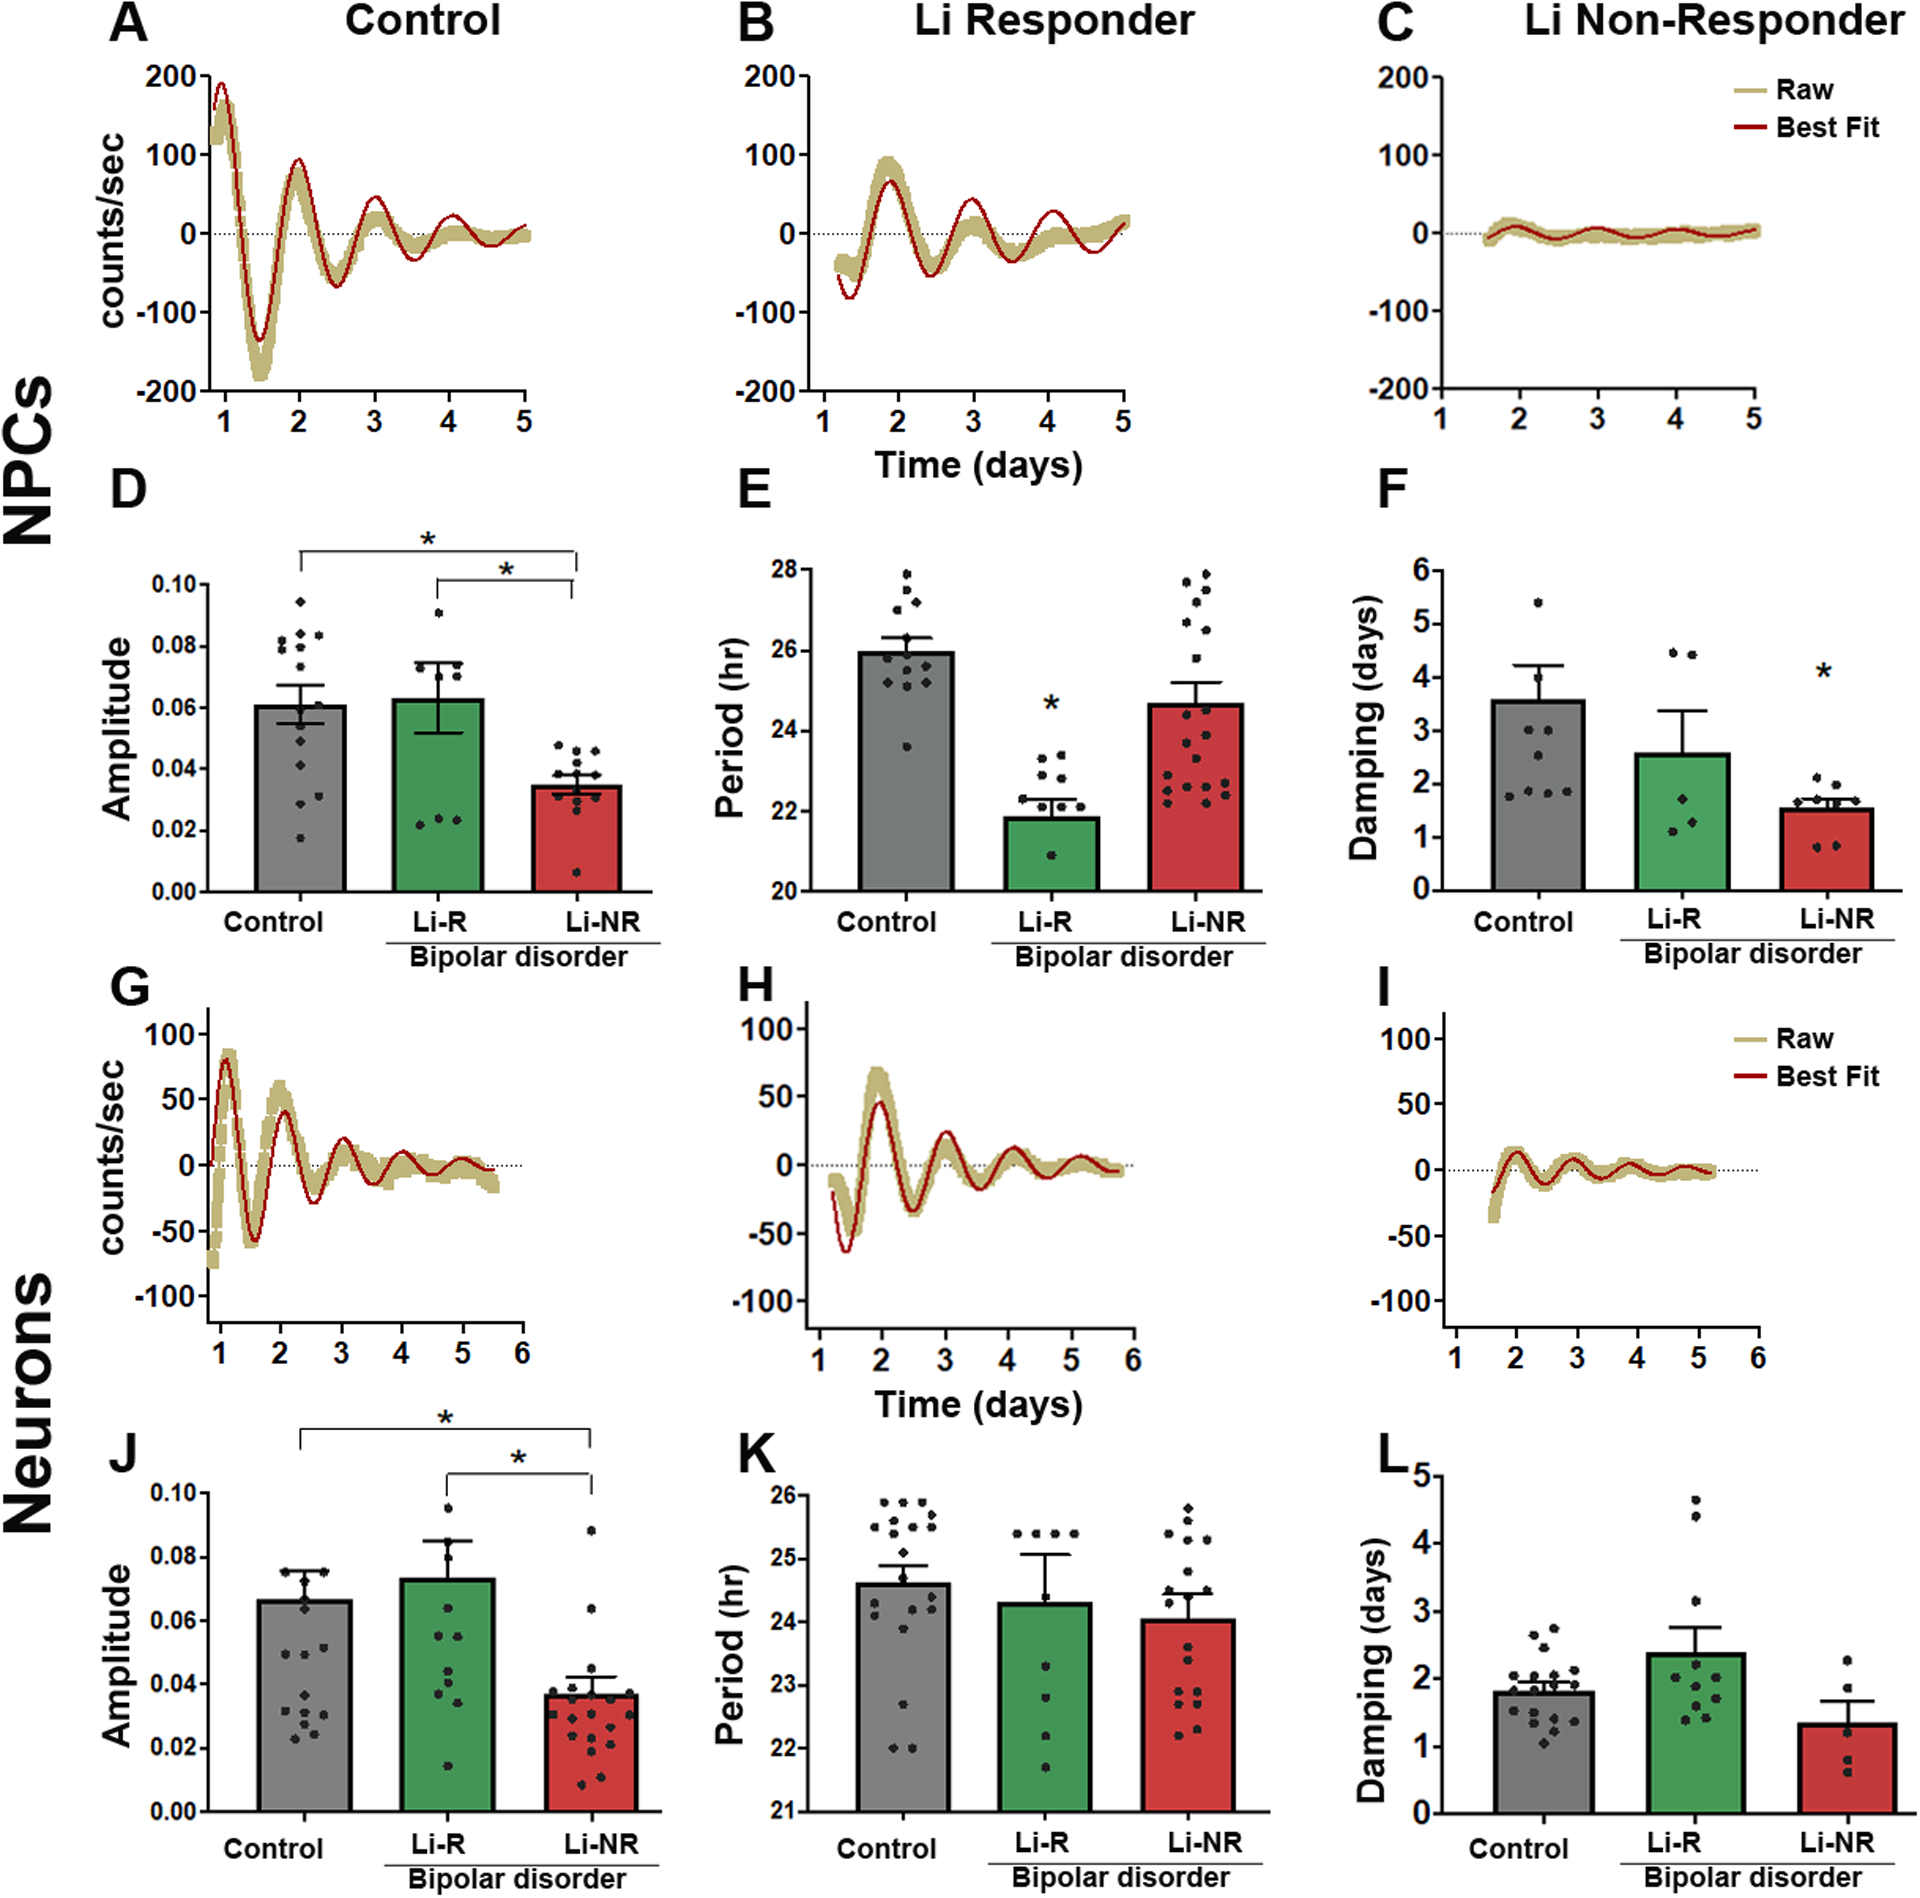
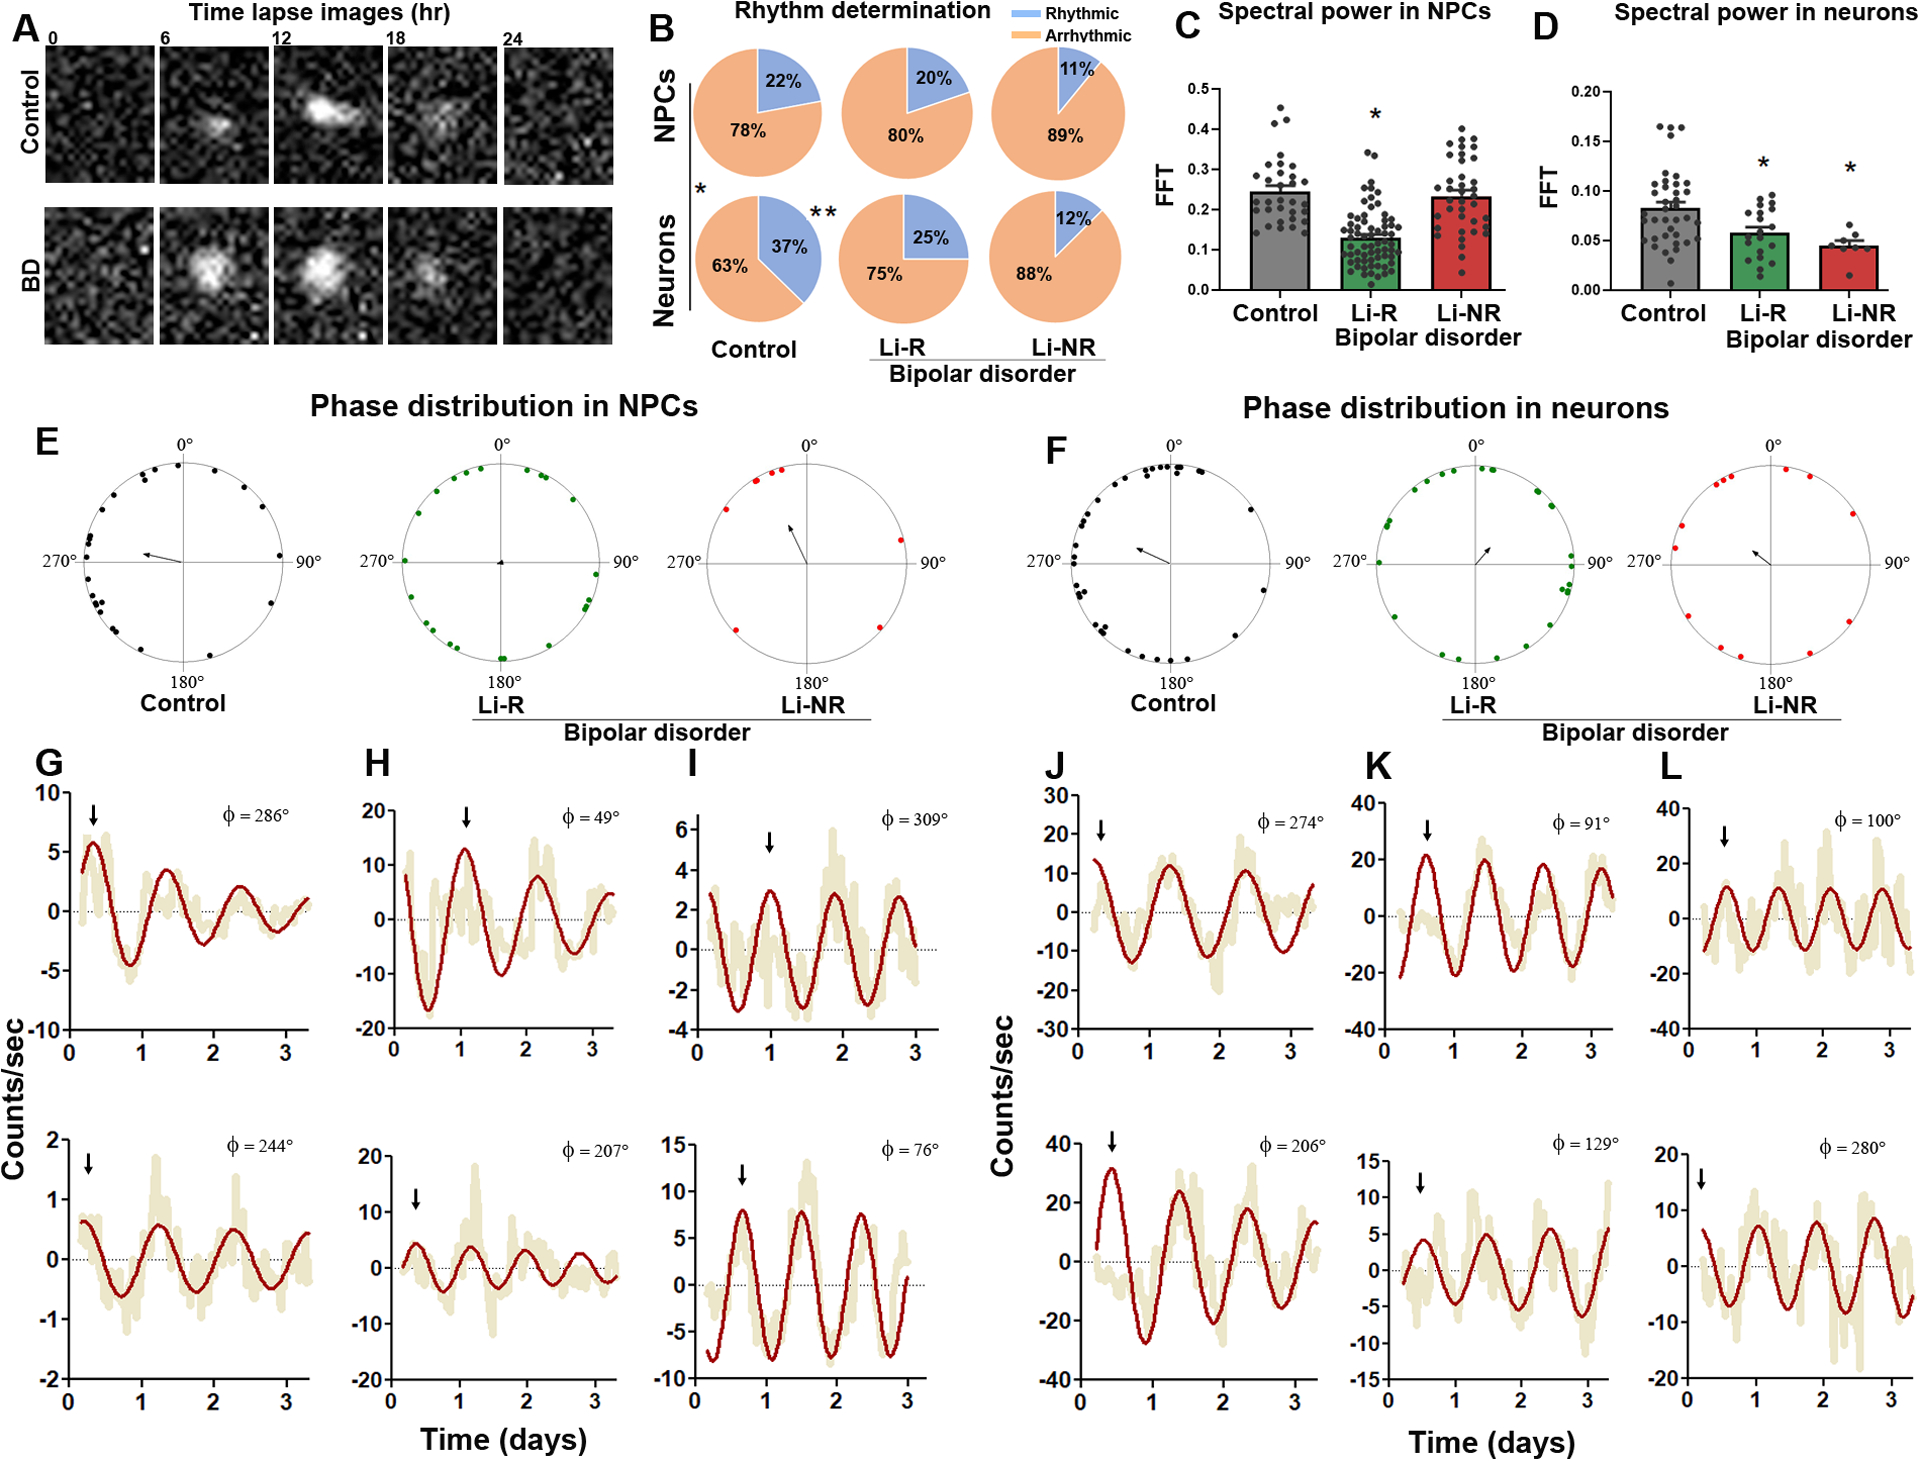
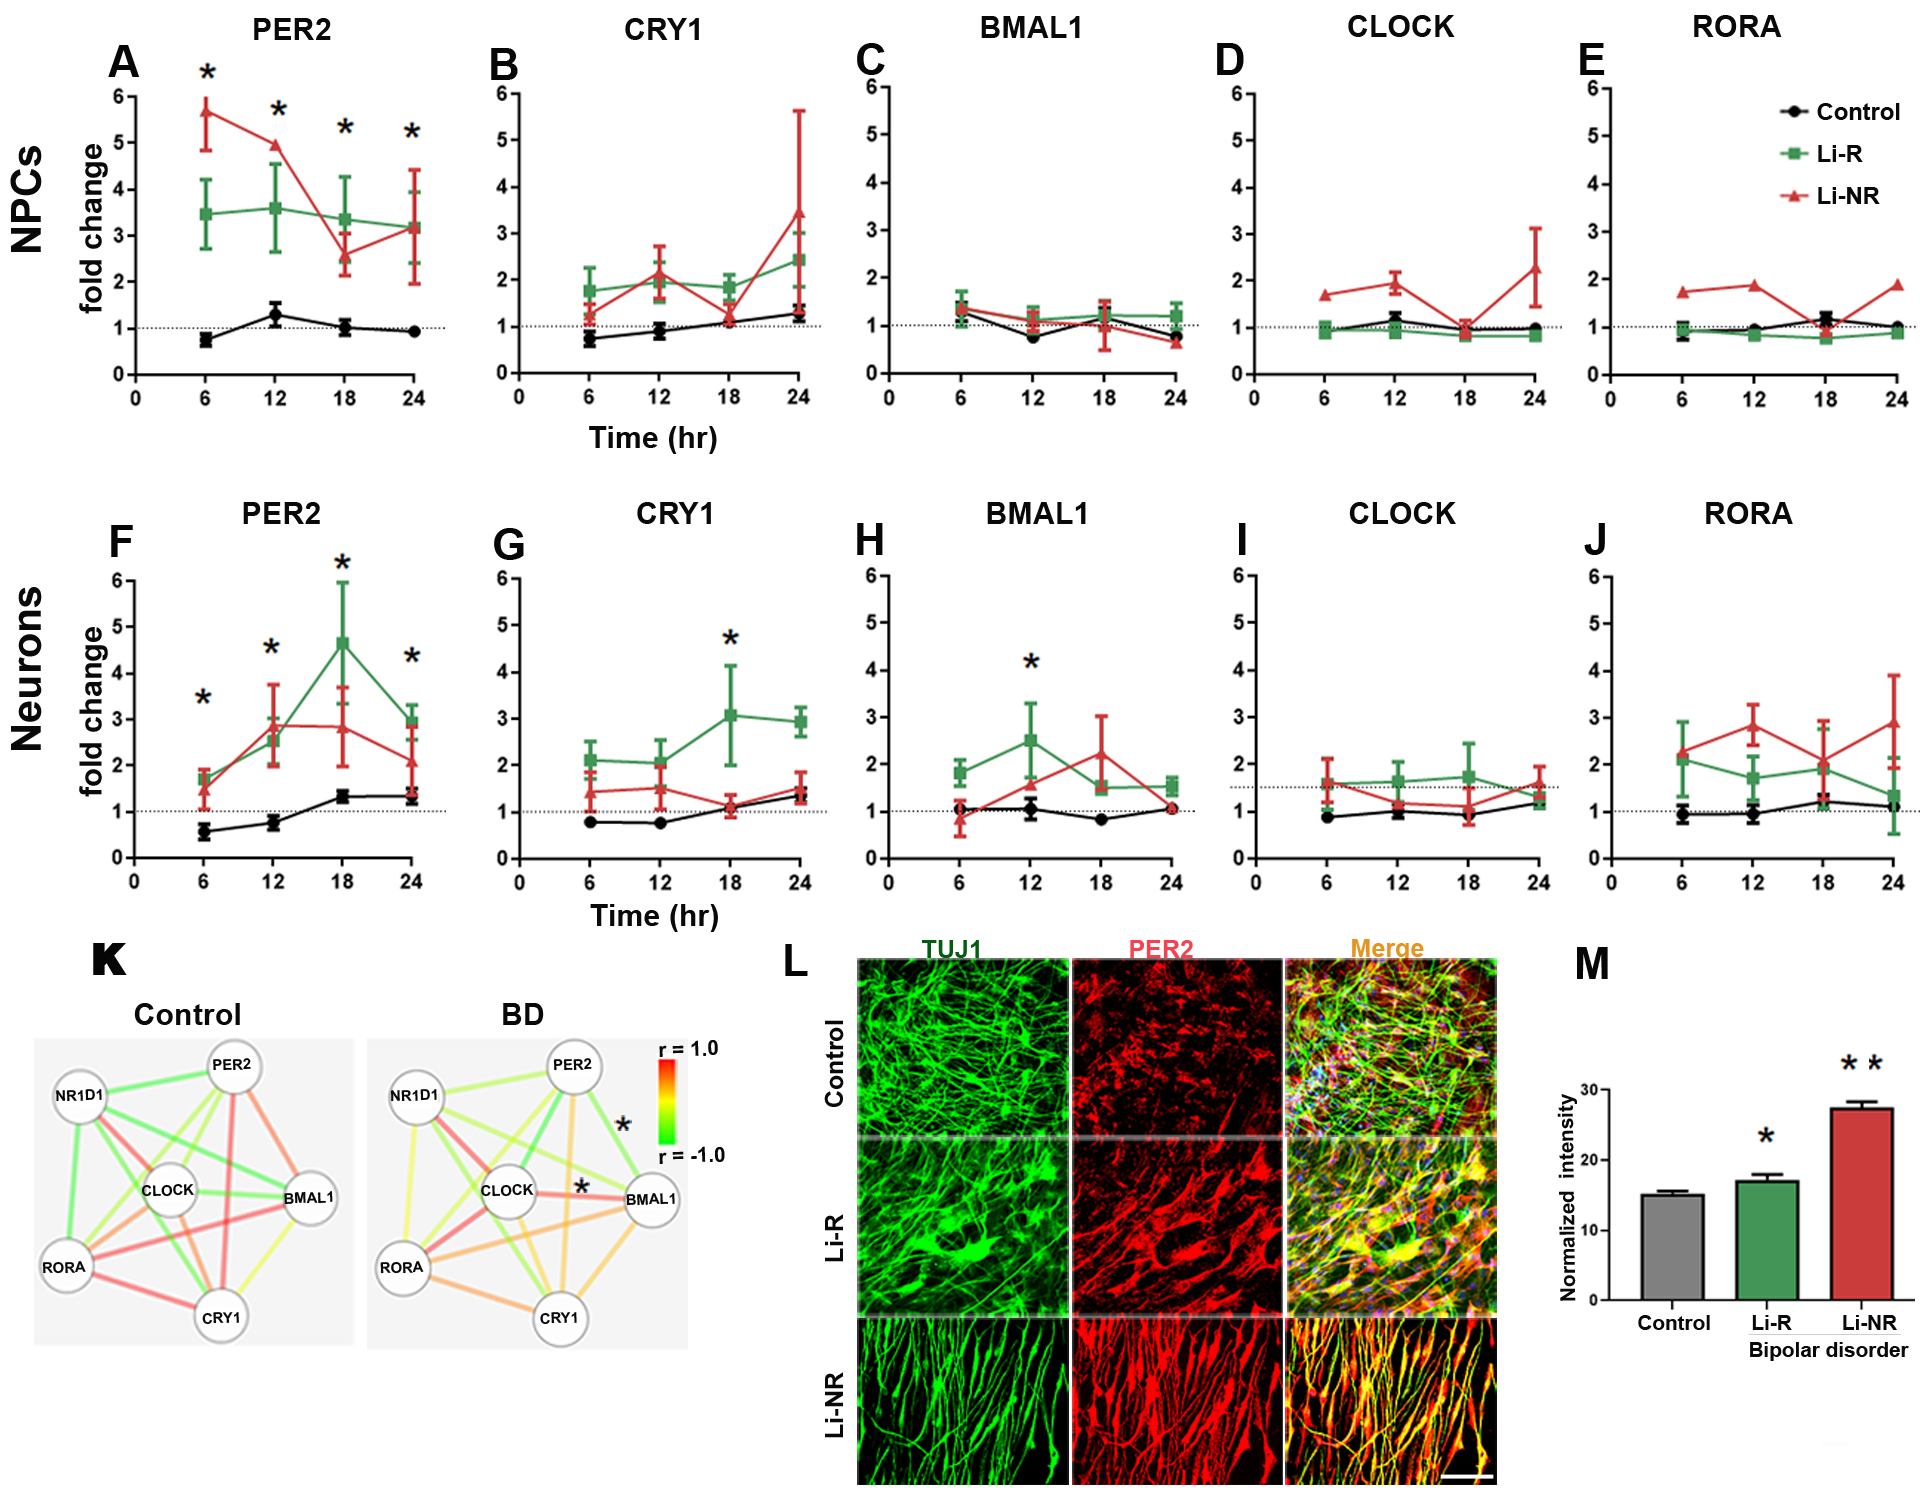
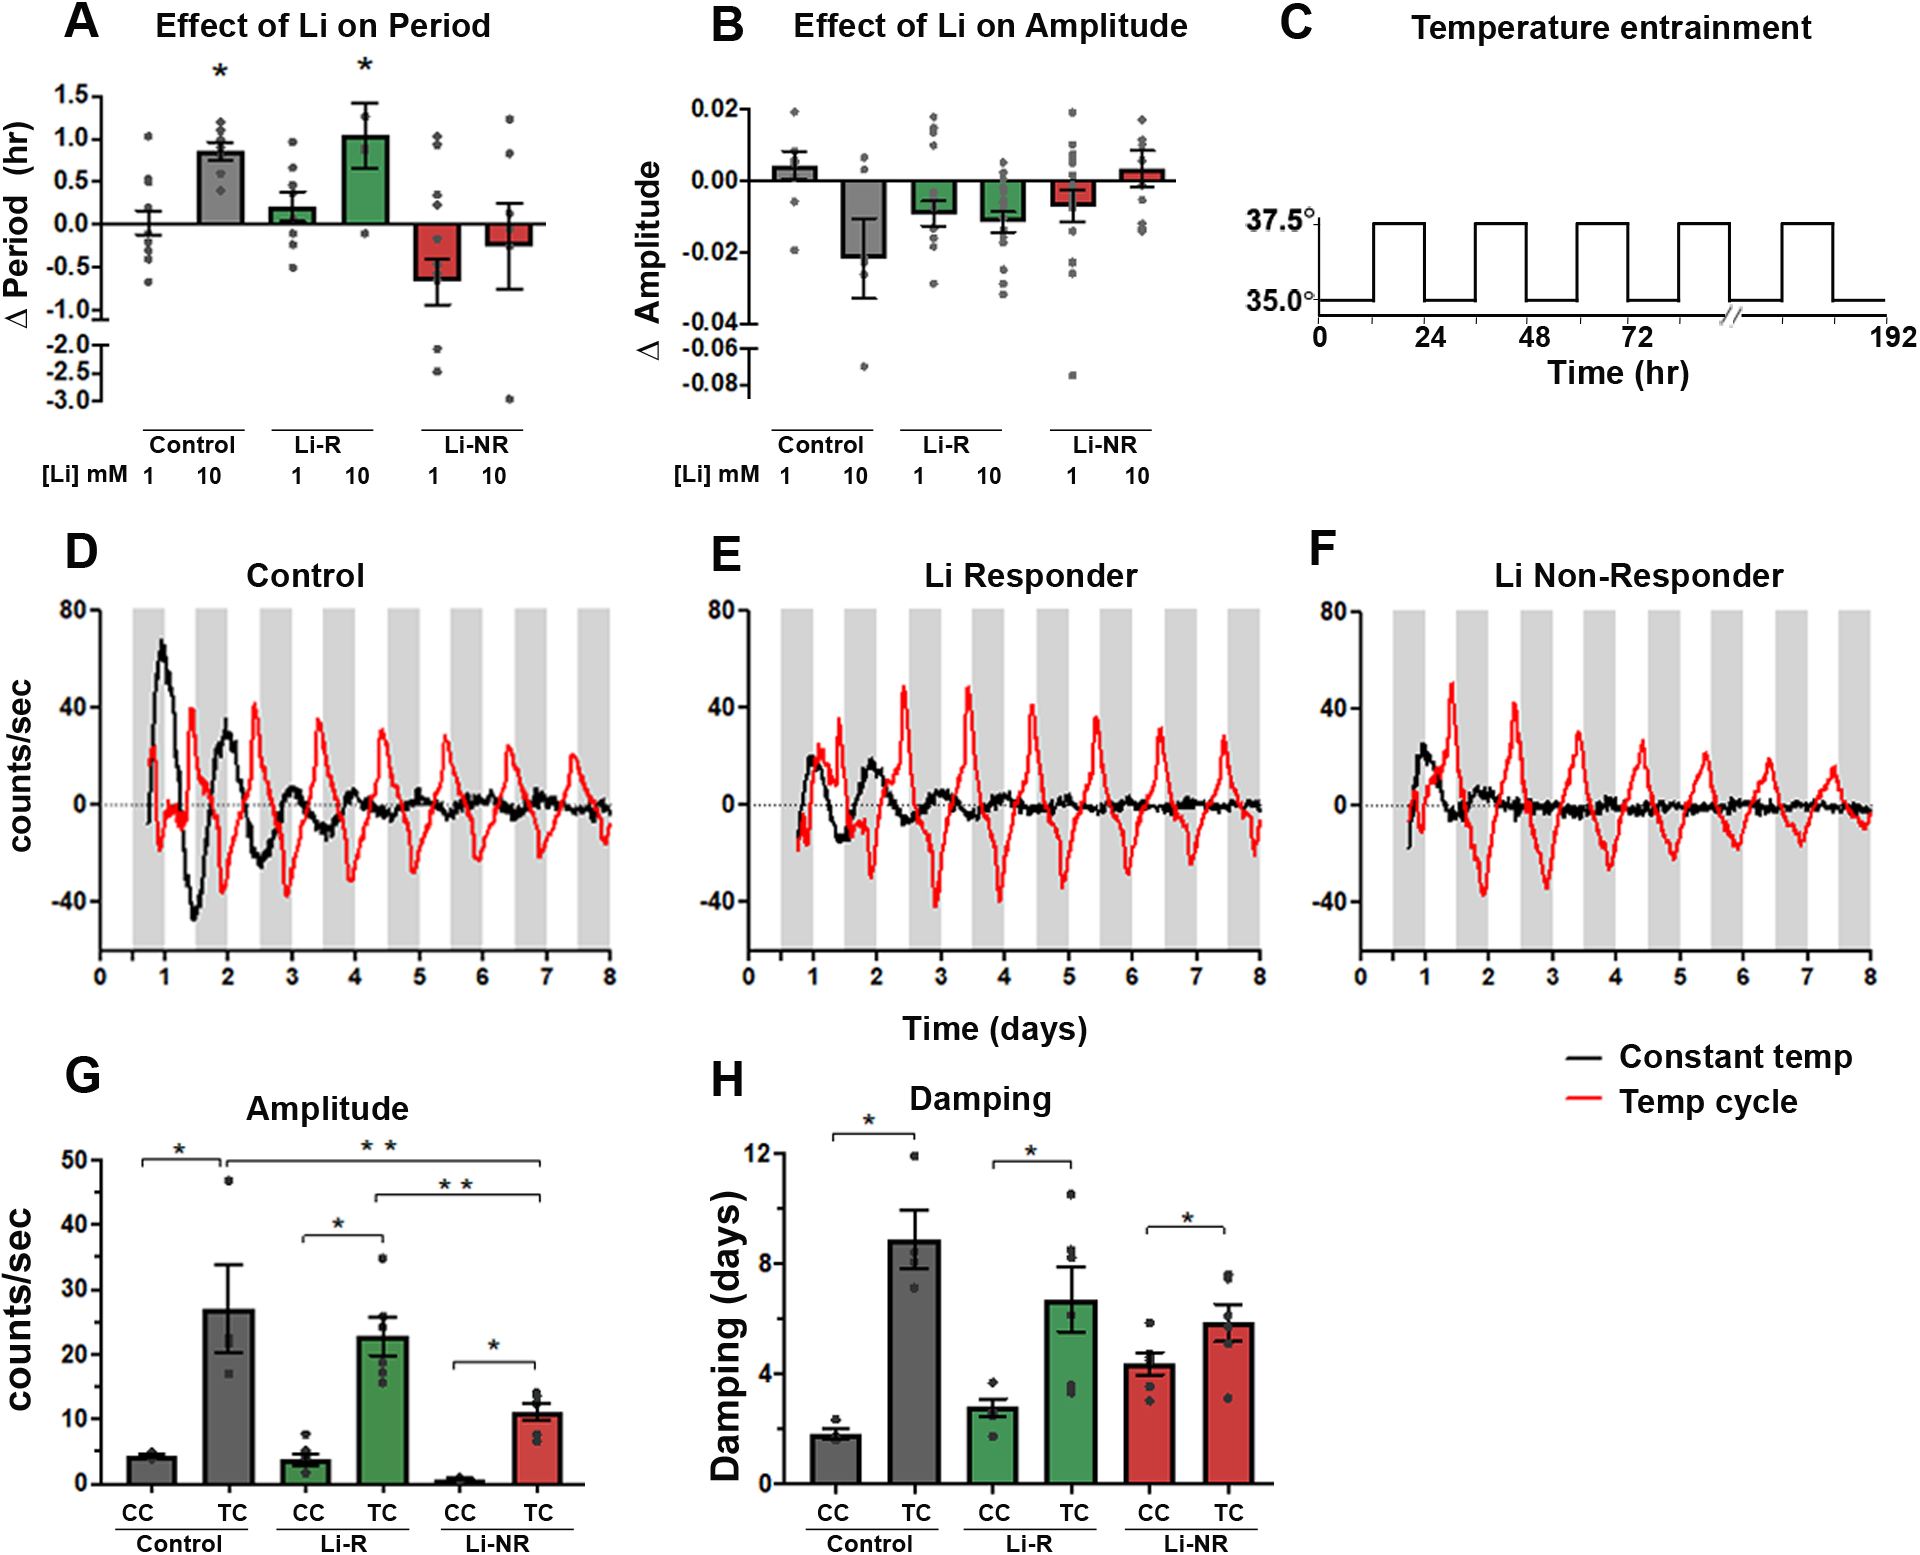
Bipolar disorder (BD) is a neuropsychiatric illness defined by recurrent episodes of mania/hypomania, depression and circadian rhythm abnormalities. Lithium is an effective drug for BD, but 30-40% of patients fail to respond adequately to treatment. Previous work has demonstrated that lithium affects the expression of "clock genes" and that lithium responders (Li-R) can be distinguished from non-responders (Li-NR) by differences in circadian rhythms. However, circadian rhythms have not been evaluated in BD patient neurons from Li-R and Li-NR. We used induced pluripotent stem cells (iPSCs) to culture neuronal precursor cells (NPC) and glutamatergic neurons from BD patients characterized for lithium responsiveness and matched controls. We identified strong circadian rhythms in Per2-luc expression in NPCs and neurons from controls and Li-R, but NPC rhythms in Li-R had a shorter circadian period. Li-NR rhythms were low amplitude and profoundly weakened. In NPCs and neurons, expression of PER2 was higher in both BD groups compared to controls. In neurons, PER2 protein levels were higher in BD than controls, especially in Li-NR samples. In single cells, NPC and neuron rhythms in both BD groups were desynchronized compared to controls. Lithium lengthened period in Li-R and control neurons but failed to alter rhythms in Li-NR. In contrast, temperature entrainment increased amplitude across all groups, and partly restored rhythms in Li-NR neurons. We conclude that neuronal circadian rhythm abnormalities are present in BD and most pronounced in Li-NR. Rhythm deficits in BD may be partly reversible through stimulation of entrainment pathways.


Conflict of interest statement

Conflicts of Interest

None of the authors have relevant conflicts of interest to report.

Figures

Figure 1:
Figure 1:. Generation of human neurons from induced pluripotent stem cells.
Control and BD iPSCs are morphologically similar, characterized by well-defined borders, circular shape and expression of pluripotency markers. (A) Brightfield images showing stages of embryoid bodies based neural differentiation paradigm for iPSCs. (B) Representative image of an iPSC clone co-labeled with pluripotency markers, TRA 1–60 (red), and NANOG (green). (C) NPCs generated from control and BD iPSCs co-express early cortical neural precursor markers NESTIN (green) and SOX-2 (red). (D) Differentiated neurons expressing the neuron-specific marker TUJ1, and only weakly express the glia-specific marker GFAP. (E) Representative images of control and BD neurons showing widespread co-localization of vesicular-glutamate transporter 2 (VGLUT2) in TUJ1 positive cells, indicating enrichment of glutamatergic neurons. Cell nuclei are stained with DAPI (B-E). Antibodies used are listed in Table S2. Scale bars = 50μm. BD: bipolar disorder; DAPI: 4’,6-diamidino-2-phenylindole; GFAP: glial fibrillary acidic protein; iPSCs: induced pluripotent stem cells; NPCs: neural progenitor cell; TUJ1: β-III tubulin; VGLUT2: vesicular-glutamate transporter Numbers in the titles were arbitrarily assigned for identification.
Figure 2:
Figure 2:. Luminometer assays of circadian rhythms in NPC and neurons.
(A-C) Representative traces of Per2-luc rhythms measured by luminometer in plates of NPCs from (A) controls (B) lithium responders (Li-R), and (C) lithium non-responders (Li-NR). Yellow indicates raw counts, red indicates best fit line. (D) Normalized rhythm amplitudes (with units corrected for brightness) were similar in control and Li-R cells, but significantly lower in NPCs from Li-NR (one-way ANOVA p<0.005, * indicates Li-NR lower in post-hoc test). (E) Li-R NPCs had shorter rhythm periods compared to controls and Li-NR (one-way ANOVA, p < 0.004). (F) Rhythm damping was faster in NPCs from Li-NR (one-way ANOVA p<0.005, * indicates Li-NR lower in post-hoc test). (G-I) Representative traces of Per2-luc rhythms in neurons from (G) control, (H) Li-R and (I) Li-NR. Yellow indicates raw counts, red indicates best fit line. (J) Normalized amplitude was significantly lower in neurons from Li-NR vs. control and Li-R (one-way ANOVA, p < 0.005). (K) No significant difference was observed in rhythm period in neurons from control, Li-R and Li-NR donors. (L) Rhythm damping (expressed as damping constant) was faster in neurons from Li-NR (one-way ANOVA, p < 0.05). NPC data reflect the results of n=4 control, 2 Li-R, and 3 Li-NR cell lines, recorded in triplicate, repeated in three separate experimental trials. Neuron data reflect the means of n=3 controls, 2 Li-R, and 3 Li-NR cell lines, recorded in triplicate, repeated across five separate experimental trials. Statistically significant differences p<0.05 are indicated by *. Error bars indicates standard error of the mean (SEM).
Figure 3:
Figure 3:. Single-cell assays of circadian rhythms in NPC and neurons.
(A) Representative time-series images of Per2-luc rhythms in single neurons from a control and BD donor. (B) Pie charts describing the proportion of cells meeting the definition of rhythmic from control, lithium responder (Li-R) and lithium non-responder (Li-NR) donors. In control samples, the proportion of rhythmic cells increased in differentiated neurons vs. neural progenitor cells (NPCs) (control: χ2 = 6.1(1), p<0.05, indicated by * and vertical line). In cells from Li-R and Li-NR, NPCs and neurons were rhythmic in similar proportions suggesting a lack of developmental effect on the circadian clock in these BD samples [Li-R: χ2=0.54 (1), p=0.46, Li-NR: χ2=0.04(1), p=0.84]. In NPCs, the proportion of rhythmic cells was similar across controls, Li-R and Li-NR [χ2=4.02 (2), p=0.13]. In neurons, there were significantly more rhythmic cells in control vs. Li-R and Li-NR samples [χ2 = 6.23 (2), p < 0.05 indicated by **]. (C, D) Single-cell rhythm strength, as measured by relative spectral power in the circadian range. In Li-R, both NPCs and neuron rhythms were weaker vs. controls. In Li-NR, while the total number of rhythmic NPCs was low, those that were detected had normal rhythm strength, whereas rhythmic neurons from Li-NR had significantly weaker rhythms (Analyses by one-way ANOVA revealed for NPCs: F=6.62 p<0.005; neurons: F=6.58 p<0.005. For NPC: N=60–80 cells/line from n=2 control, 2 Li-R, and 1 Li-NR donor, for neurons: N=60–80 cells/line from n=3 control, 2 Li-R, and 1 Li-NR donor). Single-cell analyses indicate significant circadian phase clustering in control NPCs (E) and neurons (F) (Rayleigh test, p = 0.01), but not in NPCs or neurons from Li-R or Li-NR subjects (p>0.05). Phase is shown using polar coordinates, with dots indicating circadian phases of individual cells. Because phase is undefined in non-rhythmic cells, only rhythmic cells are plotted, and the number of plotted cells is therefore smaller for Li-NR NPCs and neurons. Arrows indicate the mean phase vector for each group. Example pairs of rhythm traces from control, Li-R, and Li-NR NPCs (G-I) or neurons (J-L) are shown, illustrating representative phase relationships among single-cells from each group (compare top vs. bottom). Yellow indicates raw counts, red indicates best fit curve. Φ indicates phase value (0–360°). Arrows indicate times of first peaks, to facilitate visual comparisons of phase between traces.
Figure 4:
Figure 4:. Circadian clock gene expression in NPCs and neurons.
Results of RT-PCR 24 h time course experiments performed on mRNA collected at 6 h intervals in NPCs (A-E) and neurons (F-J). Data from controls (black), Li-R (green) and Li-NR (red) are shown. Results were analyzed with two-way ANOVA: * indicates a main effect of diagnosis in post-hoc test (p < 0.05). For each probe, expression was first normalized to GAPDH, and then to mean target expression over 24 h (dotted line). NPC means reflect controls: n=3 donors with 3–5 replicates/sample, Li-R: n=2 donors with 7–10 replicates/sample, Li-NR: n=2 donors with 7–10 replicates/sample. Neuron means reflect controls: n=3 donors with 4–5 replicates/sample, Li-R: n=2 donors with 7–10 replicates/sample, Li-NR: n=3 donors with 7–10 replicates/sample. All experiments were run in triplicate. (I) Clock gene network in BD and control neurons. Nodes indicate gene, edges indicate pairwise correlation. * indicates significant (p<0.05) difference in correlation coefficient (determined by two-way ANOVA with post-hoc test). (L-M) PER2 protein expression in control, Li-R and Li-NR neurons. PER2 expression was significantly higher in both groups of BD neurons (mean immunoreactivity in arbitrary units) ± SEM: control: 15.26 ± 0.34, Li-R 17.24 ± 0.72, Li-NR 27.47± 0.88, One-way ANOVA revealed F=112, p<0.0001, data reflect results from n= 350 control, 220 Li-R, 160 Li-NR neurons (quantified by DAPI staining), from n=3 control, 2 Li-R and 3 Li-NR donors). Post-test revealed * p<0.05 vs control, **p<0.001 vs control and Li-R. Error bars indicate standard error of the mean (SEM).
Figure 5:
Figure 5:. Effects of lithium and temperature entrainment on neuronal rhythms.
Neurons were treated in vitro with lithium (1–10 mM) or vehicle (A) Effect of lithium on period. Lithium had a significant period-lengthening effect in controls and Li-R but not Li-NR (two-way ANOVA revealed effects of diagnosis (p<0.001) and diagnosis × lithium (p<0.02). (B) Effect of lithium on amplitude. Two-way ANOVA revealed a significant BD × lithium interaction effect on amplitude (p<0.01), whereby amplitude changes across lithium exposures differed significantly depending on diagnosis. Results (A-B) reflect the mean within-sample difference in period (lithium-vehicle) matched for experimental run for samples from n=3 controls, 2 Li-R, and 3 Li-NR averaged over three technical replicates in five separate experimental trials. (C) Schematic illustration of 12h/12h temperature entrainment schedule (D-F) Neurons from the same donor were studied in parallel under constant (CC) or temperature cycling (TC) conditions. Representative traces of Per2-luc rhythms are shown from control, Li-R, and Li-NR neurons, under CC (black) or TC (red). For the TC condition, white bars indicate 35°C, gray bars indicate 37.5°C. (G) Effects of TC on rhythm amplitude. Amplitude increased in the TC condition for all samples, but the increase was not as great in Li-NR neurons [2-way ANOVA: temperature (p<0.0001), diagnosis (p<0.02), diagnosis × temperature (p < 0.05)]. (H) Effect of TC on rhythm damping. Rhythms damped more slowly in the TC condition for all neurons, but this effect was smaller in Li-NR neurons [2-way ANOVA: temperature (p<0.0001), diagnosis × temperature (p < 0.05)]. * indicates significant effect of TC, ** indicates significant group difference. Error bars indicate standard error of the mean (SEM).

Similar articles

Cited by

References

    1. Merikangas KR, Jin R, He JP, Kessler RC, Lee S, Sampson NA et al. Prevalence and correlates of bipolar spectrum disorder in the world mental health survey initiative. Arch Gen Psychiatry 2011; 68(3): 241–251. - PMC - PubMed
    1. Gould TD, Quiroz JA, Singh J, Zarate CA, Manji HK. Emerging experimental therapeutics for bipolar disorder: insights from the molecular and cellular actions of current mood stabilizers. Mol Psychiatry 2004; 9(8): 734–755. - PubMed
    1. McGuffin P, Rijsdijk F, Andrew M, Sham P, Katz R, Cardno A. The heritability of bipolar affective disorder and the genetic relationship to unipolar depression. Arch Gen Psychiatry 2003; 60(5): 497–502. - PubMed
    1. McCarthy MJ, Welsh DK. Cellular circadian clocks in mood disorders. J Biol Rhythms 2012; 27(5): 339–352. - PubMed
    1. Gonzalez R, Gonzalez SD, McCarthy MJ. Using Chronobiological Phenotypes to Address Heterogeneity in Bipolar Disorder. Mol Neuropsychiatry 2020; 5(Suppl 1): 72–84. - PMC - PubMed

Publication types