Comparative Study
. 2021 Mar 5;4(1):281.
doi: 10.1038/s42003-021-01820-z.

The gut mycobiome of healthy mice is shaped by the environment and correlates with metabolic outcomes in response to diet

Affiliations
Comparative Study

The gut mycobiome of healthy mice is shaped by the environment and correlates with metabolic outcomes in response to diet

Tahliyah S Mims et al. Commun Biol. .

Abstract

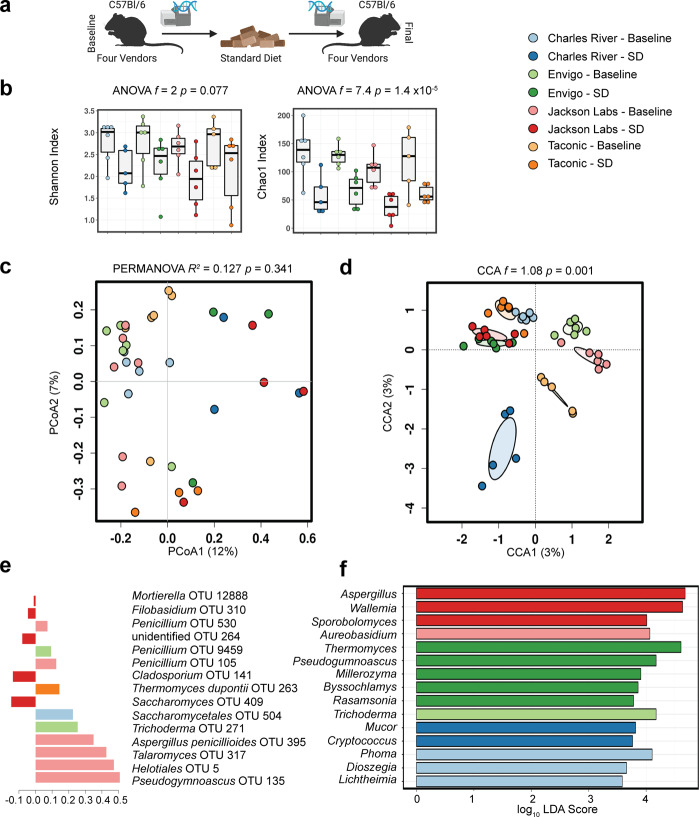
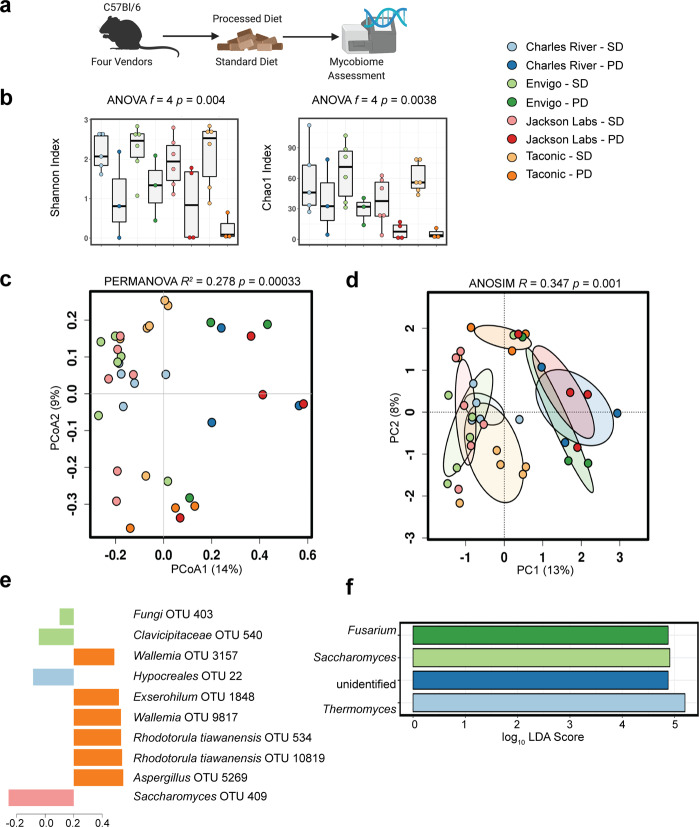
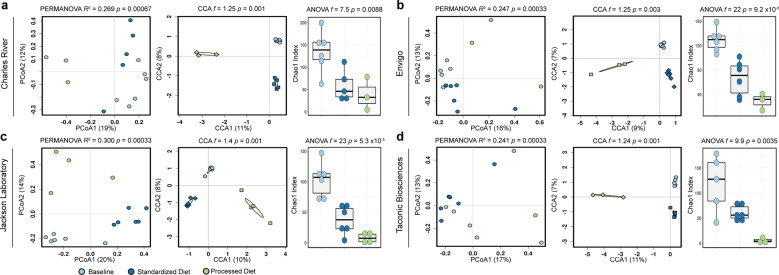
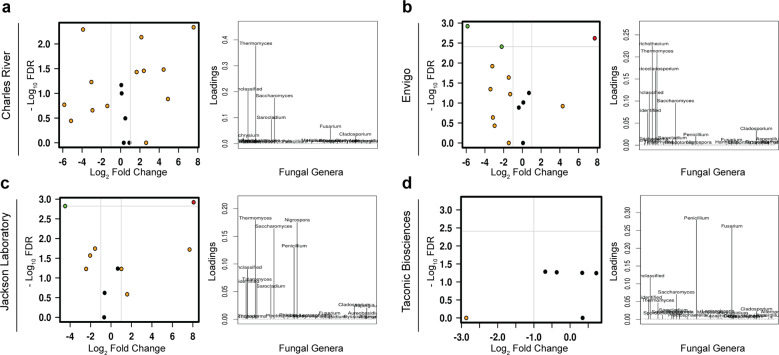
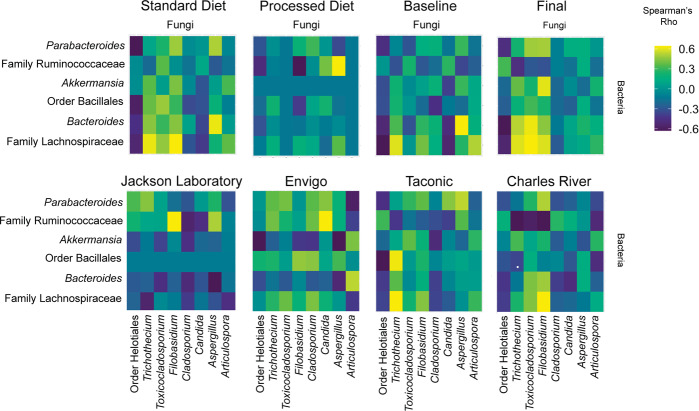
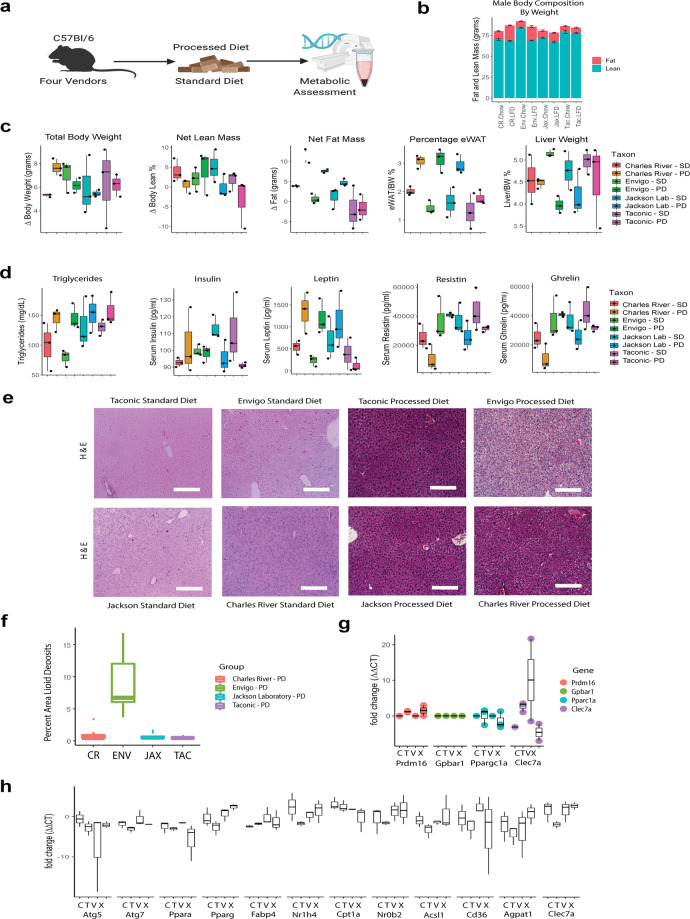
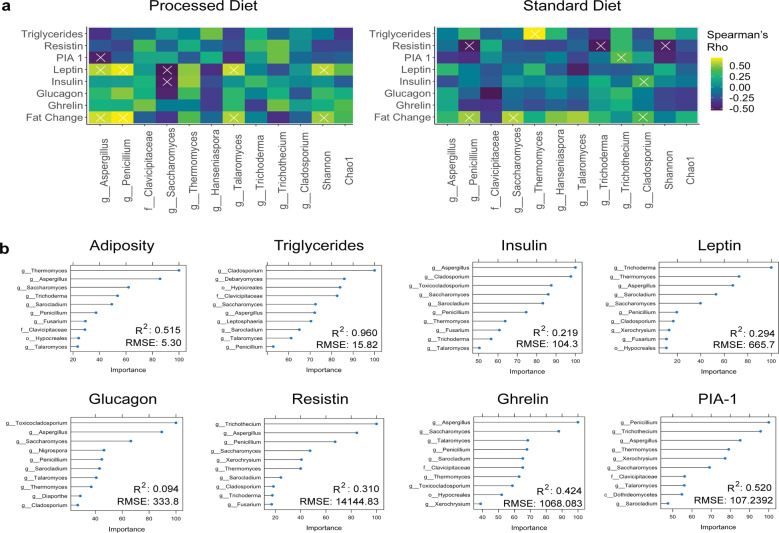
As an active interface between the host and their diet, the gut microbiota influences host metabolic adaptation; however, the contributions of fungi have been overlooked. Here, we investigate whether variations in gut mycobiome abundance and composition correlate with key features of host metabolism. We obtained animals from four commercial sources in parallel to test if differing starting mycobiomes can shape host adaptation in response to processed diets. We show that the gut mycobiome of healthy mice is shaped by the environment, including diet, and significantly correlates with metabolic outcomes. We demonstrate that exposure to processed diet leads to persistent differences in fungal communities that significantly associate with differential deposition of body mass in male mice compared to mice fed standardized diet. Fat deposition in the liver, transcriptional adaptation of metabolically active tissues and serum metabolic biomarker levels are linked with alterations in fungal community diversity and composition. Specifically, variation in fungi from the genera Thermomyces and Saccharomyces most strongly associate with metabolic disturbance and weight gain. These data suggest that host-microbe metabolic interactions may be influenced by variability in the mycobiome. This work highlights the potential significance of the gut mycobiome in health and has implications for human and experimental metabolic studies.


Conflict of interest statement

The authors declare no competing interests.

Figures

Fig. 1
Fig. 1. Gut fungal communities cluster by vendor, age, and dietary exposure.
a Experimental schematic. b Compared to healthy mice exposed to a standardized chow diet for 8 weeks, baseline community diversity is higher in mice upon delivery from vendors. While gut fungal communities remained distinctly clustered by vendor, exposure to a standardized chow diet for 8 weeks exerted a convergent effect on community composition (c, d Bray–Curtis dissimilarity distance). Supervised partial least squares discriminant analysis (e) and linear discriminant analysis of effect size (f) confirm key operational taxonomic units and genera driving differences in community composition. Hypothesis testing was performed using ANOVA (b), PERMANOVA (c), and CCA (d). CCA canonical correspondence analysis, OTUs operational taxonomic units, SD standard diet, PERMANOVA permutational multivariate ANOVA, PCoA principal coordinates analysis. Schematic created using BioRender.com.
Fig. 2
Fig. 2. Exposure to processed diet produces a more pronounced alteration of gut fungal communities than does exposure to standardized chow.
a Experimental schematic. b Compared to healthy mice exposed to a standardized chow diet for 8 weeks, mice exposed to a processed diet show reduced community diversity. While gut fungal communities remained distinctly clustered by vendor, exposure to processed diet for 8 weeks exerted a convergent effect on community composition that exceeded the similar effect of standardized chow (c, d Bray–Curtis dissimilarity distance). Supervised partial least squares discriminant analysis (e) and linear discriminant analysis of effect size (f) confirm key operational taxonomic units and genera driving differences in community composition. Hypothesis testing was performed using ANOVA (b), PERMANOVA (c), and ANOSIM (d). ANOSIM analysis of similarities, CCA canonical correspondence analysis, OTUs operational taxonomic units, LDA linear discriminant analysis, PERMANOVA permutational multivariate ANOVA, PD processed diet, PCA principal components analysis, PCoA principal coordinates analysis, SD standard diet. Schematic created using BioRender.com.
Fig. 3
Fig. 3. Baseline fungal composition influences final community composition.
Differences in fungal community composition and diversity present on arrival from the four laboratory mouse vendors lead to persistent differences in the composition and diversity of fungal communities (ad). Hypothesis testing for community composition was performed using permutational multivariate ANOVA and canonical correspondence analysis of Hellinger transformed Bray–Curtis dissimilarity distances and community diversity by ANOVA of the Chao1 index. CCA canonical correspondence analysis, OTUs operational taxonomic units, PERMANOVA permutational multivariate ANOVA, PCoA principal coordinates analysis.
Fig. 4
Fig. 4. Differences among animals sourced from different vendors persist after exposure to processed diet.
Volcano plots of mixed-effect regression identify differences between animals exposed to a processed diet that are highlighted by loading plots of discriminant analysis of principal components (ad). FDR false discovery rate.
Fig. 5
Fig. 5. Interkingdom co-occurrence differs by vendor, diet, and time.
The 14 most abundant taxa are displayed (comprising > 99.2% of variability). The color indicates the strength of Bonferroni corrected Spearman’s rho correlation coefficients. The x axis comprises fungal taxa with bacteria on the y axis. Complete co-occurrence networks are shown in Supplementary Fig. 11.
Fig. 6
Fig. 6. The metabolic phenotype of male mice is sensitive to gut fungal community composition.
a Experimental schematic. b Male mouse body composition by EchoMRI. c Male mouse body composition by tissue collection. d Male serum metabolically active biomarkers. e Hematoxylin and eosin-stained liver tissue show increased deposition after a processed diet, particularly in mice from Envigo. f Quantification of lipid deposition in males exposed to processed diet. g Gene expression in eWAT under processed diet. h Gene expression in liver. eWAT epididymal white adipose tissue, PD processed diet, SD standard diet. Schematic created using BioRender.com.
Fig. 7
Fig. 7. Fungal genera strongly associate with metabolic tone.
a Biconjugate A-Orthogonal Residual method. X indicates p < 0.05 after false discovery rate correction. b Random forest regression models showing the relative importance of a particular taxon to the model. PIA-1 plasminogen activator inhibitor-1, R2 correlation coefficient, RMSE root mean square error.

Comment in

References

    1. Kau AL, Ahern PP, Griffin NW, Goodman AL, Gordon JI. Human nutrition, the gut microbiome and the immune system. Nature. 2011;474:327–336. doi: 10.1038/nature10213. - DOI - PMC - PubMed
    1. Maruvada P, Leone V, Kaplan LM, Chang EB. The human microbiome and obesity: moving beyond associations. Cell Host Microbe. 2017;22:589–599. doi: 10.1016/j.chom.2017.10.005. - DOI - PubMed
    1. Sonnenburg JL, Bäckhed F. Diet-microbiota interactions as moderators of human metabolism. Nature. 2016;535:56–64. doi: 10.1038/nature18846. - DOI - PMC - PubMed
    1. Kovatcheva-Datchary P, et al. Dietary fiber-induced improvement in glucose metabolism is associated with increased abundance of prevotella. Cell Metab. 2015;22:971–982. doi: 10.1016/j.cmet.2015.10.001. - DOI - PubMed
    1. Ley RE, et al. Obesity alters gut microbial ecology. Proc. Natl Acad. Sci. USA. 2005;102:11070–11075. doi: 10.1073/pnas.0504978102. - DOI - PMC - PubMed

Publication types