. 2021 Apr;20(4):e13322.
doi: 10.1111/acel.13322. Epub 2021 Mar 6.

The ketogenic diet preserves skeletal muscle with aging in mice

Affiliations

The ketogenic diet preserves skeletal muscle with aging in mice

Marita A Wallace et al. Aging Cell. 2021 Apr.

Abstract

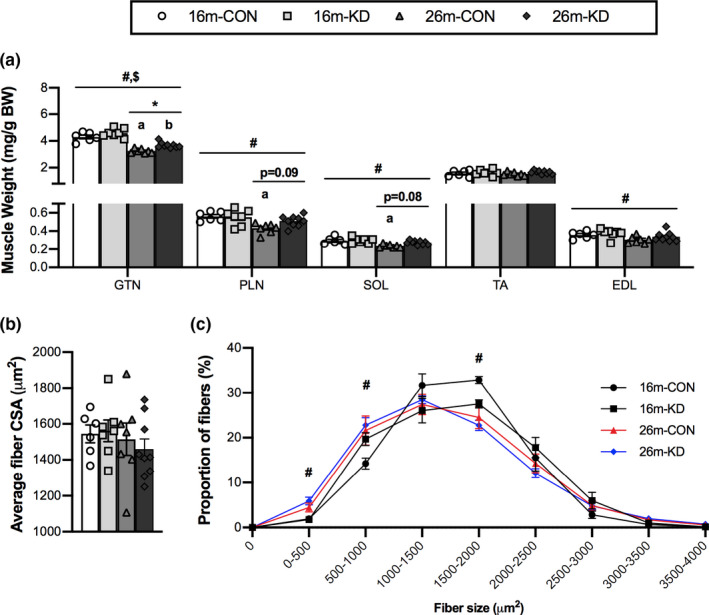
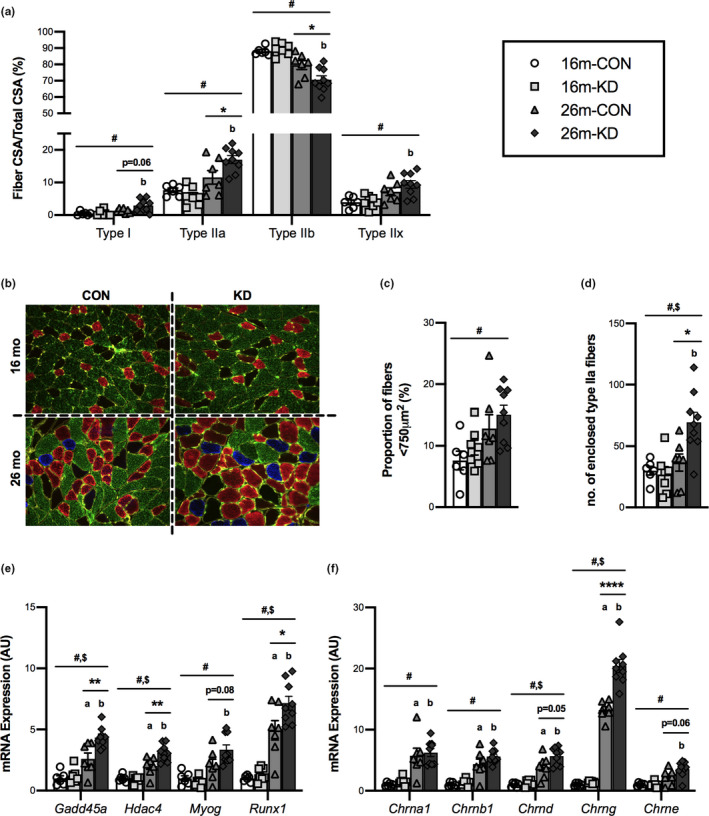
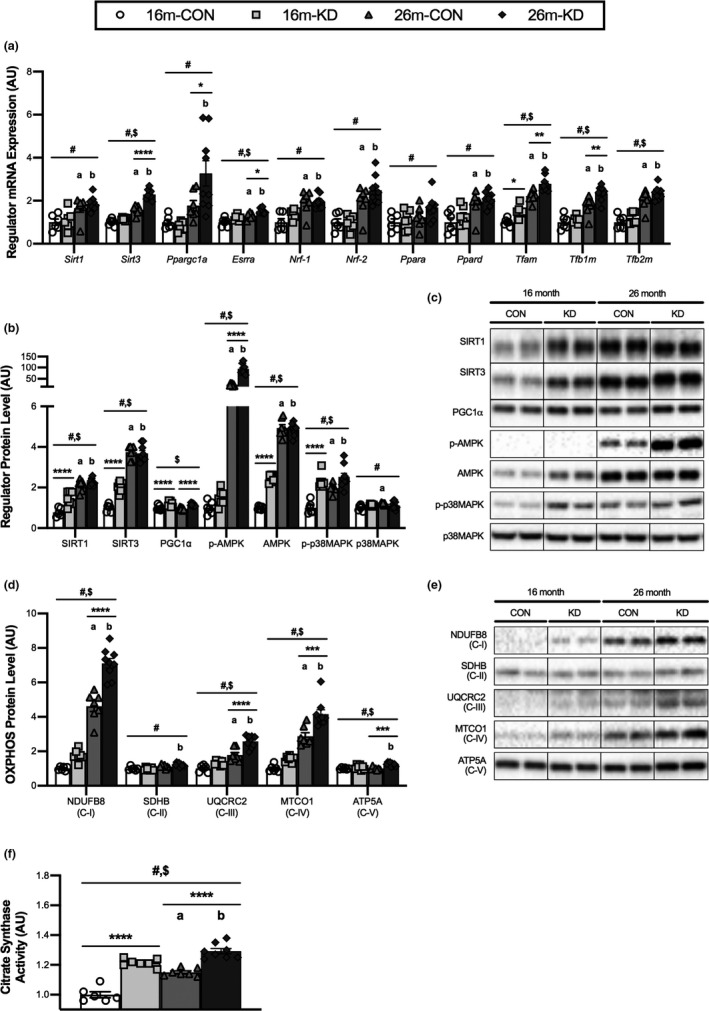
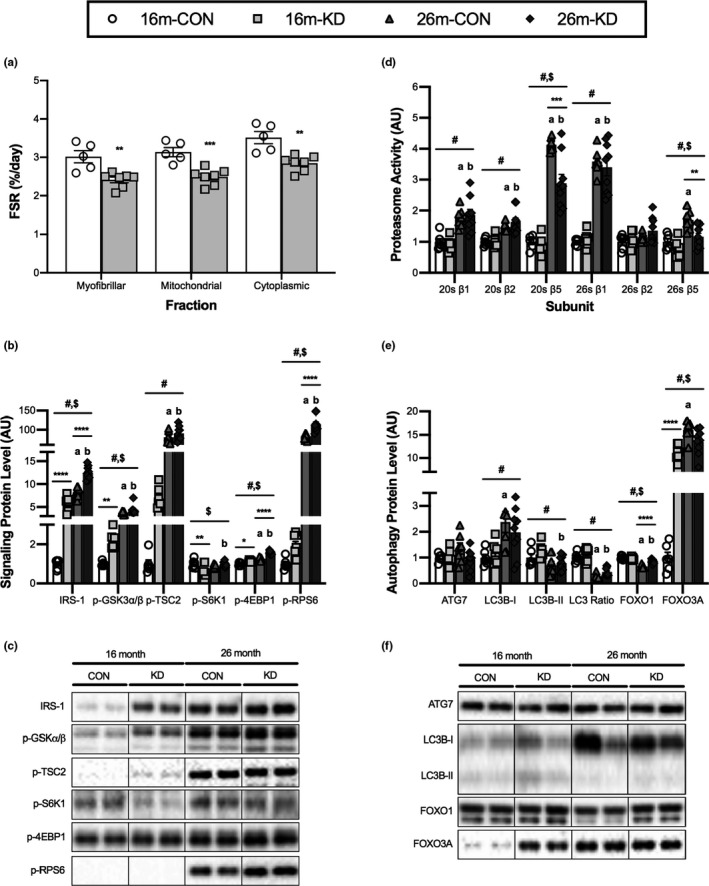
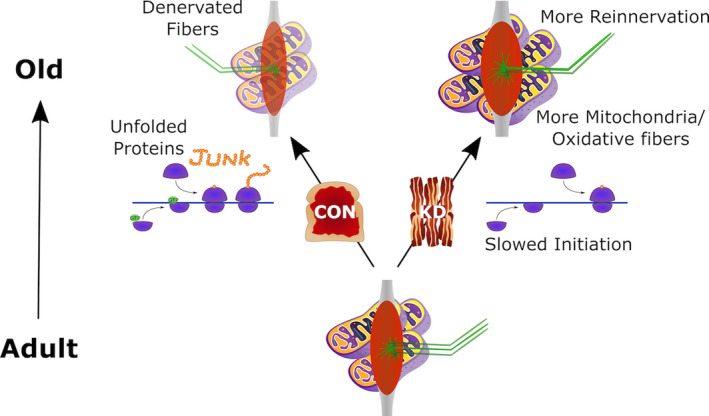
The causes of the decline in skeletal muscle mass and function with age, known as sarcopenia, are poorly understood. Nutrition (calorie restriction) interventions impact many cellular processes and increase lifespan and preserve muscle mass and function with age. As we previously observed an increase in life span and muscle function in aging mice on a ketogenic diet (KD), we aimed to investigate the effect of a KD on the maintenance of skeletal muscle mass with age and the potential molecular mechanisms of this action. Twelve-month-old mice were assigned to an isocaloric control or KD until 16 or 26 months of age, at which time skeletal muscle was collected for evaluating mass, morphology, and biochemical properties. Skeletal muscle mass was significantly greater at 26 months in the gastrocnemius of mice on the KD. This result in KD mice was associated with a shift in fiber type from type IIb to IIa fibers and a range of molecular parameters including increased markers of NMJ remodeling, mitochondrial biogenesis, oxidative metabolism, and antioxidant capacity, while decreasing endoplasmic reticulum (ER) stress, protein synthesis, and proteasome activity. Overall, this study shows the effectiveness of a long-term KD in mitigating sarcopenia. The diet preferentially preserved oxidative muscle fibers and improved mitochondrial and antioxidant capacity. These adaptations may result in a healthier cellular environment, decreasing oxidative and ER stress resulting in less protein turnover. These shifts allow mice to better maintain muscle mass and function with age.

Keywords: aging; ketogenic diet; mice; sarcopenia; skeletal muscle.


Conflict of interest statement

Authors declare no competing interests.

Figures

FIGURE 1
FIGURE 1
Effect of diet and aging on skeletal muscle weight and fiber size. (a) Gastrocnemius (GTN), plantaris (PLN), soleus (SOL), tibialis anterior (TA), and extensor digitorum longus (EDL) muscle weight relative to body weight (BW) of 16‐ and 26‐month‐old mice on a control (CON) or ketogenic diet (KD). (b) Average fiber cross‐sectional area (CSA) and (c) fiber size distribution from the GTN of 16‐ and 26‐month‐old mice on CON or KD. Values are expressed as means ± SEM. n = 6 (16‐month CON), n = 7 (16‐month KD and 26‐month CON), and n = 9 (26‐month KD). (#) main effect of age. ($) main effect of diet. (*p < 0.05) comparing CON and KD at 16 and 26 months. (a) p < 0.05 comparing CON at 16 and 26 months. (b) p < 0.05 comparing KD at 16 and 26 months
FIGURE 2
FIGURE 2
Effect of diet and aging on skeletal muscle phenotype and neuromuscular junction remodeling. (a) Fiber cross‐sectional area (CSA) relative to total fiber CSA for Type I, IIa, IIb, and IIx fibers from the GTN of 16‐ and 26‐month‐old mice on a control (CON) or ketogenic diet (KD). (b) Representative cross‐sectional images (10x objective) from the deep portion of the gastrocnemius of 16‐ and 26‐month‐old mice on the CON or KD. Staining was for Type I (blue), IIa (red), IIb (green), IIx (no stain, black), and laminin (yellow). (c) Proportion of small fibers (<750 μm), (d) total number of enclosed type IIa fibers and mRNA expression of (e) markers of skeletal muscle denervation and (f) acetylcholine receptor subunits from the GTN of 16‐ and 26‐month‐old mice on the CON or KD. Values are expressed as means ± SEM. n = 6 (16‐month CON), n = 7 (16‐month KD and 26‐month CON), and n = 9 (26‐month KD). (#) main effect of age. ($) main effect of diet. (*p < 0.05; **p < 0.01; ****p < 0.0001) comparing CON and KD at 16 and 26 months. (a) p < 0.05 comparing CON at 16 and 26 months. (b) p < 0.05 comparing KD at 16 and 26 months
FIGURE 3
FIGURE 3
Effect of diet and aging on mitochondrial biogenesis and oxidative metabolism. (a) mRNA expression of transcriptional regulators of mitochondrial biogenesis, protein levels, and representative western blot images of (b,c) regulators of mitochondrial biogenesis, (d,e) oxidative phosphorylation (OXPHOS) proteins from each complex (C‐I to C‐V) and (f) citrate synthase enzymatic activity from the GTN of 16‐ and 26‐month‐old mice on a control (CON) or ketogenic diet (KD). For complete western blot images refer to Appendix S1 (Figure S1). Values are expressed as means ± SEM. n = 6 (16‐month CON), n = 7 (16‐month KD and 26‐month CON), and n = 9 (26‐month KD). (#) main effect of age. ($) main effect of diet. (*p < 0.05; **p < 0.01; ***p < 0.001; ****p < 0.0001) comparing CON and KD at 16 and 26 months. (a) p < 0.05 comparing CON at 16 and 26 months. (b) p < 0.05 comparing KD at 16 and 26 months
FIGURE 4
FIGURE 4
Effect of diet and aging on cellular stress responses. Protein levels and representative western blot images of (a,b) endoplasmic reticulum (ER) stress and (c,d) oxidative stress response proteins from the GTN of 16‐ and 26‐month‐old mice on a control (CON) or ketogenic diet (KD). For complete western blot images, refer to Appendix S1 (Figure S2). (e) Ratio of cytoplasmic to nuclear (C:N) proteins for conical NFκB signaling family members and (f) their representative western blot images from the quadricep of 16‐ and 26‐month‐old mice on a CON or KD. For complete western blot images refer to Appendix S1 (Figure S3). (g) Il1b mRNA expression in the GTN of 16‐ and 26‐month‐old mice on the CON or KD. Values are expressed as means ± SEM. n = 6 (16‐month CON), n = 7 (16‐month KD and 26‐month CON), and n = 9 (26‐month KD). (#) main effect of age. ($) main effect of diet. (*p < 0.05; **p < 0.01; ***p < 0.001; ****p < 0.0001) comparing CON and KD at 16 and 26 months. (a) p < 0.05 comparing CON at 16 and 26 months. (b) p < 0.05 comparing KD at 16 and 26 months
FIGURE 5
FIGURE 5
Effect of diet and aging on skeletal muscle proteostasis. (a) Fractional synthesis rate (FSR) of the myofibrillar, cytoplasmic, and mitochondrial fractions from the GTN of 16‐month‐old mice on a control (CON) or ketogenic diet (KD). Values are expressed as means ± SEM. (*p < 0.05; **p < 0.01; ***p < 0.001; ****p < 0.0001) comparing CON and KD (b, c) Protein levels and representative western blot images of proteins associated with protein synthesis from the GTN of 16‐ and 26‐month‐old mice on a CON or KD. (d) ATP‐independent (20S) and ATP‐dependent (26S) proteasomal subunit (β1, β2, and β5) activities from the quadricep of 16‐ and 26‐month‐old mice on a CON or KD. (e, f) Protein levels and representative western blot images of proteins associated with autophagy from the GTN of 16‐ and 26‐month‐old mice on a CON or KD. For complete western blot images, refer to Appendix S1 (Figure S4). Values are expressed as means ± SEM. n = 6 (16‐month CON), n = 7 (16‐month KD and 26‐month CON), and n = 9 (26‐month KD). (#) main effect of age. ($) main effect of diet. (*p < 0.05; **p < 0.01; ***p < 0.001; ****p < 0.0001) comparing CON and KD at 16 and 26 months. (a) p < 0.05 comparing CON at 16 and 26 months. (b) p < 0.05 comparing KD at 16 and 26 months
FIGURE 6
FIGURE 6
Potential mechanism of the effect of the ketogenic diet (KD) on muscle preservation with aging. As muscle progresses from adult to old, individuals on a standard control (18% PRO, 65% CHO, and 17% FAT) diet show less reinnervation and more unfolded proteins. By contrast, individuals on a long‐term KD (10% PRO, <1% CHO, and 89% FAT) showed more mitochondria, greater reinnervation, more oxidative muscle fibers, and decreased translation initiation

Similar articles

Cited by

References

    1. Baehr, L. M. , Tunzi, M. , & Bodine, S. C. (2014). Muscle hypertrophy is associated with increases in proteasome activity that is independent of MuRF1 and MAFbx expression. Frontiers in Physiology, 5, 69. 10.3389/fphys.2014.00069 - DOI - PMC - PubMed
    1. Baehr, L. M. , West, D. W. , Marcotte, G. , Marshall, A. G. , De Sousa, L. G. , Baar, K. , & Bodine, S. C. (2016). Age‐related deficits in skeletal muscle recovery following disuse are associated with neuromuscular junction instability and ER stress, not impaired protein synthesis. Aging (Albany NY), 8(1), 127–146. 10.18632/aging.100879 - DOI - PMC - PubMed
    1. Bennett, S. L. H. , Smith, A. H. , Ramirez, J. L. , & Thomson, D. M. (2019). Effects of ketogenic diet on p70S6k phosphorylation in young adult and old soleus muscle. The FASEB Journal, 33(1_supplement), lb558‐lb558. 10.1096/fasebj.2019.33.1_supplement.lb558 - DOI
    1. Bogorad, A. M. , Lin, K. Y. , & Marintchev, A. (2018). eIF2B mechanisms of action and regulation: A thermodynamic view. Biochemistry, 57(9), 1426–1435. 10.1021/acs.biochem.7b00957 - DOI - PMC - PubMed
    1. Breen, L. , & Phillips, S. M. (2011). Skeletal muscle protein metabolism in the elderly: Interventions to counteract the ‘anabolic resistance’ of ageing. Nutrition & Metabolism, 8, 68. 10.1186/1743-7075-8-68 - DOI - PMC - PubMed

Publication types

MeSH terms

Substances