

Effect of spontaneous movement on respiration in preterm infants
- PMID: 33675125
- PMCID: PMC8087648
- DOI: 10.1113/EP089143
Effect of spontaneous movement on respiration in preterm infants
Abstract
New findings: What is the central question of this study? The respiratory centres in the brainstem that control respiration receive inputs from various sources, including proprioceptors in muscles and joints and suprapontine centres, which all affect limb movements. What is the effect of spontaneous movement on respiration in preterm infants? What is the main finding and its importance? Apnoeic events tend to be preceded by movements. These activity bursts can cause respiratory instability that leads to an apnoeic event. These findings show promise that infant movements might serve as potential predictors of life-threatening apnoeic episodes, but more research is required.
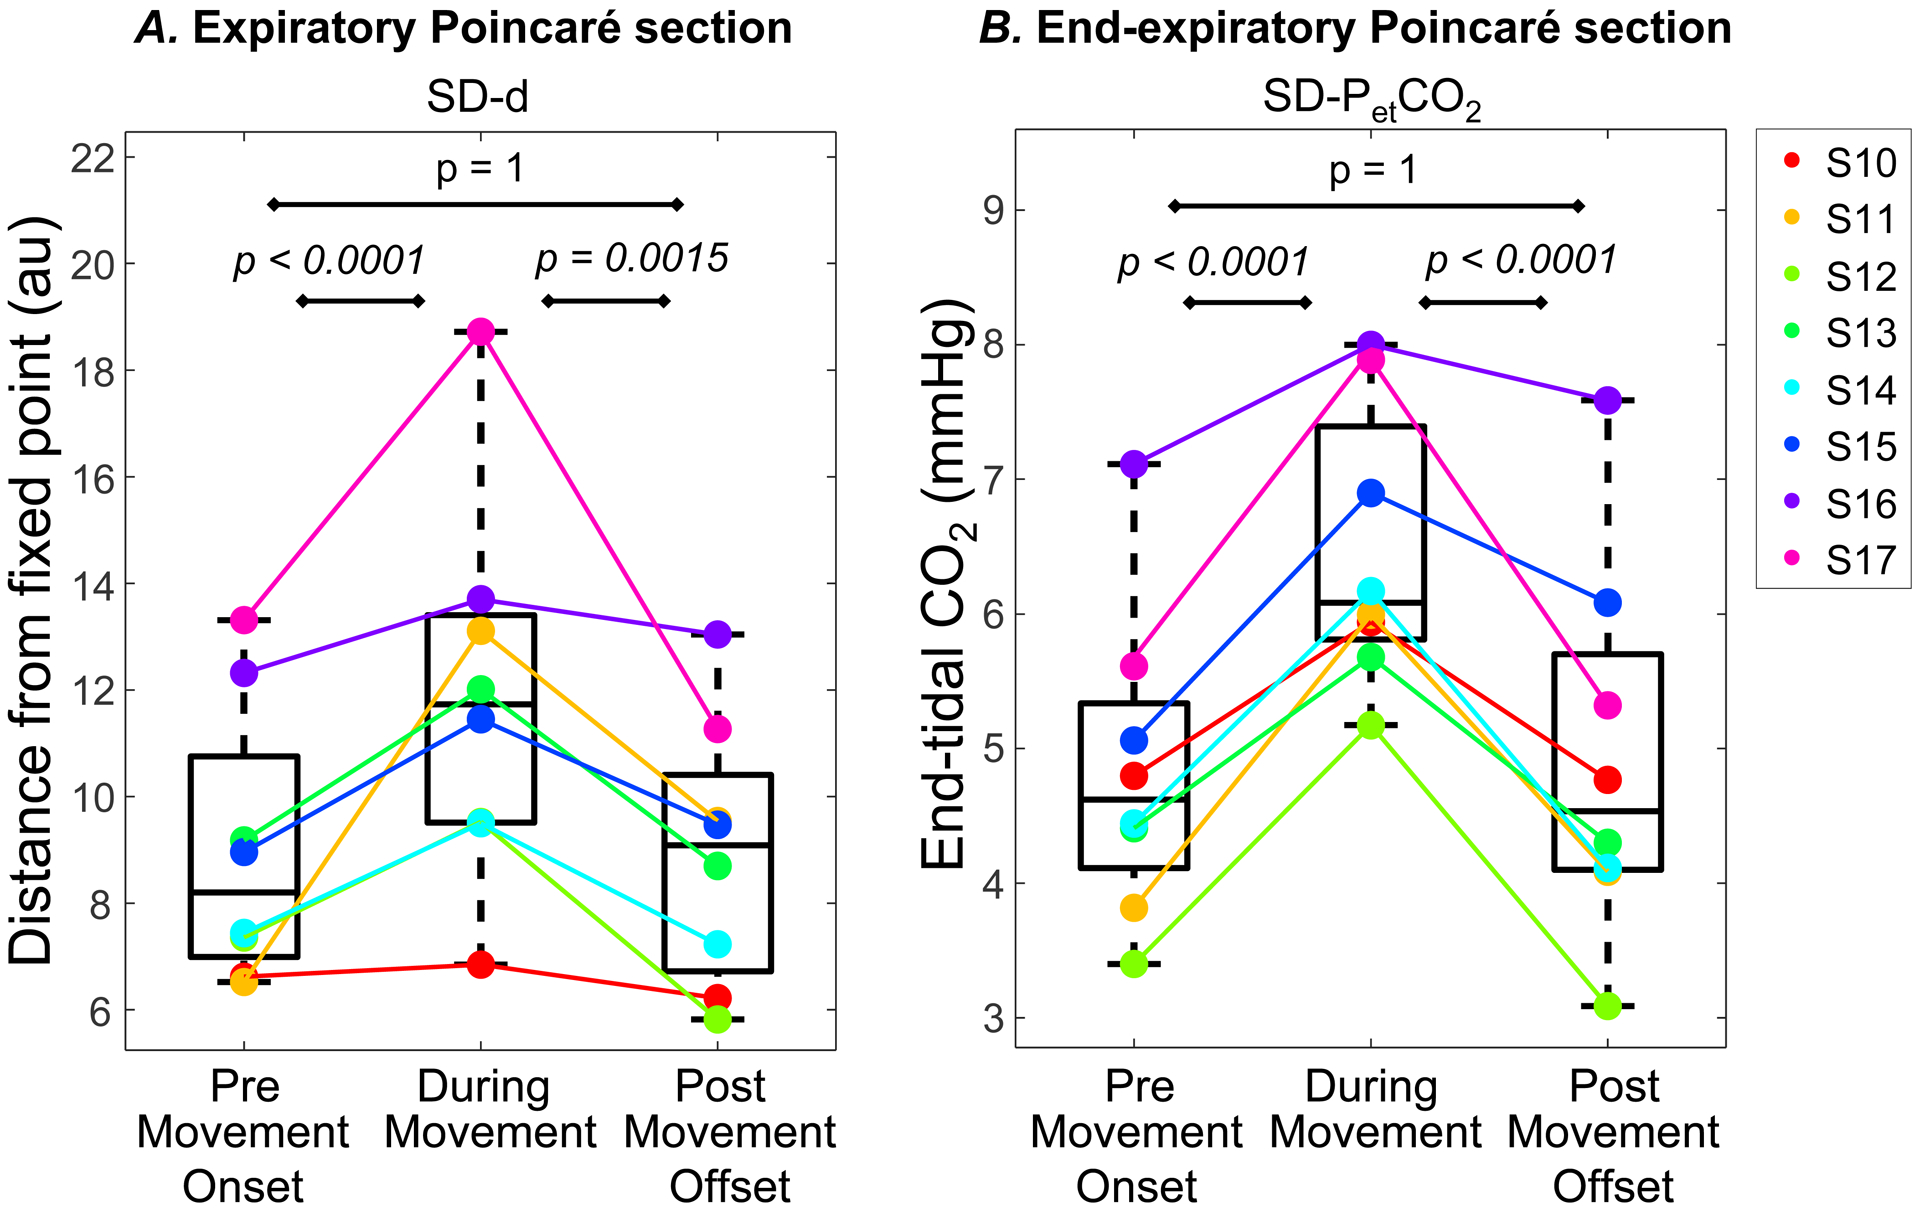
Abstract: A common condition in preterm infants (<37 weeks' gestational age) is apnoea resulting from immaturity and instability of the respiratory system. As apnoeas are implicated in several acute and long-term complications, prediction of apnoeas may preempt their onset and subsequent complications. This study tests the hypothesis that infant movements are a predictive marker for apnoeic episodes and examines the relation between movement and respiration. Movement was detected using a wavelet algorithm applied to the photoplethysmographic signal. Respiratory activity was measured in nine infants using respiratory inductance plethysmography; in an additional eight infants, respiration and partial pressure of airway carbon dioxide ( ) were measured by a nasal cannula with side-stream capnometry. In the first cohort, the distribution of movements before and after the onset of 370 apnoeic events was compared. Results showed that apnoeic events were associated with longer movement duration occurring before apnoea onsets compared to after. In the second cohort, respiration was analysed in relation to movement, comparing standard deviation of inter-breath intervals (IBI) before and after apnoeas. Poincaré maps of the respiratory activity quantified variability of airway in phase space. Movement significantly increased the variability of IBI and . Moreover, destabilization of respiration was dependent on the duration of movement. These findings support that bodily movements of the infants precede respiratory instability. Further research is warranted to explore the predictive value of movement for life-threatening events, useful for clinical management and risk stratification.
Keywords: Poincaré map; apnoea; breathing; movement; preterm infants; respiration; respiratory stability.
© 2021 The Authors. Experimental Physiology © 2021 The Physiological Society.
Conflict of interest statement
Competing interests
The authors declare that they have no competing interests.
Figures


Similar articles
-
Comparison of the longitudinal effects of persistent periodic breathing and apnoea on cerebral oxygenation in term- and preterm-born infants.J Physiol. 2018 Dec;596(23):6021-6031. doi: 10.1113/JP275686. Epub 2018 Apr 11. J Physiol. 2018. PMID: 29528500 Free PMC article.
-
New method to measure interbreath intervals in infants for the assessment of apnoea and respiration.BMJ Open Respir Res. 2021 Dec;8(1):e001042. doi: 10.1136/bmjresp-2021-001042. BMJ Open Respir Res. 2021. PMID: 34893521 Free PMC article.
-
Sources of methodological variability in phase angles from respiratory inductance plethysmography in preterm infants.Ann Am Thorac Soc. 2014 Jun;11(5):753-60. doi: 10.1513/AnnalsATS.201310-363OC. Ann Am Thorac Soc. 2014. PMID: 24716708 Free PMC article.
-
Sensory stimulation for apnoea mitigation in preterm infants.Pediatr Res. 2022 Sep;92(3):637-646. doi: 10.1038/s41390-021-01828-5. Epub 2021 Nov 24. Pediatr Res. 2022. PMID: 34819656 Review.
-
Epidemiology and pathophysiology of apnoea of prematurity.Biol Neonate. 1994;65(3-4):211-9. doi: 10.1159/000244055. Biol Neonate. 1994. PMID: 8038285 Review.
Cited by
-
Continuous non-contact monitoring of neonatal activity.BMC Pediatr. 2025 Feb 25;25(1):134. doi: 10.1186/s12887-024-05238-4. BMC Pediatr. 2025. PMID: 39994574 Free PMC article.
-
Predicting apneic events in preterm infants using cardio-respiratory and movement features.Comput Methods Programs Biomed. 2021 Sep;209:106321. doi: 10.1016/j.cmpb.2021.106321. Epub 2021 Jul 30. Comput Methods Programs Biomed. 2021. PMID: 34380078 Free PMC article.
References
-
- Bates D, Mächler M, Bolker B, & Walker S (2015). Fitting Linear Mixed-Effects Models Using lme4. Journal of Statistical Software, 67(1), 1–48. 10.18637/jss.v067.i01 - DOI
Publication types
MeSH terms
Grants and funding
LinkOut - more resources
Full Text Sources
Other Literature Sources
Medical
Research Materials