. 2021 Apr;25(7):3381-3390.
doi: 10.1111/jcmm.16415. Epub 2021 Mar 6.

Implication of TrkC-miR2 in neurotrophin signalling pathway regulation through NGFR transcript targeting

Affiliations

Implication of TrkC-miR2 in neurotrophin signalling pathway regulation through NGFR transcript targeting

Sadat Dokaneheifard et al. J Cell Mol Med. 2021 Apr.

Abstract

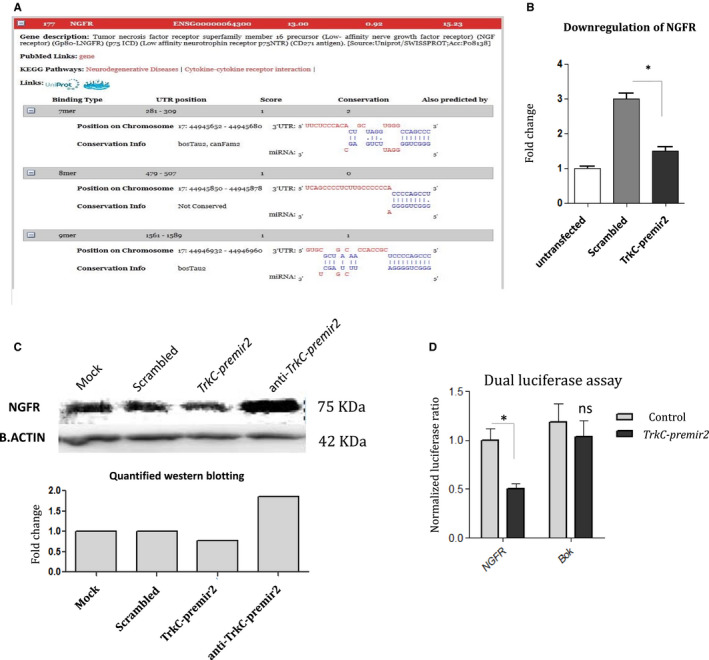
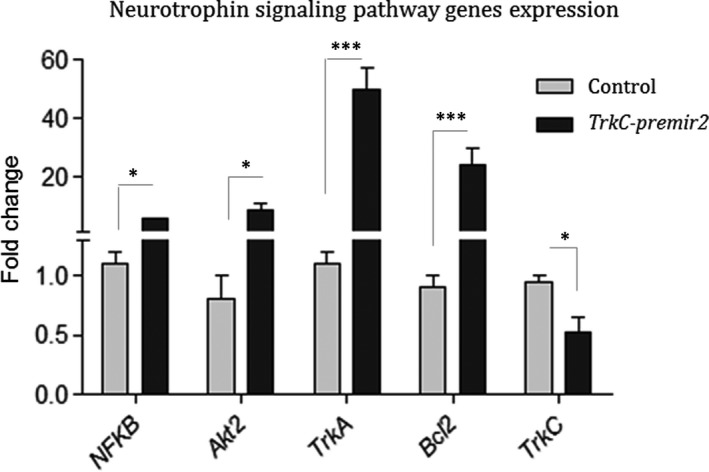
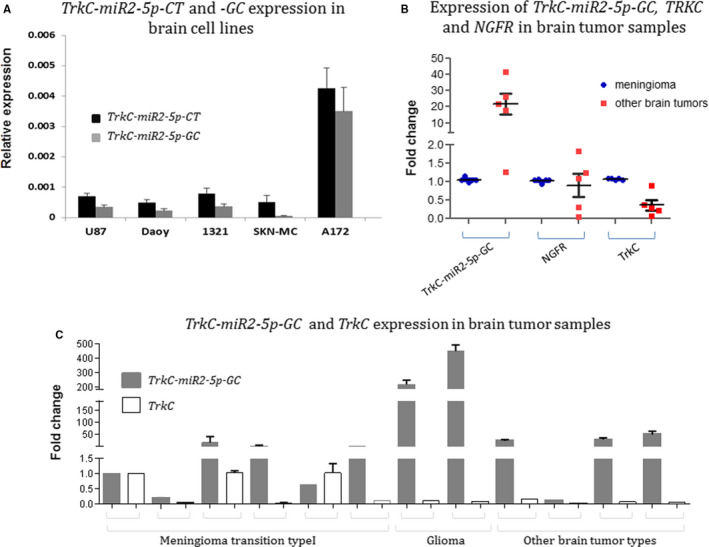
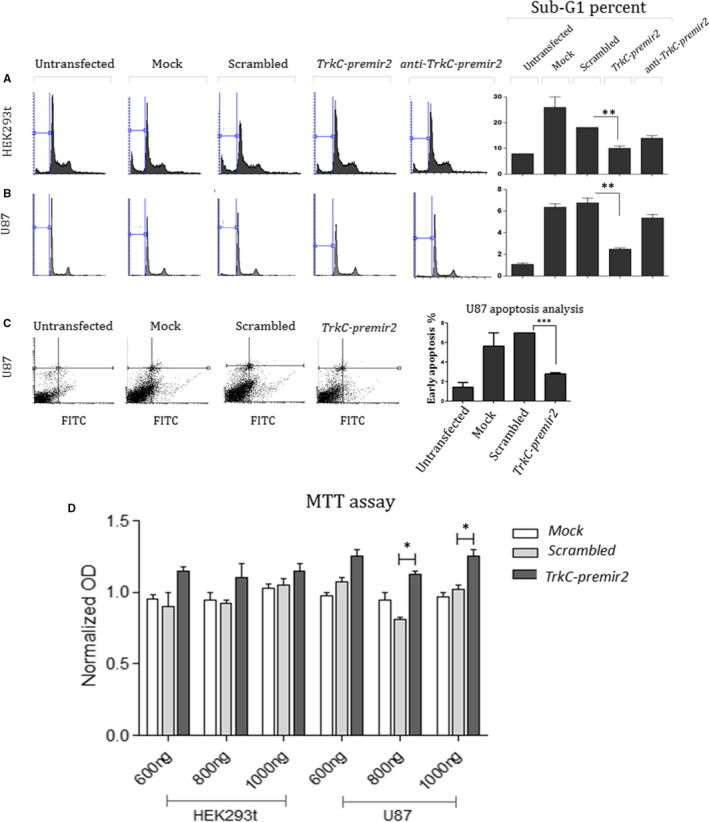
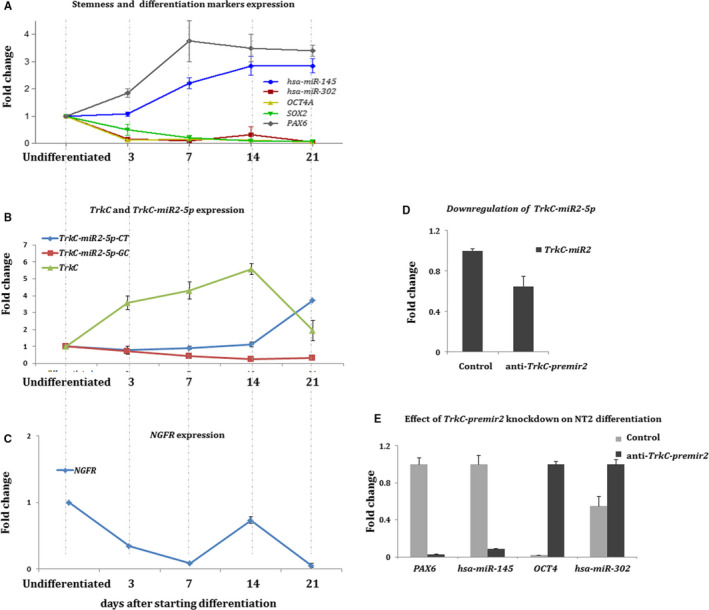
TrkC and NGFR neurotrophin receptors are associated with cell death, cancer and differentiation. TrkC-miR2, which is located in TrkC gene, is known to regulate Wnt signalling pathway, and its influence on other signalling pathways is under investigation. Here, through RT-qPCR, dual-luciferase assay and Western blotting we reveal that TrkC-miR2 targets NGFR. Overexpression of TrkC-miR2 also affected TrkA, TrkC, NFKB, BCL2 and Akt2 expressions involved in neurotrophin signalling pathway, and elevated survival rate of HEK293t and U87 cells was distinguished by flow cytometry and MTT assay. Consistently, an opposite expression correlation was obtained between TrkC-miR2 and NGFR or TrkC for the duration of NT2 differentiation. Meanwhile, TrkC-miR2 down-regulation attenuated NT2 differentiation into neural-like cells. Overall, here we present in silico and experimental evidence showing TrkC-miR2 as a new controller in regulation of neurotrophin signalling pathway.

Keywords: NGFR; TrkC-miR2; neurotrophin signalling pathway.


Conflict of interest statement

The authors declare that there is no conflict of interest with any financial organization regarding the material discussed in the manuscript.

Figures

FIGURE 1
FIGURE 1
Direct interaction between TrkC‐miR2 and NGFR. A, The alignment and conservation status of three of MREs predicted by Dianna lab software for TrkC‐miR2 with NGFR. B, RT‐qPCR indicates NGFR down‐regulation following TrkC‐premir2 overexpression within SW480 cells, compared with the related negative controls. C, Western blotting gel image shows NGFR protein level reduction following the TrkC‐premir2 overexpression in HUH7 cells. The cells were either transfected with the vector encoding TrkC‐premir2 or the related controls. Results show down‐regulation of NGFR protein as a result of TrkC‐premir2 overexpression. D, Analysis of dual‐luciferase assay revealed supporting evidence in direct interaction between NGFR and TrkC‐miR2. In this assay, 3’UTR of Bok gene was used as an off‐target control. Results are the mean of triplicate; P <.05
FIGURE 2
FIGURE 2
Consequence of TrkC‐premir2 overexpression on the expression level of the downstream genes in neurotrophin signalling pathway. Elevated expression of the genes implicated in subpathways of neurotrophin signalling pathway following TrkC‐premir2 overexpression in comparison with the cells transfected with empty vector as a negative control. Except TrkC, most of tested genes were up‐regulated following overexpression of TrkC‐premir2. SD of duplicate experiments is shown by the error bars. GAPDH was applied as an internal control. Expression data were normalized using 2‐ΔΔCt method
FIGURE 3
FIGURE 3
TrkC, NGFR and TrkC‐miR2‐5p expression status in brain tumours and cell lines. A, Detection of TrkC‐miR2‐5p isomiRs in brain (glioma and non‐glioma) cell lines. In glioma‐originated A172 cells, TrkC‐miR2‐5p isomiR’s expression level was significantly higher than other cell lines. B, TrkC‐miR2‐5p‐GC is significantly elevated in brain tumours (about 20 folds) compared with the meningioma transition type 1 tissue samples (P <.001) analysed by the Mann‐Whitney method. However, the expression of TrkC and NGFR was decreased in related samples. C, The figure shows TrkC‐miR2‐5p‐GC and TrkC expression levels in different brain tumour tissue specimens. RT‐qPCR was performed for the analysis of TrkC‐miR2‐5p‐GC expression in the tumour specimens in comparison with their expression level in the meningioma transition type I. Here, the maximum expression level of TrkC‐miR2‐5p‐GC was distinguished in glioma samples. GAPDH and U48 were applied as internal controls for normalization of protein coding and miRNA expressions, respectively
FIGURE 4
FIGURE 4
Implication of TrkC‐premir2 overexpression in the cell cycle status alteration of the cells. A and B, PI staining of the HEK293 t and U87 cells after the overexpression and knock down of TrkC‐premir2. Significant decrease in the distribution of sub‐G1 cell population was documented in HEK293 t (A) and U87 (B) cells following overexpression of TrkC‐premir2. Consistently, knockdown of TrkC‐premir2 in the same cells had a reverse effect on sub‐G1 percentage. C, The figure displays annexin‐PI analysis of transfected U87 cells. The gate setting revealed that most of the cells that overexpress TrkC‐premir2 have less distribution in early apoptosis stage (bottom right), compared with the negative controls. D, The figure illustrates the outcome of MTT test in the HEK293 t and U87 cells containing a vector encoding TrkC‐premir2. Survival rate of the transfected U87 and HEK293 t cells was meaningfully raised following TrkC‐premir2 overexpression. SD of triplicate experiments is shown by error bar
FIGURE 5
FIGURE 5
Expression profile of TrkC and TrkC‐miR2 isomiRs for the duration of NT2 cell differentiation into neural‐like cells. A, The figure demonstrates hsa‐miR‐145 up‐regulation and down‐regulation of hsa‐miR‐302, Oct4 and Sox2 markers for the period of NT2 differentiation, performed by RT‐qPCR. Data were compared with the undifferentiated cells. GAPDH was applied as an internal control for normalizing Oct4 and Sox2 expressions. U48 expression was used for normalization of the expression of hsa‐miR‐145 and hsa‐miR‐302. B, Tracking of the expression alteration of TrkC‐miR2‐5p isomiRs and TrkC throughout the differentiation of NT2 cells, detected by RT‐qPCR. As shown in this section, TrkC‐miR2‐5p‐CT is expressed in a reverse correlation with TrkC since 14th day of the course. C, A reverse correlation of expression was also deduced between NGFR gene and TrkC‐miR2‐5p‐CT since day 14th of the differentiation course. D, Shows successful down‐regulation of TrkC‐miR2 following the application of an antisense sequence against TrkC‐premir2 in NT2 cells. E, Down‐regulation of differentiation markers (hsa‐miR‐145 and PAX6) and up‐regulation of stemness markers (hsa‐miR‐302 and Oct4A) following the TrkC‐premir2 knockdown by a construct containing its antisense sequence. All data were compared with the expression levels in the undifferentiated NT2 cells. GAPDH was applied for normalization of PAX6 and Oct4A U48 was employed as the internal control for normalization of the expression of hsa‐miR‐145 and hsa‐miR‐302. Error bars indicate SD of duplicate experiments

Similar articles

Cited by

References

    1. Reichardt LF. Neurotrophin‐regulated signalling pathways. Philos Trans R Soc Lond B Biol Sci. 2006;361:1545‐1564. - PMC - PubMed
    1. McGregor LM, McCune BK, Graff JR, et al. Roles of trk family neurotrophin receptors in medullary thyroid carcinoma development and progression. Proc Natl Acad Sci. 1999;96:4540‐4545. - PMC - PubMed
    1. Genevois A‐L, Ichim G, Coissieux M‐M, et al. Dependence receptor TrkC is a putative colon cancer tumor suppressor. Proc Natl Acad Sci. 2013;110:3017‐3022. - PMC - PubMed
    1. Jin W, Kim GM, Kim MS, et al. TrkC plays an essential role in breast tumor growth and metastasis. Carcinogenesis. 2010;31:1939‐1947. - PubMed
    1. Luo Y, Kaz AM, Kanngurn S, et al. NTRK3 is a potential tumor suppressor gene commonly inactivated by epigenetic mechanisms in colorectal cancer. PLoS Genet. 2013;9:e1003552. - PMC - PubMed

Publication types