

Female mice may have exacerbated catabolic signalling response compared to male mice during development and progression of disuse atrophy
- PMID: 33675163
- PMCID: PMC8200438
- DOI: 10.1002/jcsm.12693
Female mice may have exacerbated catabolic signalling response compared to male mice during development and progression of disuse atrophy
Abstract
Background: Muscle atrophy is a common pathology associated with disuse, such as prolonged bed rest or spaceflight, and is associated with detrimental health outcomes. There is emerging evidence that disuse atrophy may differentially affect males and females. Cellular mechanisms contributing to the development and progression of disuse remain elusive, particularly protein turnover cascades. The purpose of this study was to investigate the initial development and progression of disuse muscle atrophy in male and female mice using the well-established model of hindlimb unloading (HU).
Methods: One hundred C57BL/6J mice (50 male and 50 female) were hindlimb suspended for 0 (control), 24, 48, 72, or 168 h to induce disuse atrophy (10 animals per group). At designated time points, animals were euthanized, and tissues (extensor digitorum longus, gastrocnemius, and soleus for mRNA analysis, gastrocnemius and extensor digitorum longus for protein synthesis rates, and tibialis anterior for histology) were collected for analysis of protein turnover mechanisms (protein anabolism and catabolism).
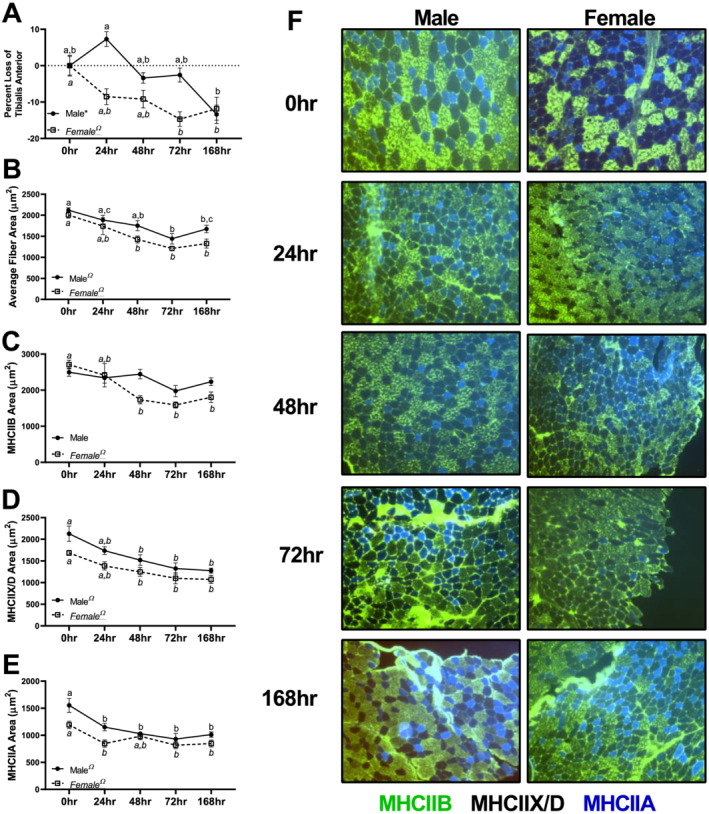
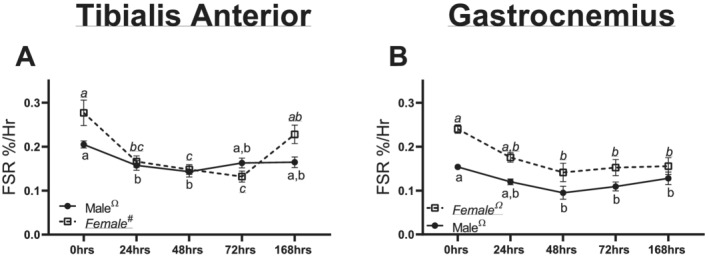
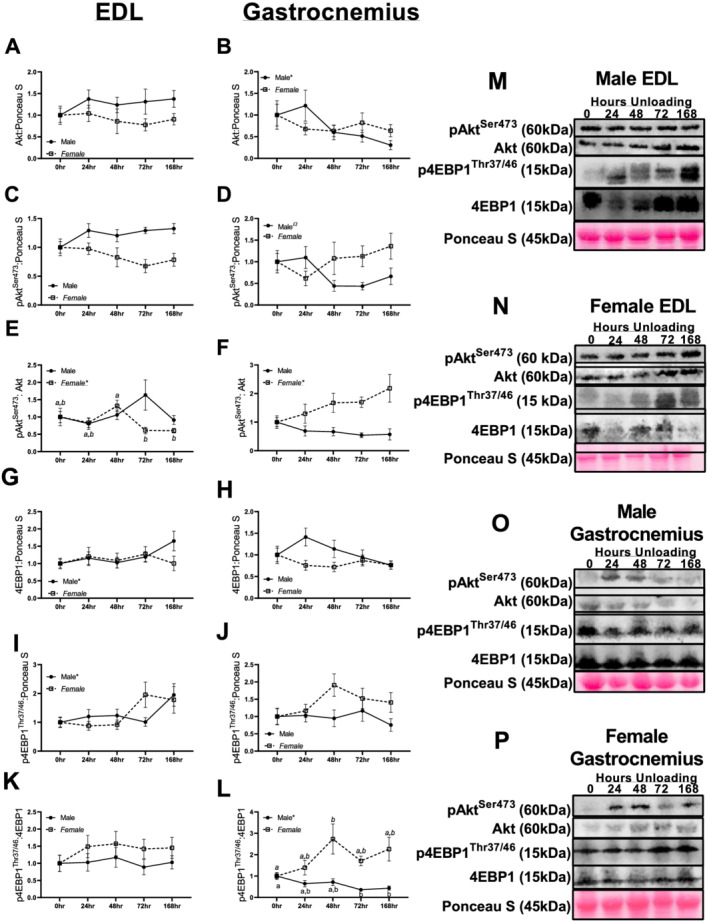
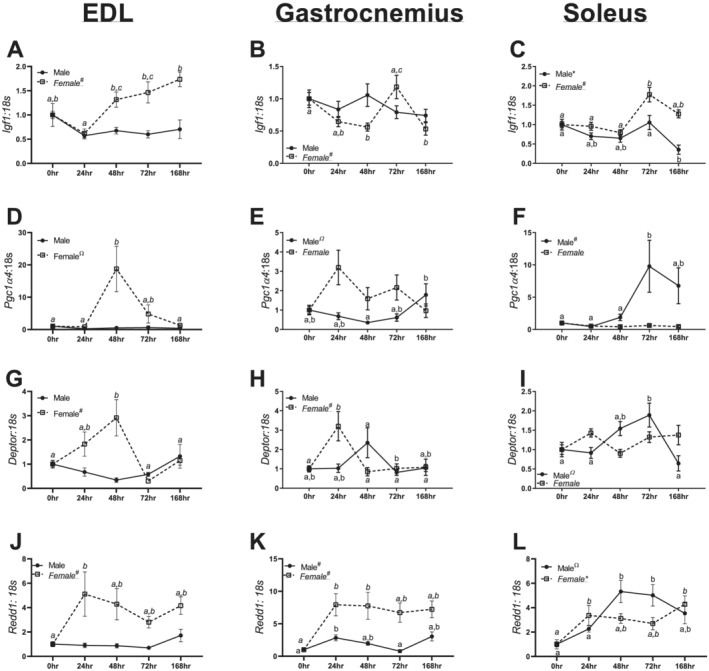
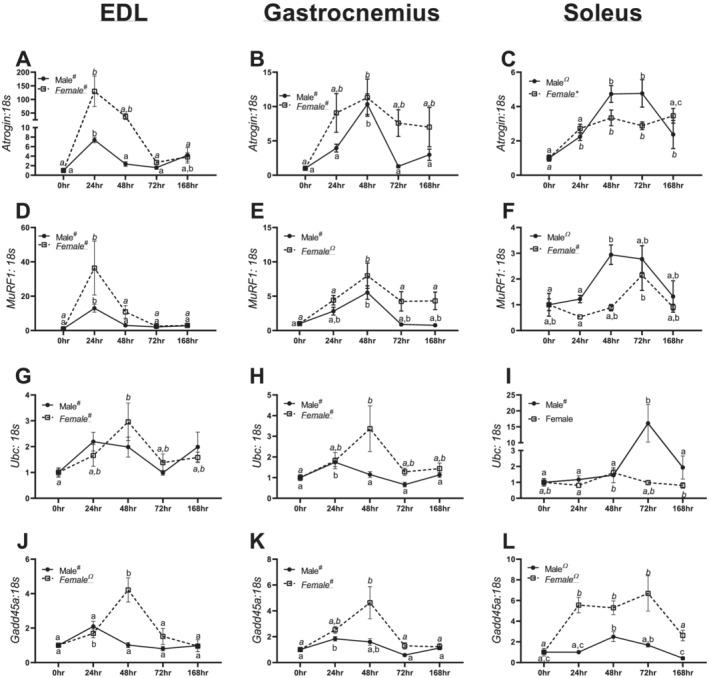
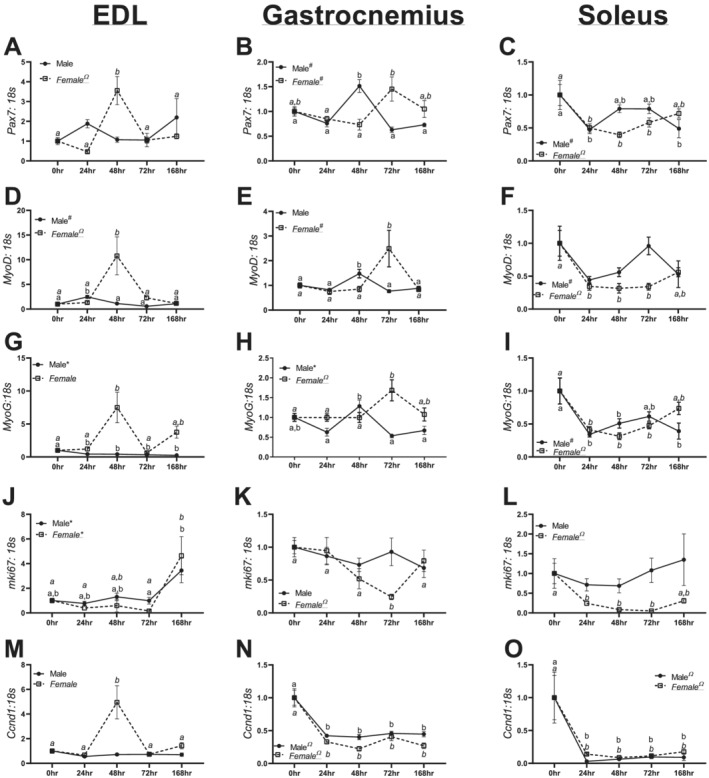
Results: Both males and females lost ~30% of tibialis anterior cross-sectional area after 168 h of disuse. Males had no statistical difference in MHCIIB fibre area, whereas unloaded females had ~33% lower MHCIIB cross-sectional area by 168 h of unloading. Both males and females had lower fractional protein synthesis rates (FSRs) within 24-48 h of HU, and females appeared to have a greater reduction compared with males within 24 h of HU (~23% lower FSRs in males vs. 40% lower FSRs in females). Males and females exhibited differential patterns and responses in multiple markers of protein anabolism, catabolism, and myogenic capacity during the development and progression of disuse atrophy. Specifically, females had greater mRNA inductions of catabolic factors Ubc and Gadd45a (~4-fold greater content in females compared with ~2-fold greater content in males) and greater inductions of anabolic inhibitors Redd1 and Deptor with disuse across multiple muscle tissues exhibiting different fibre phenotypes.
Conclusions: These results suggest that the aetiology of disuse muscle atrophy is more complicated and nuanced than previously thought, with different responses based on muscle phenotypes and between males and females, with females having greater inductions of atrophic markers early in the development of disuse atrophy.
Keywords: Females; Males; Muscle loss; Protein anabolism; Protein catabolism; Sex differences.
© 2021 The Authors. Journal of Cachexia, Sarcopenia and Muscle published by John Wiley & Sons Ltd on behalf of Society on Sarcopenia, Cachexia and Wasting Disorders.
Conflict of interest statement
None declared.
Figures
Similar articles
-
Mitochondrial aberrations during the progression of disuse atrophy differentially affect male and female mice.J Cachexia Sarcopenia Muscle. 2021 Dec;12(6):2056-2068. doi: 10.1002/jcsm.12809. Epub 2021 Sep 29. J Cachexia Sarcopenia Muscle. 2021. PMID: 34585846 Free PMC article.
-
Biological sex divergence in transcriptomic profiles during the onset of hindlimb unloading-induced atrophy.Am J Physiol Cell Physiol. 2023 Nov 1;325(5):C1276-C1293. doi: 10.1152/ajpcell.00352.2023. Epub 2023 Sep 25. Am J Physiol Cell Physiol. 2023. PMID: 37746697 Free PMC article.
-
A time course for markers of protein synthesis and degradation with hindlimb unloading and the accompanying anabolic resistance to refeeding.J Appl Physiol (1985). 2020 Jul 1;129(1):36-46. doi: 10.1152/japplphysiol.00155.2020. Epub 2020 May 14. J Appl Physiol (1985). 2020. PMID: 32407240 Free PMC article.
-
Control of skeletal muscle atrophy in response to disuse: clinical/preclinical contentions and fallacies of evidence.Am J Physiol Endocrinol Metab. 2016 Sep 1;311(3):E594-604. doi: 10.1152/ajpendo.00257.2016. Epub 2016 Jul 5. Am J Physiol Endocrinol Metab. 2016. PMID: 27382036 Free PMC article. Review.
-
Skeletal muscle atrophy during short-term disuse: implications for age-related sarcopenia.Ageing Res Rev. 2013 Sep;12(4):898-906. doi: 10.1016/j.arr.2013.07.003. Epub 2013 Aug 12. Ageing Res Rev. 2013. PMID: 23948422 Review.
Cited by
-
Females display relatively preserved muscle quality compared with males during the onset and early stages of C26-induced cancer cachexia.J Appl Physiol (1985). 2023 Sep 1;135(3):655-672. doi: 10.1152/japplphysiol.00196.2023. Epub 2023 Aug 3. J Appl Physiol (1985). 2023. PMID: 37535708 Free PMC article.
-
Sex differences in spontaneous respiratory recovery following chronic C2 hemisection.J Appl Physiol (1985). 2024 Jul 1;137(1):166-180. doi: 10.1152/japplphysiol.00040.2024. Epub 2024 Jun 13. J Appl Physiol (1985). 2024. PMID: 38867665 Free PMC article.
-
The oestrous cycle and skeletal muscle atrophy: Investigations in rodent models of muscle loss.Exp Physiol. 2021 Dec;106(12):2472-2488. doi: 10.1113/EP089962. Epub 2021 Oct 18. Exp Physiol. 2021. PMID: 34569104 Free PMC article.
-
Genetic diversity modulates the physical and transcriptomic response of skeletal muscle to simulated microgravity in male mice.NPJ Microgravity. 2023 Dec 1;9(1):86. doi: 10.1038/s41526-023-00334-8. NPJ Microgravity. 2023. PMID: 38040743 Free PMC article.
-
Furnishing the cachexia landscape: A year of research in JCSM.J Cachexia Sarcopenia Muscle. 2022 Dec;13(6):2763-2771. doi: 10.1002/jcsm.13151. J Cachexia Sarcopenia Muscle. 2022. PMID: 36510825 Free PMC article. No abstract available.
References
-
- Ali NA, O'Brien JM Jr, Hoffmann SP, Phillips G, Garland A, Finley JC, et al. Acquired weakness, handgrip strength, and mortality in critically ill patients. Am J Respir Crit Care Med 2008;178:261–268. - PubMed
-
- Hermans G, Van Mechelen H, Clerckx B, Vanhullebusch T, Mesotten D, Wilmer A, et al. Acute outcomes and 1‐year mortality of intensive care unit‐acquired weakness. A cohort study and propensity‐matched analysis. Am J Respir Crit Care Med 2014;190:410–420. - PubMed
Publication types
MeSH terms
Grants and funding
LinkOut - more resources
Full Text Sources
Other Literature Sources
