. 2021 Jun 10;31(7):3194-3212.
doi: 10.1093/cercor/bhaa414.

The Transcription Factor Shox2 Shapes Neuron Firing Properties and Suppresses Seizures by Regulation of Key Ion Channels in Thalamocortical Neurons

Affiliations

The Transcription Factor Shox2 Shapes Neuron Firing Properties and Suppresses Seizures by Regulation of Key Ion Channels in Thalamocortical Neurons

Diankun Yu et al. Cereb Cortex. .

Abstract

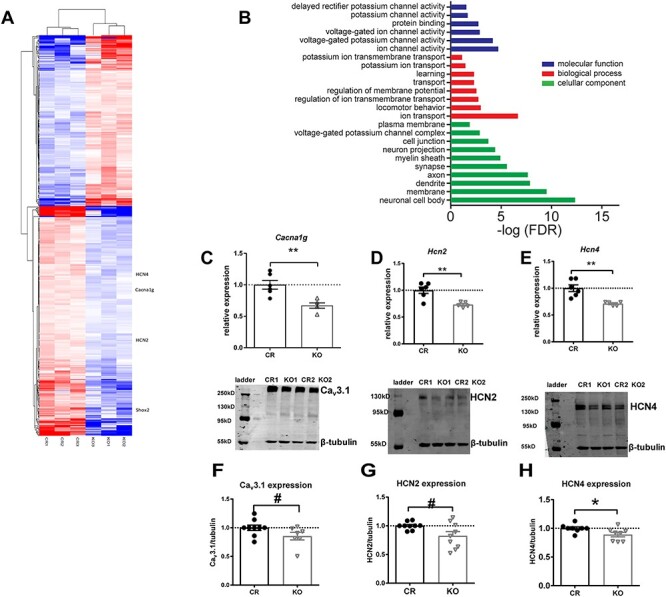
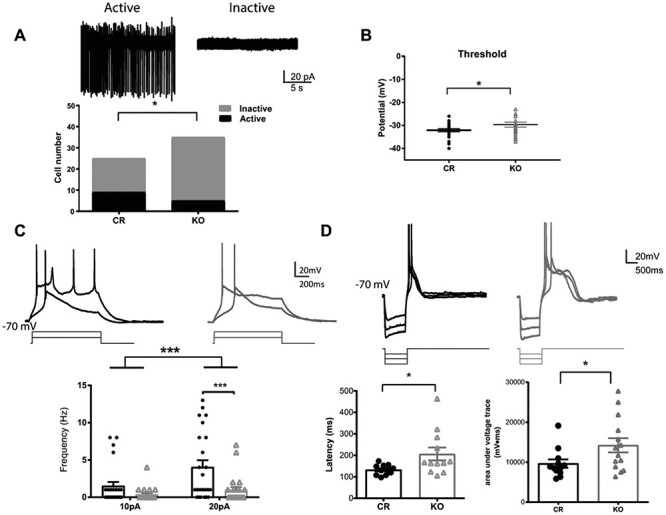
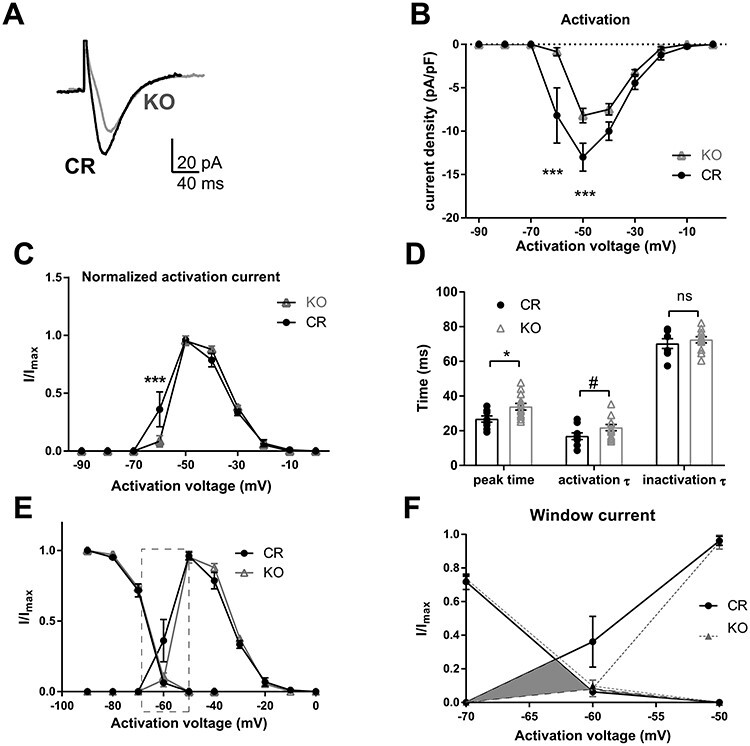
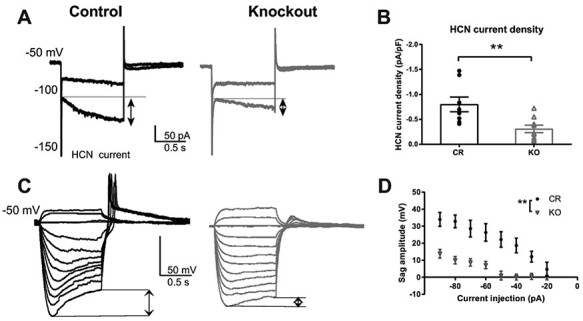
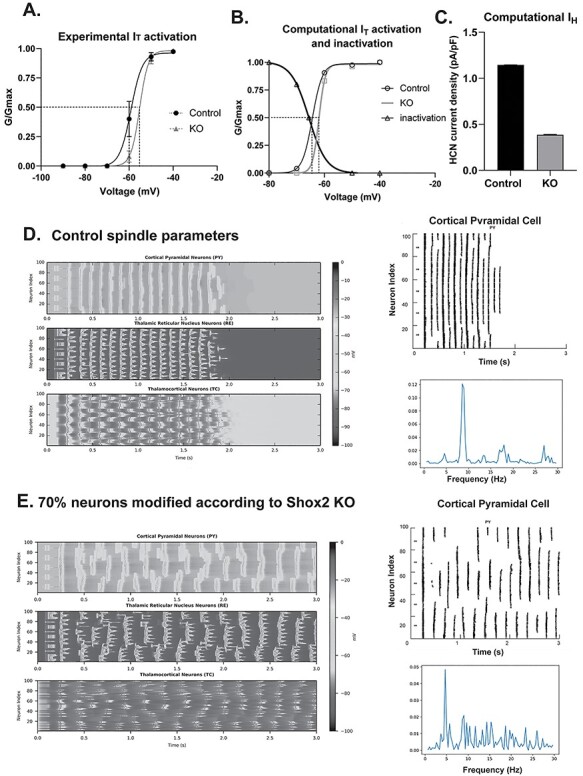
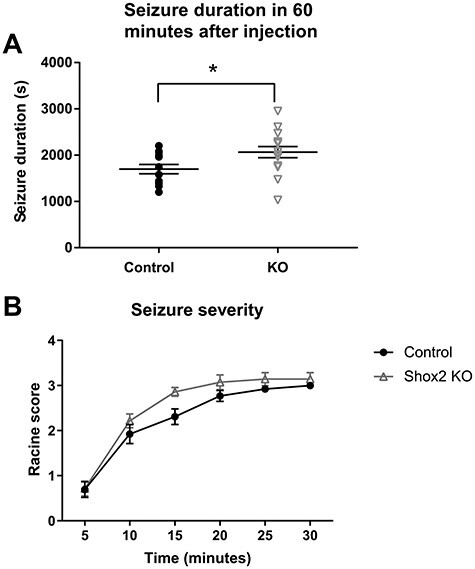
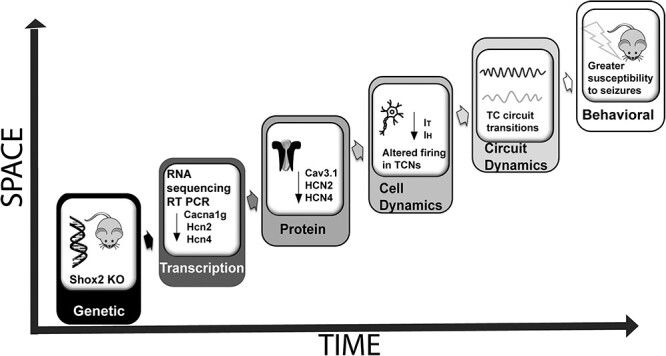
Thalamocortical neurons (TCNs) play a critical role in the maintenance of thalamocortical oscillations, dysregulation of which can result in certain types of seizures. Precise control over firing rates of TCNs is foundational to these oscillations, yet the transcriptional mechanisms that constrain these firing rates remain elusive. We hypothesized that Shox2 is a transcriptional regulator of ion channels important for TCN function and that loss of Shox2 alters firing frequency and activity, ultimately perturbing thalamocortical oscillations into an epilepsy-prone state. In this study, we used RNA sequencing and quantitative PCR of control and Shox2 knockout mice to determine Shox2-affected genes and revealed a network of ion channel genes important for neuronal firing properties. Protein regulation was confirmed by Western blotting, and electrophysiological recordings showed that Shox2 KO impacted the firing properties of a subpopulation of TCNs. Computational modeling showed that disruption of these conductances in a manner similar to Shox2's effects modulated frequency of oscillations and could convert sleep spindles to near spike and wave activity, which are a hallmark for absence epilepsy. Finally, Shox2 KO mice were more susceptible to pilocarpine-induced seizures. Overall, these results reveal Shox2 as a transcription factor important for TCN function in adult mouse thalamus.

Keywords: HCN channel; epilepsy; oscillations; t-type Ca2+ channel; thalamus.


Figures

Figure 1
Figure 1
Shox2 is expressed in NeuN+ neurons in the thalamus and not in GFAP+ astrocytes. Coronal brain sections through the thalamus of Shox2Cre/+, Rosa26LacZ mice were costained with NeuN (green in last 2 columns) and β-gal, the reporter for Shox2 (red in last two columns). Three typical thalamic regions are shown, including anterior PVA (A), dorsal lateral geniculate nucleus (dLGN) (B), and ventrobasal nucleus (VB) (C). Shox2 is expressed in NeuN+ neurons (yellow, merged). Right panels are magnifications of the boxed regions, respectively, showing cells that coexpress Shox2 (red) and NeuN (green). D-F show the coexpression of astrocyte marker GFAP (green) and β-gal, the Shox2 reporter (red), in three thalamic regions: PVA (D), dLGN (E), and VB (F). Right panels in the last column are magnifications of the boxed regions. The arrowheads show the GFAP+ astrocytes, and the white arrows show Shox2-expressing cells as indicated by β-gal. No cells coexpressed GFAP and Shox2. RT: reticular thalamus; AV: anteroventral nucleus of the thalamus; AD: anterodorsal nucleus of the thalamus.
Figure 2
Figure 2
Shox2 is expressed in glutamatergic TCNs but not parvalbumin + interneurons. Coronal sections through the thalamus were costained with parvalbumin (green, A, B) and β-gal (red, A, C). Boxes in Figure A are magnified in D. (habenula), E. Ventrobasal (VB) and reticular nucleus (RT), and F. dorsal lateral geniculate nucleus (dLGN). G. Panels G-I show Shox2 expression in coronal slices of rostral to caudal thalamus (G: Paraventricular nucleus of the thalamus (PVA) relative to Bregma, approx. -1.1; H: lateral geniculate nucleus (LGN) -2.0; I: Medial geniculate nucleus (MGN) –2.9). M-O: Coronal sections from rostral (M) to caudal (O) from the Ai27D-Shox2Cre in which the presence of tdTomato indicates Shox2-expressing neurons. Shox2 is expressed in neurons throughout the thalamus and projections to the cortex, strongly targeting layer IV barrel cortex (white arrows) and layer VI.
Figure 3
Figure 3
Shox2 expression affects gene expression and ion channel protein levels. RNA sequencing and analysis were performed as described in methods. A. Heatmap, made by pheatmap, saturated at 1, displays 367 DEGs (adjust P-value <0.1) in the midline thalamus between control (CR) and Gbx2CreErt, Shox2 KO mice. B. Gene ontology (GO) enrichment analysis of DEGs. All terms with an FDR (analyzed by DAVID functional annotation tool) less than 0.1 are listed. Ingenuity pathway analysis revealed that Shox2 KO-induced DEGs are highly involved in thalamus-related neurological diseases. C-E. RT-qPCR results show that Shox2 KO significantly reduced mRNA level of Cacna1g. (C), Hcn2 (D) and Hcn4 (E). F-H. Shox2 KO decreased the protein expression levels of Cav3.1 (F, ~120 kD), HCN2 (G, ~150 kD), and HCN4 (H, >200 kD) (**, P < 0.01; *, P < 0.05, #, P < 0.1). The bands around ~55–60 kD are recognized by the β-tubulin antibody.
Figure 4
Figure 4
Shox2 KO decreases the ratio of cells with spontaneous action potentials in the anterior paraventricular thalamus. A. Example traces of attached-cell recordings of active cells showing spontaneous action potentials (left) and inactive cells with no action potentials (right). Bar graph representing the ratio of active and inactive cells recorded in PVA from KO and CR mice. This ratio is significantly smaller in KO than in CR mice (*, P < 0.05). B. Threshold measured from first spike of depolarization in KO and CR mice. The threshold was significantly depolarized in KO mice. C. Upper: Example trace of action potential induced by a 1 s, 10 and 20pA current injection steps, while holding membrane potential at −70 mV. Lower: Scatter plot graph showing that the number of spikes induced by 10pA and 20pA current injection at −70 mV was reduced in the KO mice (gray) relative to control mice (black). D. Upper: Example traces of rebound spikes triggered by injection of negative current steps (−50, −100 and −150pA) from a holding potential of −70 mV. Lower—left: The latency to the peak of calcium spike after current injection is significantly longer in Shox2 KO neurons than in control neurons. Lower—right: The areas under voltage traces (between spike traces and −70 mV) indicating plateau depolarizations are significantly larger in Shox2 KO neurons (arrow) than neurons from control mice (*, P < 0.05, ***; P < 0.001).
Figure 5
Figure 5
Properties of T-type calcium currents in PVA neurons of CR and Shox2 KO mice. The T-type calcium currents were isolated using voltage-clamp recordings according to methods. A. An example of T-type calcium currents recorded from PVA neurons of CR and Shox2 KO mice. T-type calcium currents in Shox2 KO mice are smaller in amplitude and slower than in CR mice. B. The current density curve of T-type calcium current activation. T-type calcium current density is smaller in PVA neurons of KO mice compared with CR mice (***, P < 0.001). C. The normalized activation curves indicate that T-type calcium (I/Imax) is larger at −60 mV in CR mice than that in KO mice (***, P < 0.001). D. Summary plot showing the time to peak (*, P < 0.05), activation and inactivation tau of the T-type current in TCNs from CR and KO mice. E. Inactivation and activation curves of T-type currents. F. Membrane potential range magnified to show T-type Ca2+ currents in −70 to −50 mV membrane potential window range.
Figure 6
Figure 6
Shox2 KO decreased HCN current in anterior PVT of neurons. A. An example of HCN current elicited by hyperpolarizing cell membrane from −50 to −100 mV and −150 mV. HCN current is defined as the current difference between the current at the end of 1 s hyperpolarization and the current peak at the beginning of hyperpolarization as shown in the figure (arrows). B. Scatter plot showing that Shox2 KO (n = 9; N = 3) decreased HCN current density in TCNs (**, P < 0.01) compared with CR neurons (n = 8; N = 2). C. Example current clamp recordings demonstrating hyperpolarizing pulses and sag in CR and KO mice. D. Current voltage plot showing sag amplitude measured in response to negative current injection (90–10 pA). (**, P < 0.01; n = 7; N = 2; KO n = 6, N = 3).
Figure 7
Figure 7
Computational model suggests that Shox2 modulation alters thalamocortical oscillation frequency. A. Plot of experimental activation and Boltzmann showing half-activation of IT for cells recorded in WT (−60 mV) and KO mice (−57 mV). B. Plot of activation of computational T-type current was generated, and Boltzmann fit showed a half activation voltage of −65 mV that shifted to −62 mV for the KO. C. Computational IH conductance was reduced by 60% as in experimental data. D. The model is set to baseline parameters that generate spindle oscillations (8 Hz). Each heat map displays activity of a cell-type population (PY, TCN, or RE) with cell index number on the y-axis and time on the x-axis. Oscillation frequency is determined by the number of PY population events per second. Right-Raster plots of computational pyramidal cell spike times. Frequency was determined by Fast Fourier transform (FFT) analysis of control (D) and KO (E) computational PY neurons in thalamocortical network reveals a peak at 8 Hz for control and ~4.5 Hz for KO paradigms.
Figure 8
Figure 8
Pilocarpine induced longer duration seizures earlier compared with WT mice. Control and KO (RosaCreErt-Shox2 KO) mice were injected with methyl-scopolamine (1 mg/kg) and 30 min later received a single injection of pilocarpine (300 mg/kg). Behavioral seizures were observed and scored by a blinded observer according to the modified Racine scale in 5 min blocks up to 1 h after pilocarpine injection. A. Shox2 KO mice spent more time in seizure (P = 0.03). B. Shox2 KO mice developed seizures earlier compared with littermate controls (P = 0.01).
Figure 9
Figure 9
Schematic diagram of analyses accomplished in this study. We used Shox2 KO mice to determine the functional role of Shox2, demonstrating that Shox2 affects ion channel mRNA expression that is important for functional properties of the TCNs and thalamocortical circuit dynamics. This ultimately leads to a susceptibility to seizure generation.

Similar articles

Cited by

References

    1. Anderson MP, Mochizuki T, Xie J, Fischler W, Manger JP, Talley EM, Scammell TE, Tonegawa S. 2005. Thalamic Cav3.1 T-type Ca2+ channel plays a crucial role in stabilizing sleep. Proc Natl Acad Sci U S A. 102:1743–1748. - PMC - PubMed
    1. Arcelli P, Frassoni C, Regondi MC, De Biasi S, Spreafico R. 1997. GABAergic neurons in mammalian thalamus: a marker of thalamic complexity? Brain Res Bull. 42:27–37. - PubMed
    1. Avoli M, Gloor P, Kostopoulos G, Gotman J. 1983. An analysis of penicillin-induced generalized spike and wave discharges using simultaneous recordings of cortical and thalamic single neurons. J Neurophysiol. 50:819–837. - PubMed
    1. Bal T, McCormick DA. 1996. What stops synchronized thalamocortical oscillations? Neuron. 17:297–308. - PubMed
    1. Bal T, Krosigk M, McCormick DA. 1995. Synaptic and membrane mechanisms underlying synchronized oscillations in the ferret lateral geniculate nucleus in vitro. J Physiol. 483(Pt 3):641–663. - PMC - PubMed

Publication types

MeSH terms