. 2021 Mar;20(3):e13334.
doi: 10.1111/acel.13334. Epub 2021 Mar 6.

Astrocyte dystrophy in ageing brain parallels impaired synaptic plasticity

Affiliations

Astrocyte dystrophy in ageing brain parallels impaired synaptic plasticity

Alexander Popov et al. Aging Cell. 2021 Mar.

Abstract

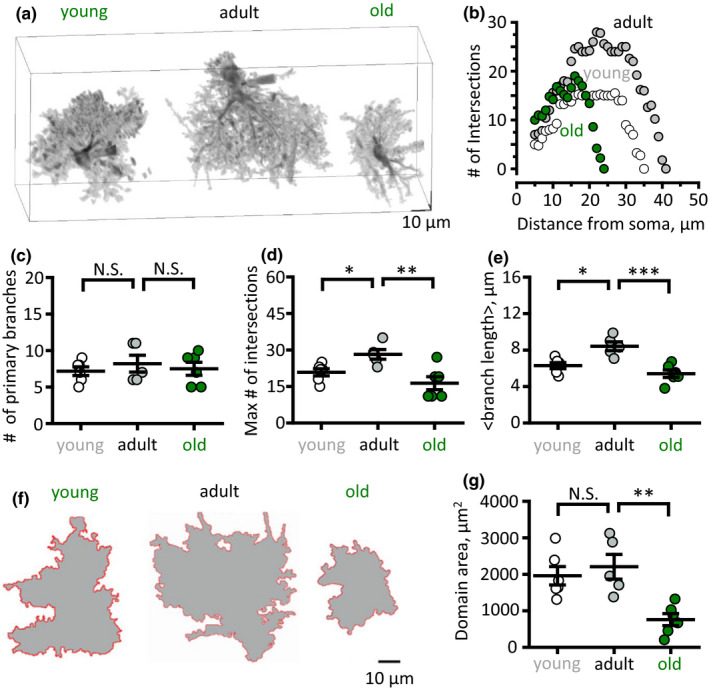
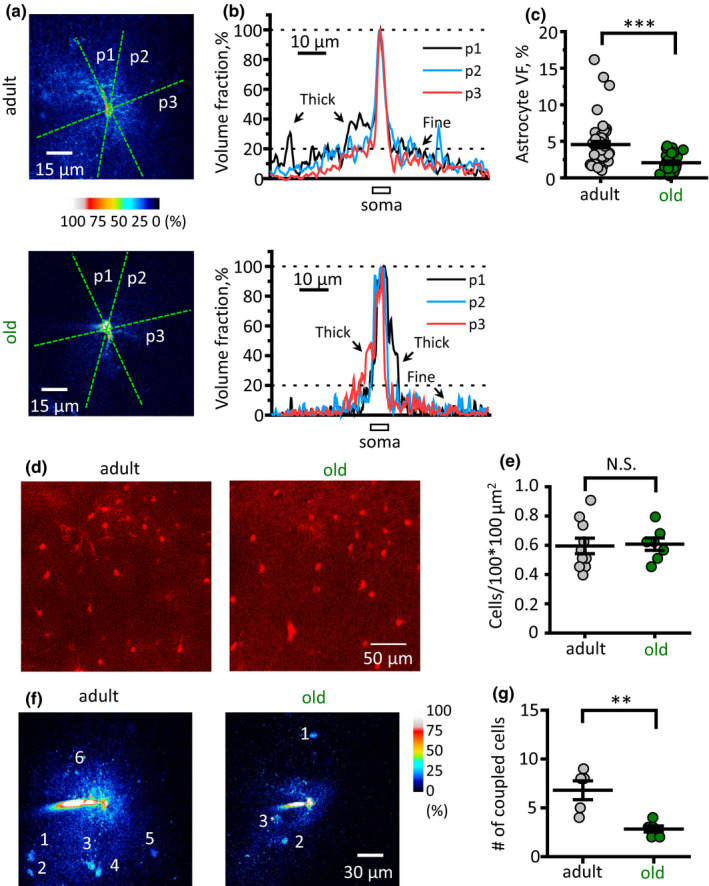
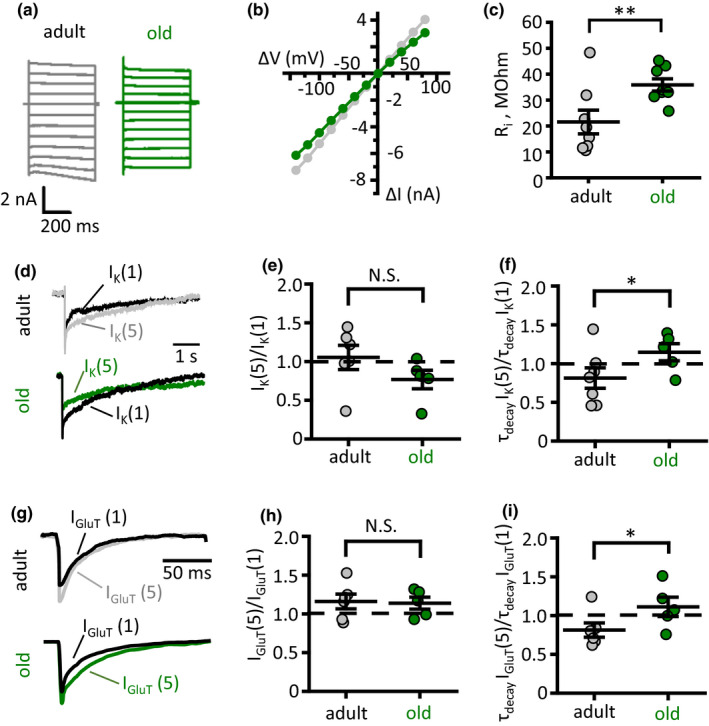
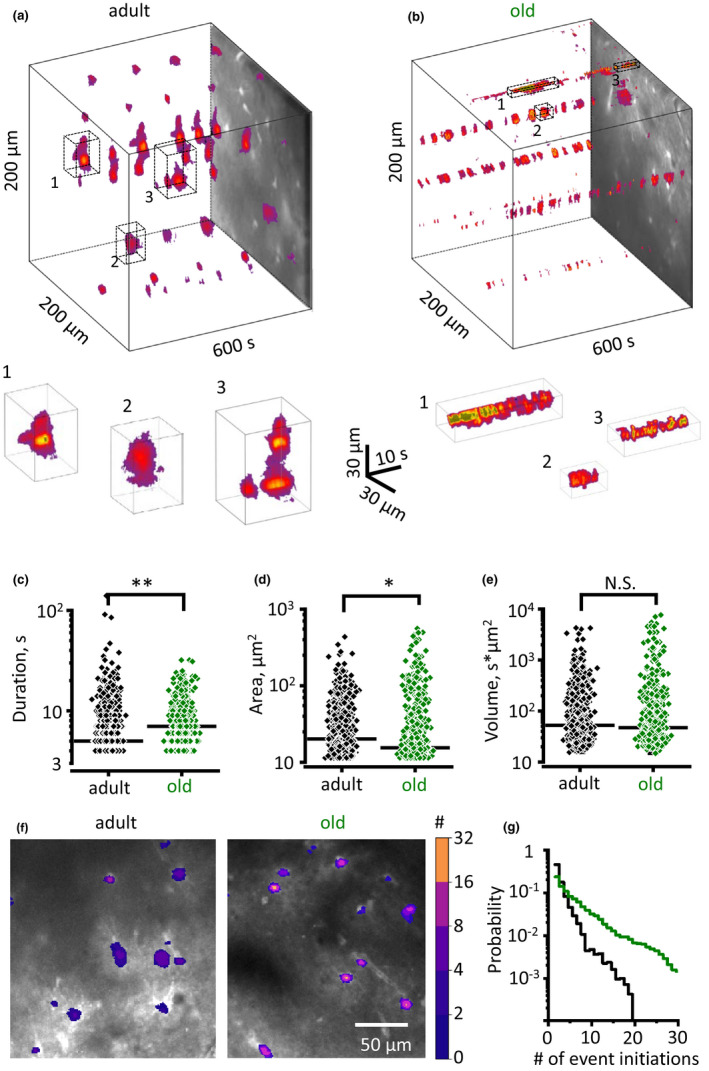
Little is known about age-dependent changes in structure and function of astrocytes and of the impact of these on the cognitive decline in the senescent brain. The prevalent view on the age-dependent increase in reactive astrogliosis and astrocytic hypertrophy requires scrutiny and detailed analysis. Using two-photon microscopy in conjunction with 3D reconstruction, Sholl and volume fraction analysis, we demonstrate a significant reduction in the number and the length of astrocytic processes, in astrocytic territorial domains and in astrocyte-to-astrocyte coupling in the aged brain. Probing physiology of astrocytes with patch clamp, and Ca2+ imaging revealed deficits in K+ and glutamate clearance and spatiotemporal reorganisation of Ca2+ events in old astrocytes. These changes paralleled impaired synaptic long-term potentiation (LTP) in hippocampal CA1 in old mice. Our findings may explain the astroglial mechanisms of age-dependent decline in learning and memory.

Keywords: K+ buffering; ageing; astrocyte; astrocytic complexity; astrocytic cradle; glutamate uptake; perisynaptic astrocytic processes.


Conflict of interest statement

The authors declare that there is no conflict of interest.

Figures

FIGURE 1
FIGURE 1
Bidirectional changes in astrocytic branches and branchlets, and of astrocytic domain size during mouse lifespan. (a) Three‐dimensional reconstructions of hippocampal astrocytes loaded with a fluorescent dye (Alexa Fluor 594) of three age groups: young (left), adult (middle) and old (right). (b) An example of single astrocyte 3D Sholl analysis which shows the number of intersections of astrocytic branches and branchlets with concentric spheres centred in the middle of cell soma. (c–e) Summary of the primary brunches number (c), the maximum number of intersections (d) and mean branch and branchlet length (e) in three age groups. (f) Projections of astrocytic reconstructions which were used to define astrocytic domain area in three age groups. (g) Summary of the astrocytic domain areas in three age groups. White circles—young, grey circles—adult, green circles—old mice. The data are presented as the mean ± SEM. N.S. p > 0.05; *p < 0.05; **p < 0.01; two‐tailed two‐sample t‐test
FIGURE 2
FIGURE 2
Ageing decreases the volume fraction (VF) of fine astrocytic processes and astrocytic coupling to the neighbours. (a) Examples of two astrocytes from adult (top) and old (bottom) mice. The astrocytes were loaded with Alexa Fluor 594 through patch pipette. The fluorescence intensity of each pixel was normalised to the peak fluorescence intensity in the soma (100% of VF). Green dashed lines indicate several positions of cross sections (p1, p2, p3). (b) Fluorescence profiles corresponding to cross sections shown at the panel (a). The central peak of fluorescence corresponds to the brightest pixels in soma to which the fluorescence was normalised to obtain local VF. Other peaks of fluorescence correspond to thick astrocytic branches which were excluded from further analysis. Top—adult mouse; bottom—old mouse. (c) Summary of fine unresolved processes VF. (d) Examples of sulphorhodamine 101 stainings of hippocampal CA1 str. radiatum astrocytes from adult (left) and old (right) mice. (e) The density of astrocytes stained with sulphorhodamine 101. (f) Examples of dye diffusion through gap junctions to neighbouring astrocytes from adult (left) and old (right) mice. (g) Number of coupled astrocytes in adult and old mice. Grey circles—adult, green circles—old mice. The data are presented as the mean ± SEM. N.S. p > 0.05; **p < 0.01; ***p < 0.001; two‐tailed two‐sample t‐test
FIGURE 3
FIGURE 3
Astrocyte dystrophy enhances glutamate and K+ spillover. (a) Recordings of astrocytic currents in response to voltage steps (from −140 mV to +80 mV with 20‐mV interval) delivered through patch pipette to voltage‐clamped adult (grey traces) and old (green traces) astrocytes. (b) Current–voltage (I‐V) relationships based on responses presented on panel (a). ΔV—voltage step amplitude, ΔI—current response. (c) Summary of astrocyte input resistance (Ri). (d) Astrocytic currents in response to stimulation of Schaffer collaterals: IK(1)—response to a single stimulus; IK(5)—isolated response to 5th stimulus in burst stimulation (5 stim × 50 Hz minus 5 stim × 50 Hz). Top—adult, bottom—old mouse. (e and f) Summary of activity‐dependent change in the amplitude [IK(1)/IK(5), e] and the decay time of K+ current [τdecayIK(5)/τdecayIK(1), f]. (g) Glutamate transporter‐mediated current—astrocytic currents in response to stimulation of Schaffer collaterals after subtraction of K+ current: IGluT(1)—response to a single stimulus; IGluT(5)—isolated response to 5th stimulus in burst stimulation (5 stim x 50 Hz minus 5 stim x 50 Hz). Top—adult, bottom—old mouse. (h and i) Summary of activity‐dependent change in the amplitude [IGluT(1)/IGluT(5), h] and the decay time of glutamate transporter current [τdecayIGluT(5)/τdecayIGluT(1), i]. Grey circles—adult, green circles—old mice. The data are presented as the mean ±SEM. N.S. p > 0.05; *p < 0.05; **p < 0.01; two‐tailed two‐sample t‐test
FIGURE 4
FIGURE 4
Ageing reduces spread of Ca2+ events in hippocampal astrocytes. (a and b) x‐y‐time reconstruction of detected Ca2+ events in hippocampal str. radiatum (top) with examples of individual events zoomed in from the boxed regions (bottom) in the adult (a) and old (b) mice. (c–e) Summary of event duration (c), area (maximal projection, d), and volume (e) in the adult (black diamonds) and old (green diamonds) mice. Each point represents an individual event. Horizontal black bar indicates the median. (f) Ca2+ event initiation points with the colour‐coded number of events initiated during 10 min recording. (g) The distribution of Ca2+ events initiation points according to the number of events initiated per pixel in the adult (black trace) and old (green trace) mice.*p < 0.05; **p < 0.01; Mann–Whitney test
FIGURE 5
FIGURE 5
Reduced LTP in CA3‐CA1 synapses of old mice. (a) Timecourse of fEPSP amplitude recorded in CA1 str. radiatum in response to Schaffer collaterals stimulation before and after HFS in the adult and old mice hippocampal slices. Insets show sample fEPSP before and 60 min after HFS. 0 min point is the time of HFS. fEPSP amplitude is normalised to mean fEPSP amplitude prior to HFS. (b) Summary of LTP magnitude 50–60 min after HFS stimulation. (c and d) Same as (a and b) but during a partial blockade of glutamate transporters with 100 nM TFB‐TBOA. Grey circles—adult, green circles—old mice. The data are presented as the mean ±SEM. *p < 0.05 two‐tailed two‐sample t‐test

References

    1. Adermark, L. , & Lovinger, D. M. (2008). Electrophysiological properties and gap junction coupling of striatal astrocytes. Neurochemistry International, 52(7), 1365–1372. 10.1016/j.neuint.2008.02.006. - DOI - PMC - PubMed
    1. Berchtold, N. C. , Cribbs, D. H. , Coleman, P. D. , Rogers, J. , Head, E. , Kim, R. , Beach, T. , Miller, C. , Troncoso, J. , Trojanowski, J. Q. , Zielke, H. R. , & Cotman, C. W. (2008). Gene expression changes in the course of normal brain aging are sexually dimorphic. Proceedings of the National Academy of Sciences, 105(40), 15605–15610. 10.1073/pnas.0806883105. - DOI - PMC - PubMed
    1. Bjorklund, H. , Eriksdotter‐Nilsson, M. , Dahl, D. , Rose, G. , Hoffer, B. , & Olson, L. (1985). Image analysis of GFA‐positive astrocytes from adolescence to senescence. Experimental Brain Research, 58(1), 163–170. 10.1007/BF00238964. - DOI - PubMed
    1. Busche, M. A. , & Konnerth, A. (2016). Impairments of neural circuit function in Alzheimer's disease. Philosophical Transactions of the Royal Society of London. Series B, Biological Sciences, 371(1700), 20150429. 10.1098/rstb.2015.0429. - DOI - PMC - PubMed
    1. Cerbai, F. , Lana, D. , Nosi, D. , Petkova‐Kirova, P. , Zecchi, S. , Brothers, H. M. , Wenk, G. L. , & Giovannini, M. G. (2012). The neuron‐astrocyte‐microglia triad in normal brain ageing and in a model of neuroinflammation in the rat hippocampus. PLoS One, 7(9), e45250. 10.1371/journal.pone.0045250. - DOI - PMC - PubMed

Publication types

LinkOut - more resources