. 2021 Apr 6;49(6):3204-3216.
doi: 10.1093/nar/gkab091.

Role of a local transcription factor in governing cellular carbon/nitrogen homeostasis in Pseudomonas fluorescens

Affiliations

Role of a local transcription factor in governing cellular carbon/nitrogen homeostasis in Pseudomonas fluorescens

Naran Naren et al. Nucleic Acids Res. .

Abstract

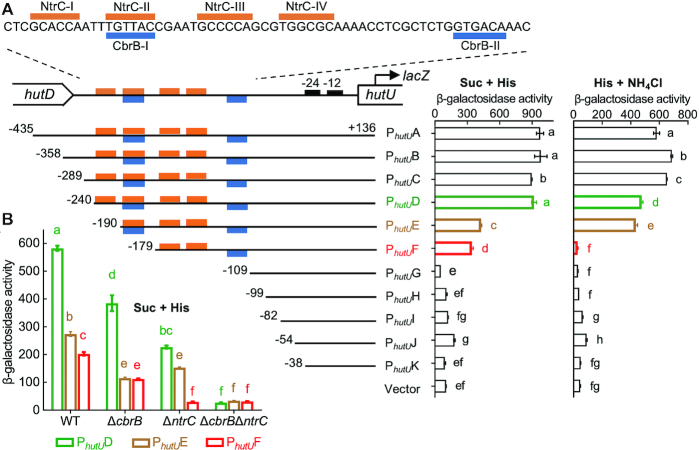
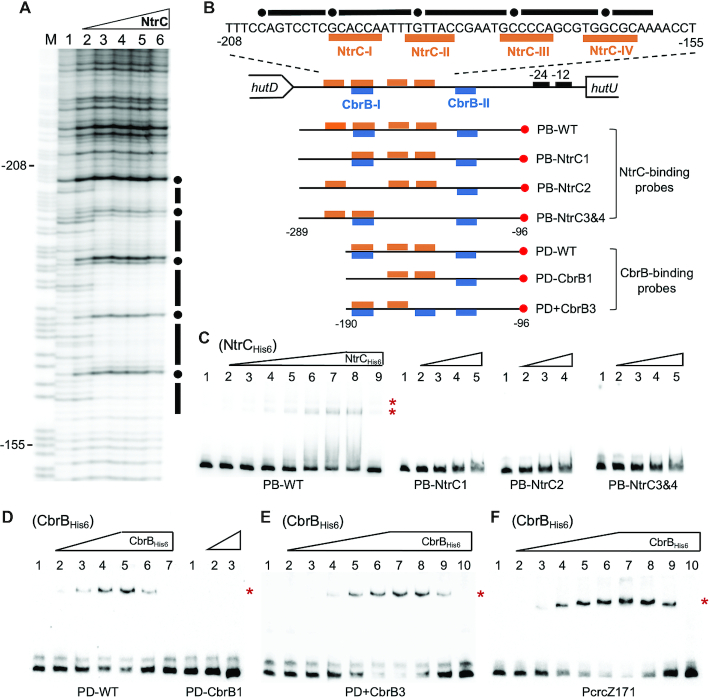
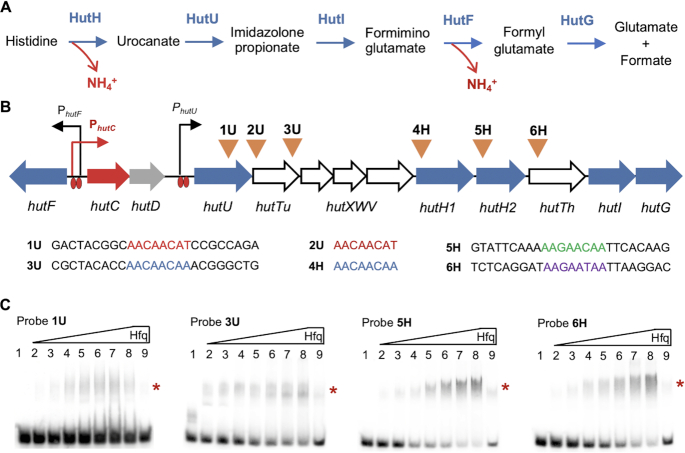
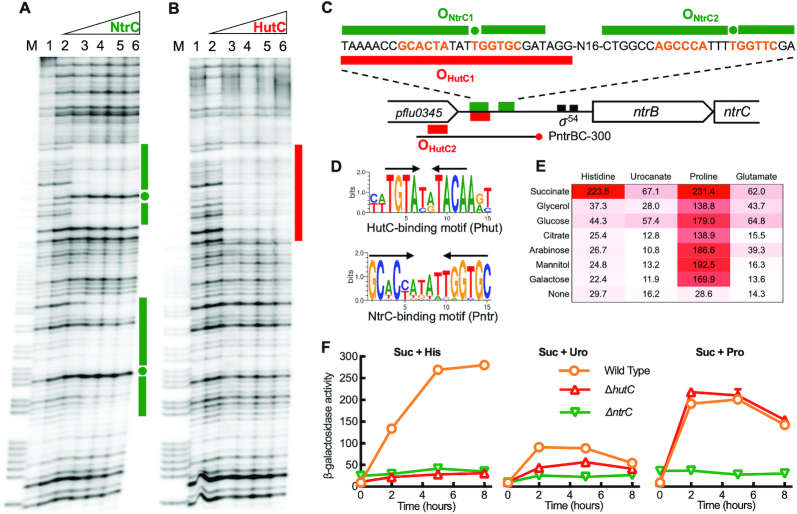
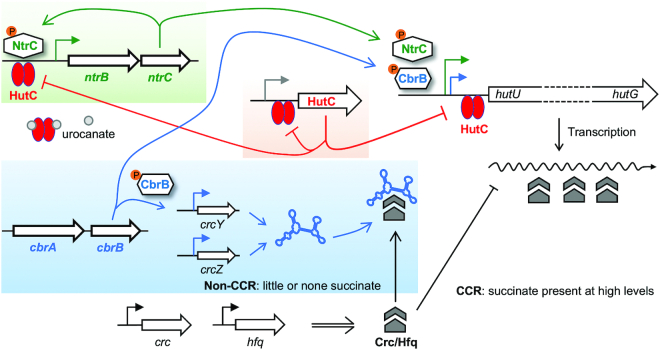
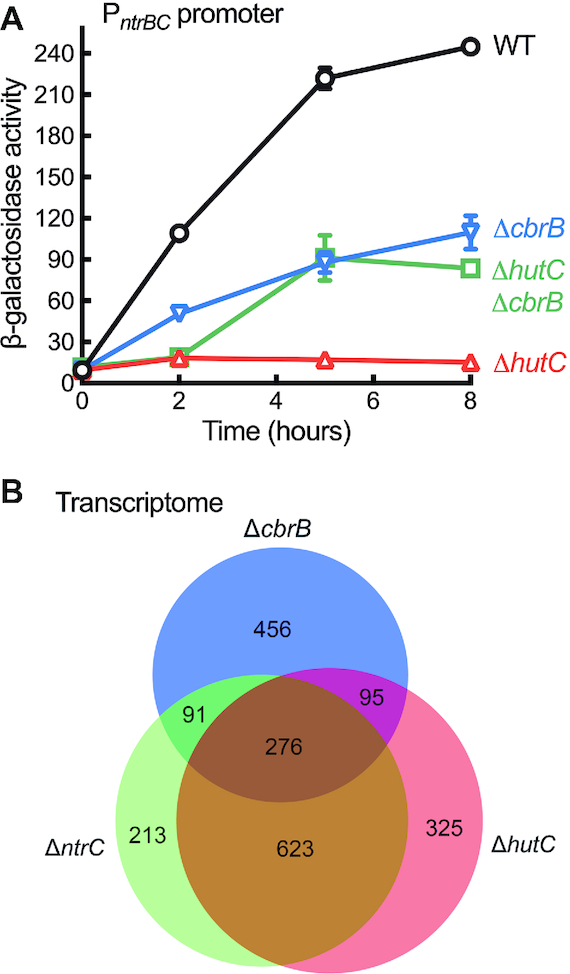
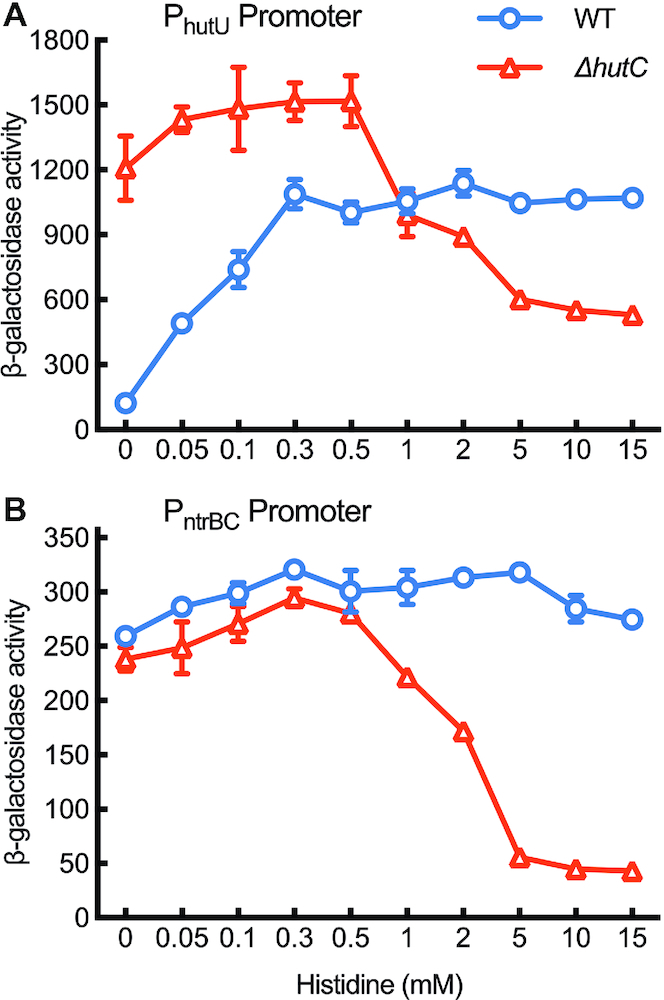
Autoactivation of two-component systems (TCSs) can increase the sensitivity to signals but inherently cause a delayed response. Here, we describe a unique negative feedback mechanism enabling the global NtrB/NtrC regulator to rapidly respond to nitrogen starvation over the course of histidine utilization (hut) in Pseudomonas fluorescens. NtrBC directly activates transcription of hut genes, but overexpression will produce excess ammonium leading to NtrBC inactivation. To prevent this from occurring, the histidine-responsive repressor HutC fine-tunes ntrBC autoactivation: HutC and NtrC bind to the same operator site in the ntrBC promoter. This newly discovered low-affinity binding site shows little sequence similarity with the consensus sequence that HutC recognizes for substrate-specific induction of hut operons. A combination of genetic and transcriptomic analysis indicated that both ntrBC and hut promoter activities cannot be stably maintained in the ΔhutC background when histidine fluctuates at high concentrations. Moreover, the global carbon regulator CbrA/CbrB is involved in directly activating hut transcription while de-repressing hut translation via the CbrAB-CrcYZ-Crc/Hfq regulatory cascade. Together, our data reveal that the local transcription factor HutC plays a crucial role in governing NtrBC to maintain carbon/nitrogen homeostasis through the complex interactions between two TCSs (NtrBC and CbrAB) at the hut promoter.


Figures

Figure 1.
Figure 1.
Genetic analysis of PhutU promoter showing the direct regulatory roles of cbrAB and ntrBC. (A) Putative NtrC and CbrB target sites are indicated by orange and blue bars, respectively. β-Galactosidase activities were measured for wild-type SBW25 containing chromosomally integrated lacZ fusions to eleven PhutU variants (named PhutUA to PhutUK). The empty mini-Tn7 element was included as a negative control. Bacteria were grown in minimal salt medium supplemented with succinate (Suc) + histidine (His) or histidine + NH4Cl. (B) Expression of three PhutU-lacZ variants was assessed in wild-type (WT) and three mutant backgrounds (ΔcbrB, ΔntrC, ΔcbrB ΔntrC) in minimal medium supplemented with succinate and histidine (Suc + His). Data are means and standard errors of four independent cultures. Bars that are not connected by the same letter (shown above each) are significantly different (P < 0.05) by Tukey's HSD.
Figure 2.
Figure 2.
In vitro protein–DNA interactions showing the direct roles of CbrAB and NtrBC in PhutU expression. (A) DNase I footprinting was performed using purified NtrCHis6 and a 194 bp biotin-labeled DNA probe PB-WT. Lane M is G+A marker; Lane 1–6, NtrCHis6 added at an increasing concentration of 0, 0.2, 0.6, 1.6, 3.2 and 5 μM respectively. The protected region is indicated by black bars with hypersensitive residues being marked with filled circles. (B) The hutD - hutU intergenic region showing NtrC-protected DNA sequence and locations of the probe DNAs. The biotin-labeled 3′-ends are marked with red circles. (C) EMSA with NtrCHis6. For wild-type probe PB-WT, NtrC was added at 0, 1.25, 2.5, 5, 10, 15, 20, 25 and 25 μM from lane 1 to 9. In lane 9, the unlabeled probe was added at 60-fold molar excess. For the three mutant probes, NtrC was added at 0, 5, 15, 25 and 37.5 μM from lane 1 to 5. (D) EMSA with CbrBHis6 and PhutU probes. For PD-WT, CbrB was added at 0, 7.83, 11.75, 15.66, 19.58, 19.58 and 19.58 μM from lanes 1 to 7. In lanes 6 and 7, unlabeled probe (competitor DNA) was added at 10- and 60-fold molar excess, respectively. For PD-CbrB1, CbrB was added at 0, 15.66 and 19.58 μM from lane 1 to 3. (E) EMSA with the PD+CbrB3 probe. CbrB was added at 0, 1.31, 3.92, 7.83, 11.75, 15.66, 19.58, 19.58, 19.58, 19.58 μM from lane 1 to 10. Competitor DNA (unlabeled PD+CbrB3) was added at 10-, 20- and 60-fold molar excess in lanes 8–10. (F) EMSA of CbrBHis6 with PcrcZ171 probe. CbrB was added in lanes 1–10 at 0, 1.31, 3.92, 6.53, 9.14, 11.75, 14.36, 14.36, 14.36, 14.36 μM, respectively. Lanes 8–10 contained unlabeled probe at 10-, 20- and 60-fold molar excess. Of note, the NtrC-I, NtrC-II/CbrB-I, NtrC-III and NtrC-IV sites were altered to random sequences of TTCAAG, AACCGT, TAAAGC and AACCGT, respectively. The CbrB-III artificial site ‘GTAACA’ was introduced into the PD+CbrB3 probe sequence at the original NtrC-IV site. Asterisks on right-hand side of each gel denote positions of the shifted bands.
Figure 3.
Figure 3.
Specific interactions between Hfq and its target hut mRNAs. (A) Histidine is sequentially broken down by the following five enzymes: HutH, histidine ammonia lyase or histidase; HutU, urocanase; HutI, imidazolone propionate (IPA) amidohydrolase; HutF, formiminoglutamate (FIGLU) iminohydrolase; HutG, formylglutamate (FG) amidohydrolase. (B) Locations of the six putative Crc/Hfq-binding sites are indicated by inverted triangles above the hut genes. The four oligoribonucleotide probes (1U, 3U, 5H and 6H) are 25 nt in length centred by the predicted Crc/Hfq-binding sequences. Histidine- and urocanate-induced expression of the three hut operons (hutF, hutCD and hutU-G) is mediated by HutC targeting operator sites located in the front of hutU and the hutF-C intergenic region. hutTu and hutTh encode the high-affinity transporter for urocanate and histidine, respectively. hutXWV encodes a high-affinity ABC-type transporter. The hut locus contains two hutH homologues, but hutH1 was not required for bacterial growth on histidine. The function of hutD remains unknown. (C) EMSA was performed using purified HfqHis6 and each of the four RNA probes labeled with biotin at the 5′-ends. HfqHis6 was added at 0, 55, 110, 220, 330, 440, 550, 660 and 660 nM in lanes 1–9, respectively. A 200-fold molar excess of the same unlabeled probe was added in lane 9 as a specific competitor for RNA binding. Asterisks on right-hand side of each gel denote positions of the shifted bands.
Figure 4.
Figure 4.
Biochemical and genetic characterization of the ntrBC promoter. (A) Identification of NtrC target sites by DNase I footprinting. Lane M, G+A marker; lanes 1–6, NtrCHis6 added at an increasing concentration from 0, 0.07, 0.2, 0.54, 1.1 to 1.7 μM. NtrC-protected regions are indicated by green bars, and hypersensitive residues are marked with filled circles. (B) DNase I analysis showing specific interactions between HutCHis6 and PntrBC promoter. Lane M, G+A marker; lanes 1–6, HutCHis6 added at an increasing amount from 0, 1.16, 2.32, 4.64, 7.54 to 10.44 μM. HutC protected region is marked by a red bar on the right side of the gel image. (C) A schematic map of the PntrBC promoter showing DNA sequences that were protected by NtrC and HutC from DNase I cleavage. The footprinting assays were performed by using the PntrBC-300 probe with a biotin-labeled 3′-end. (D) Sequence logos were generated from separate comparative analysis of PhutU and PntrBC promoter regions across 30 Pseudomonas species. Inverted repeats are marked with arrows. (E) A heat map showing variation in PntrBC promoter activities under different combinations of carbon and nitrogen sources. Bacteria were grown in minimal salt media supplemented with one of the seven C substrates (20 mM) and an amino acid (10 mM) as the sole N source, as indicated in the figure. β-Galactosidase activity was measured at 0, 2, 5 and 8 h after inoculation, but only mean values at 5 h are shown here for clarity. (F) Levels of PntrBC expression in wild type, ΔhutC and ΔntrC backgrounds. Bacteria were grown on succinate (20 mM) plus histidine, urocanate or proline (10 mM). Data are means and standard errors of six independent cultures.
Figure 5.
Figure 5.
C/N homeostatic regulation of hut genes by CbrAB, NtrBC and HutC. When histidine is utilized as a N source, transcription of hut genes is predominantly activated by NtrBC whose expression is autoactivated and involves repression by HutC as a negative feedback loop. HutC thus coordinates the expression of hut genes, hutC itself and the NtrBC activator in a histidine concentration-dependent manner. Utilization of histidine as a C source is subject to succinate-induced CCR control. In succinate-deplete media, CbrAB activates hut transcription while de-repressing the translation of hut mRNA mediated by the Crc/Hfq complex, which is sequestrated by the CbrAB-activated ncRNAs (CrcY and CrcZ). Of note, the CbrA sensor kinase can potentially detect histidine availability (52,54).
Figure 6.
Figure 6.
Role of hutC in determining PntrBC promoter activities and the global profiles of gene expression. (A) PntrBC-lacZ expression in wild type (WT) and three isogenic mutants devoid of hutC and/or cbrB. Data are means and standard errors of three independent cultures on succinate (20 mM) and histidine (10 mM). Two-way ANOVA revealed significant differences between genotypes (F3,8 = 678.6, P < 0.0001). (B) A Venn diagram showing the numbers of DEGs in mutants ΔcbrB, ΔntrC and ΔhutC. Total RNA was prepared from three biological replicates of bacterial cells exponentially grown on succinate (20 mM) and histidine (10 mM). Expression was detected by RNA-seq analysis for ∼97% of the predicted genes in the SBW25 genome.
Figure 7.
Figure 7.
Role of hutC in maintaining PhutU and PntrBC expression in histidine-replete environments. Wild-type and ΔhutC mutant cells were N-starved for 2 hours in minimal salt medium supplemented with 20 mM succinate (A600 = ∼0.1). Bacterial growth started with the addition of histidine at varying concentrations shown in x-axis in a nonlinear scale. β-Galactosidase activities were measured at 5 hours after addition of histidine. Data are means and standard errors of three independent cultures. (A) PhutU promoter activities. Two-way ANOVA revealed a significant interaction between genotype and medium (F9,40 = 99.92, P < 0.0001). Differences between wild type and ΔhutC were highly significant (P < 0.001) in all mediums except 1 mM histidine. (B) PntrBC promoter activities. Two-way ANOVA revealed a significant interaction between genotype and medium (F9,40 = 141.3, P < 0.0001). Multiple t-tests show that differences between genotypes were highly significant (P < 0.001) when histidine was added at 1 mM or above.

Similar articles

Cited by

References

    1. Stock A.M., Robinson V.L., Goudreau P.N.. Two-component signal transduction. Annu. Rev. Biochem. 2000; 69:183–215. - PubMed
    1. Zschiedrich C.P., Keidel V., Szurmant H.. Molecular mechanisms of two-component signal transduction. J. Mol. Biol. 2016; 428:3752–3775. - PMC - PubMed
    1. Igo M.M., Slauch J.M., Silhavy T.J.. Signal transduction in bacteria: kinases that control gene expression. New Biol. 1990; 2:5–9. - PubMed
    1. Groisman E.A. Feedback control of two-component regulatory systems. Annu. Rev. Microbiol. 2016; 70:103–124. - PMC - PubMed
    1. Goulian M. Two-component signaling circuit structure and properties. Curr. Opin. Microbiol. 2010; 13:184–189. - PMC - PubMed

Publication types

MeSH terms