. 2021 Apr 21;109(8):1350-1364.e6.
doi: 10.1016/j.neuron.2021.02.011. Epub 2021 Mar 5.

A transient developmental increase in prefrontal activity alters network maturation and causes cognitive dysfunction in adult mice

Affiliations

A transient developmental increase in prefrontal activity alters network maturation and causes cognitive dysfunction in adult mice

Sebastian H Bitzenhofer et al. Neuron. .

Abstract

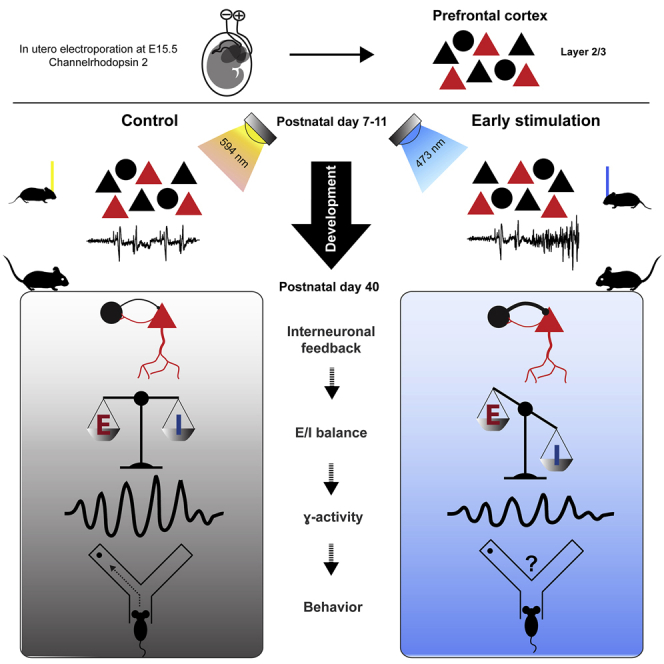
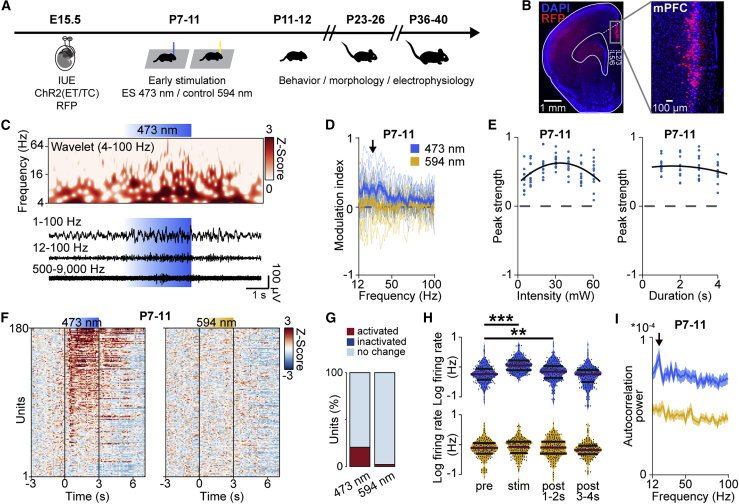
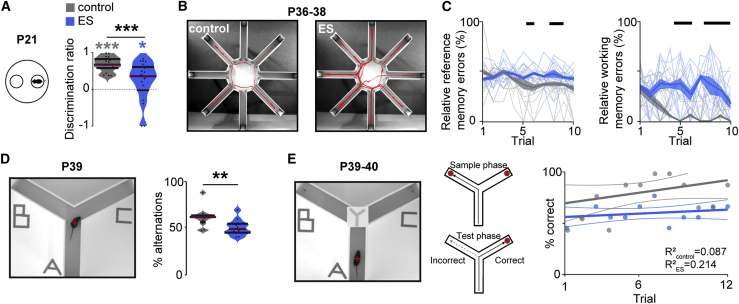
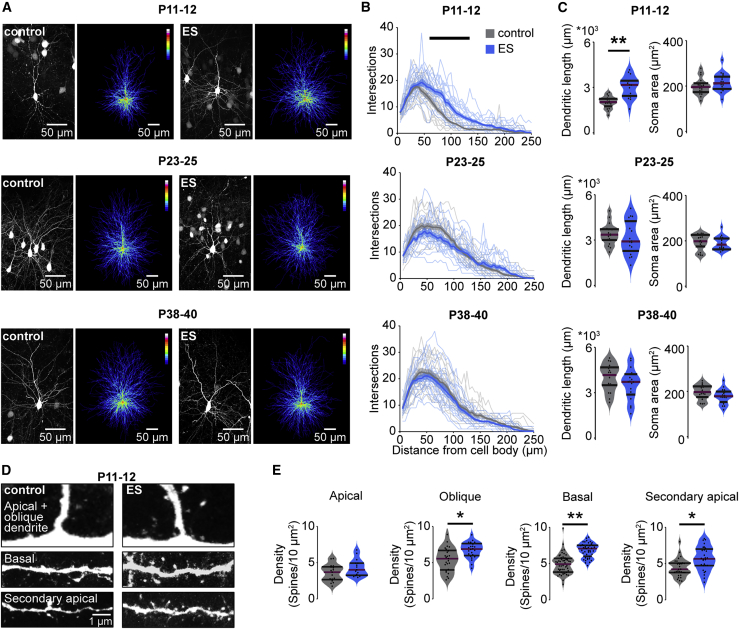
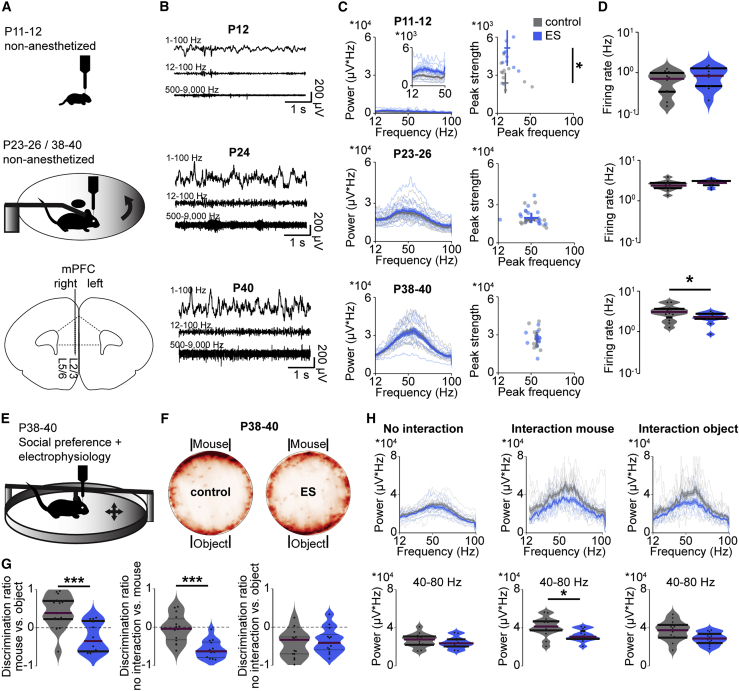
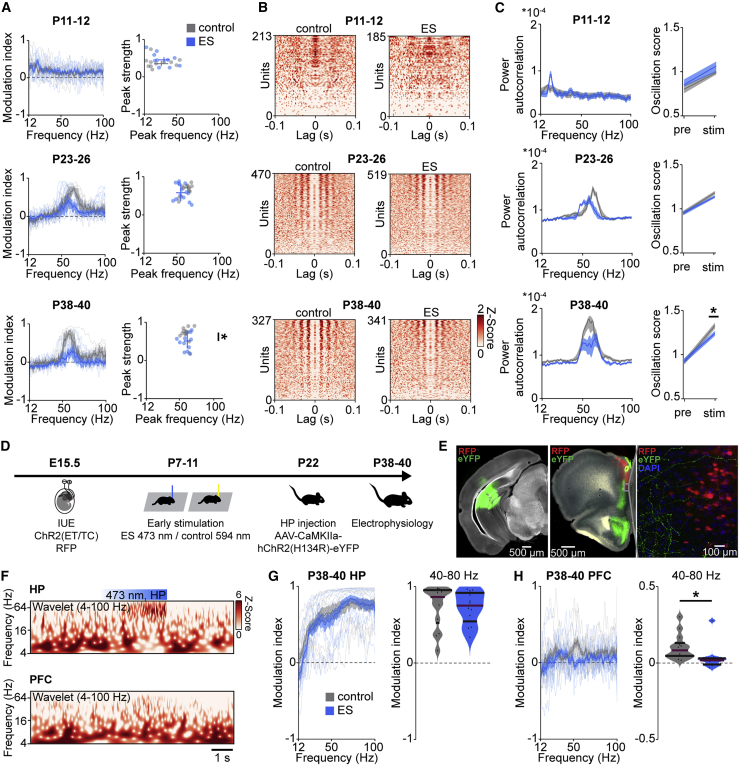
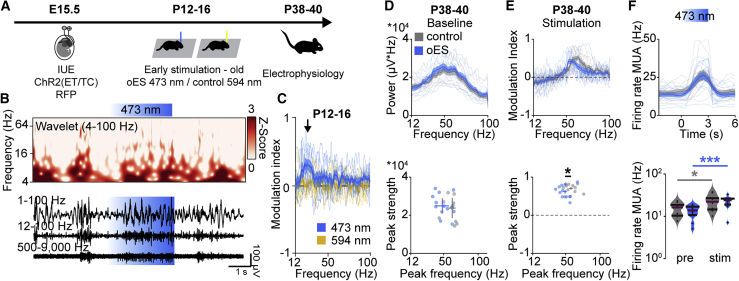
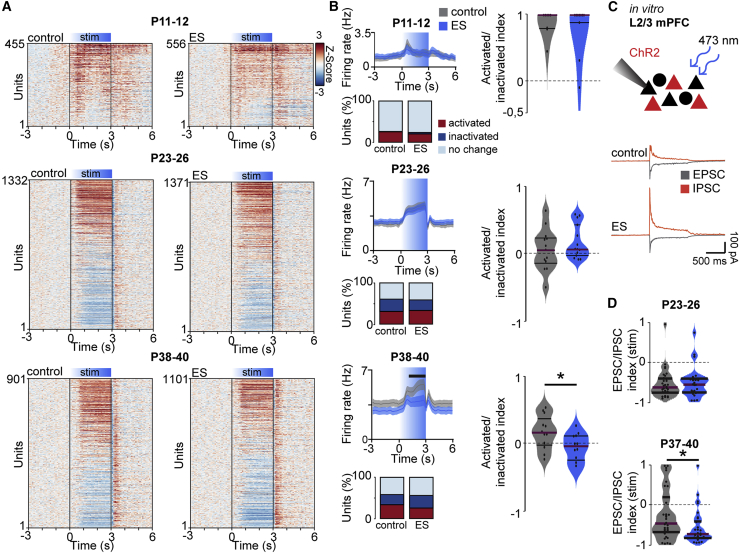
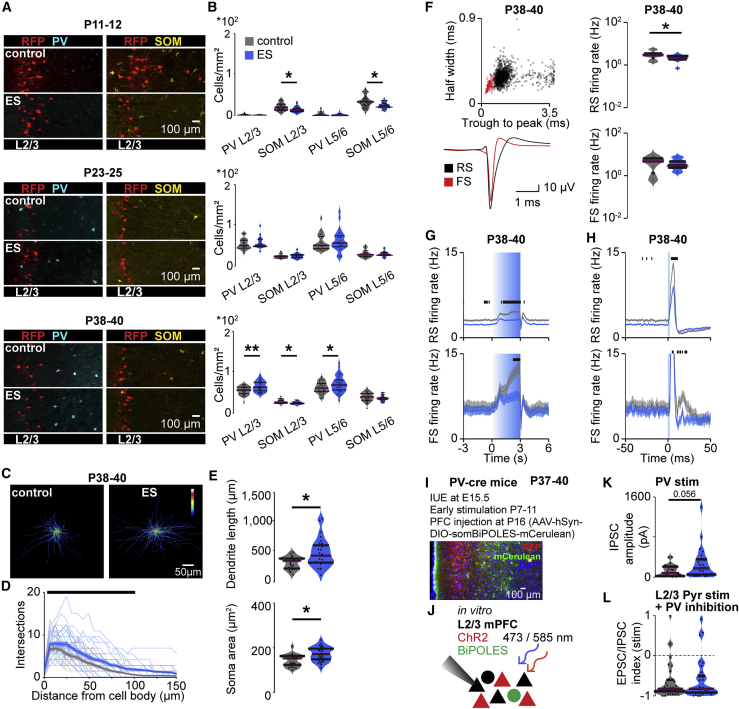
Disturbed neuronal activity in neuropsychiatric pathologies emerges during development and might cause multifold neuronal dysfunction by interfering with apoptosis, dendritic growth, and synapse formation. However, how altered electrical activity early in life affects neuronal function and behavior in adults is unknown. Here, we address this question by transiently increasing the coordinated activity of layer 2/3 pyramidal neurons in the medial prefrontal cortex of neonatal mice and monitoring long-term functional and behavioral consequences. We show that increased activity during early development causes premature maturation of pyramidal neurons and affects interneuronal density. Consequently, altered inhibitory feedback by fast-spiking interneurons and excitation/inhibition imbalance in prefrontal circuits of young adults result in weaker evoked synchronization of gamma frequency. These structural and functional changes ultimately lead to poorer mnemonic and social abilities. Thus, prefrontal activity during early development actively controls the cognitive performance of adults and might be critical for cognitive symptoms in neuropsychiatric diseases.

Keywords: development; excitation/inhibition; gamma oscillations; prefrontal cortex; working memory.


Conflict of interest statement

Declaration of interests The authors declare no competing interests.

Figures

None
Graphical abstract
Figure 1
Figure 1
Light stimulation of L2/3 PYRs in the neonatal mPFC (A) Schematic of the protocol for early light stimulation and long-lasting monitoring of structural, functional, and behavioral effects during development. (B) Representative image showing ChR2(ET/TC)-2A-RFP expression in L2/3 PYRs after IUE at E15.5 in a DAPI-stained coronal slice, including the mPFC, from a P11 mouse. RFP, red fluorescent protein (C) Representative extracellular recording with a corresponding wavelet spectrum at an identical timescale during transcranial ramp light stimulation (473 nm, 3 s) of L2/3 PYRs in the mPFC of a P10 mouse. (D) Modulation index of local field potential (LFP) power in response to ramp light stimulation at 473 nm (blue) and 594 nm (yellow) averaged for P7–P11 mice (n = 13 mice). (E) Peak strength for transcranial ramp light stimulation at different intensities and durations for P7–P11 mice (n = 11 mice). (F) Firing rates of single units (n = 180 units from 13 mice) in response to transcranial ramp light stimulation Z scored to the pre-stimulation period at P7–P11. (G) Percentage of significantly modulated units (p < 0.01) during ramp light stimulation. (H) Average single-unit firing rate in response to ramp light stimulation at 473 nm and 594 nm averaged for P7–P11 mice (n = 180 units from 13 mice). (I) Power of single-unit autocorrelations during ramp light stimulation at 473 nm and 594 nm averaged for P7–P11 mice (n = 180 units from 13 mice). In (D) and (I), data are presented as mean ± SEM. In (H), data are presented as median with 25th and 75th percentiles; the shaded area represents the probability distribution of the variable. Asterisks (p < 0.05, ∗∗p < 0.01, ∗∗∗p < 0.001) indicate significant differences. See also Figure S1 and Table S1 for detailed statistics.
Figure 2
Figure 2
Transient ES impairs the cognitive abilities of juvenile and young adult mice (A) Schematic of the maternal interaction task and violin plot displaying the discrimination ratio of interaction time with the mother versus empty bin for control (n = 19) and ES (n = 21) mice at P21 (Wilcoxon rank; control, p < 0.001; ES, p = 0.045; control ES, p < 0.001). (B) Representative tracking of a control (left) and an ES mouse (right) in an 8-arm radial maze memory task with 4 baited arms at P36–P38. (C) Plots displaying the relative reference (left) and working-memory errors (right) in the 8-arm radial maze memory task over 10 trials on 3 consecutive days for control (n = 12) and ES (n = 12) mice. (Kruskal-Wallis; relative reference memory errors, p < 0.001; relative working memory errors, p < 0.001). (D) Photograph illustrating a spontaneous alternation task in a Y maze (left) and violin plot displaying the percentage of spontaneous alternations (right) for control (n = 12) and ES (n = 12) mice at P39. (Wilcoxon rank, p = 0.006). (E) Photograph illustrating a delayed non-match-to-sample task in a Y maze (left) and dot plot displaying the percentage of correct choices over 12 consecutive trials (6 trials/day) (right) for control (n = 12) and ES (n = 12) mice at P39–P40. In (A) and (D), data are presented as median with 25th and 75th percentiles; the shaded area represents the probability distribution of the variable. In (C), data are presented as median ± median absolute deviation (MAD). Black lines and asterisks (p < 0.05, ∗∗p < 0.01, ∗∗∗p < 0.001) indicate significant differences. See also Figure S2 and Tables S1 and S2 for detailed statistics.
Figure 3
Figure 3
Transient ES induces premature dendritic growth in prefrontal L2/3 PYRs (A) Representative photographs and corresponding average heatmaps of ChR2(ET/TC)-transfected L2/3 PYRs in the mPFC of P11–P12, P23–P25 and P38–P40 control (left) and ES mice (right). (B) Line plots of dendritic intersections of L2/3 PYRs with concentric circles (0- to 250-μm radius) centered around the soma, averaged for control (18 cells of 3 mice/age group) and ES mice (18 cells of 3 mice/age group) at P11–P12, P23–P25, and P38–P40 (LMEM; P11–P12, p < 0.001; P23–P25, p < 0.001; P38–P40, p < 0.001). (C) Violin plots displaying the dendritic length and soma area of L2/3 PYRs for control (18 cells from 3 mice/age group) and ES (18 cells from 3 mice/age group) mice for different age groups (LMEM; dendritic length: P11–P12, p = 0.007; P23–P25 p = 0.631; P38–P40, p = 0.161). (D) Representative photographs of dendritic segments of ChR2(ET/TC)-transfected L2/3 PYRs in the mPFC of P11–P12 mice. (E) Violin plots of dendritic spine density for control (124 dendrites, 17 cells, 3 mice) and ES mice (110 dendrites, 15 cells, 3 mice) at P11–P12 (LMEM; apical, p = 0.106; oblique, p = 0.013; basal, p = 0.001; secondary apical, p = 0.016). In (B), data are presented as mean ± SEM. In (C) and (E), data are presented as median with 25th and 75th percentiles; the shaded area represents the probability distribution of the variable. Black lines and asterisks (p < 0.05, ∗∗p < 0.01, ∗∗∗p < 0.001) indicate significant differences. See Table S1 for detailed statistics. Black lines and asterisks (p < 0.05, ∗∗p < 0.01, ∗∗∗p < 0.001) indicate significant differences. See also Figure S3 and Table S1 for detailed statistics.
Figure 4
Figure 4
Transient ES has minor effects on spontaneous network activity but impairs task-related gamma oscillations in the mPFC (A) Top: schematic illustrating the recording setups used for young mice with limited motor abilities (head fixed, no movement) and for juvenile and young adult mice (head fixed, moving freely on a spinning disk). Bottom: schematic of the recording configuration in the developing mPFC. (B) Representative extracellular recordings in the mPFC at P12, P24, and P40. (C) Left: average power spectra of spontaneous network activity in the mPFC of control and ES mice at P11–P12 (control, n = 11 recordings, 11 mice; ES, n = 10 recordings, 10 mice; inset at a different scale), P23–P26 (control, n = 13 recordings, 6 mice; ES, n = 14 recordings, 5 mice), and P38–P40 (control, n = 12 recordings, 5 mice; ES, n = 12 recordings, 5 mice). Right: scatterplots displaying peak strength and peak frequency of LFP power for control and ES mice (Wilcoxon rank, P11–P12, peak frequency p = 0.245, peak strength p = 0.015, LMEM, P23–P26, peak frequency p = 0.643, peak strength p = 0.665, P38–P40, peak frequency p = 0.856, peak strength p = 0.750). (D) Violin plots displaying the firing rates of single units in the mPFC, averaged for control and ES mice at P11–P12, P23–P26, and P38–P40. (Wilcoxon rank, P11–P12 p = 0.275, LMEM, P23–P25 p = 0.072, P38–P40 p = 0.041). (E) Schematic illustrating the setup used for in vivo extracellular recordings in P38–P40 mice during a social preference task in a mobile home cage. (F) Heatmaps showing the preferred position of control (15 trials of 8 mice) and ES mice (13 trials of 7 mice) during a social preference task in a mobile home cage (15-min duration). (G) Violin plots displaying the discrimination ratio of mouse versus object (LMEM, p < 0.001), no interaction versus mouse (LMEM, p < 0.001), and no interaction versus object (LMEM, p = 0.492) for control (15 trials of 8 mice) and ES mice (13 trials of 7 mice). (H) Average power spectra of network activity in the mPFC (top) and power in the gamma frequency (bottom, 40–80 Hz) of control (14 recordings from 8 mice) and ES (12 recordings from 7 mice) mice at P38–P40 in the mobile home cage during no interaction (LMEM, p = 0.353), interaction with another mouse (LMEM, p = 0.019) and interaction with an object (LMEM, p = 0.052). In (C) and (H) data are presented as mean ± SEM. In (D), (G), and (H), data are presented as median with 25th and 75th percentiles; the shaded area represents the probability distribution of the variable. Asterisks (p < 0.05, ∗∗p < 0.01, ∗∗∗p < 0.001) indicate significant differences. See Table S1 for detailed statistics.
Figure 5
Figure 5
Transient ES decreases evoked network and neuronal gamma rhythmicity in the adult mPFC (A) Left: modulation index of LFP power in response to acute ramp light stimulation (473 nm, 3 s) for control and ES mice at P11–P12 (control, n = 11 recordings, 11 mice; ES, n = 10 recordings, 10 mice), P23–P26 (control, n = 13 recordings, 6 mice; ES n = 14 recordings, 15 mice) and P38–P40 (control, n = 12 recordings, 5 mice; ES, n = 12 recordings, 5 mice). Right: scatterplots displaying the peak strength and peak frequency of the power modulation index for control and ES mice (Wilcoxon rank, P11–P12, peak frequency p = 0.307, peak strength p = 0.307, LMEM, P23–P26, peak frequency p = 0.136, peak strength p = 0.419, P38–P40, peak frequency p = 0.913, peak strength p = 0.043). (B) Z-scored autocorrelograms of single units during acute ramp light stimulation, arranged by magnitude for control and ES mice at P11–P12 (control, n = 213 units, 11 mice; ES, n = 185 units, 10 mice), P23–P26 (control, n = 470 units, 6 mice; ES, n = 519 units, 5 mice), and P38–P40 (control, n = 327 units, 5 mice; ES, n = 341 units, 5 mice). (C) Left: average power of single-unit autocorrelograms during acute ramp light stimulation for control and ES mice at different ages. Right: oscillation score of single units before (pre) and during (stim) acute ramp light stimulation (LMEM, oscillation score, P11–P12, pre p = 0.406, stim p = 0.156, P23–P26, pre p = 0.272, stim p = 0.478, P38–P40, pre p = 0.428, stim p = 0.030). (D) Schematic of the protocol for early light stimulation and hippocampal ChR2 transfection. (E) Representative image showing ChR2(ET/TC)-2A-RFP expression in L2/3 PYRs after IUE at E15.5 and ChR2(H134R)-eYFP expression after hippocampal injection at P22 in a DAPI-stained coronal slice, including the mPFC from a P40 mouse. Note the hippocampal axons in the mPFC, visible at high exposure and magnification. eYFP, enhanced yellow fluorescent protein. (F) Representative wavelet spectra of extracellular recordings in the HP and mPFC at identical timescales during ramp light stimulation (473 nm, 3 s) in the HP of a P39 mouse. (G) Left: modulation index of hippocampal LFP power in response to hippocampal ramp light stimulation at 473 nm (blue), averaged for P38–P40 control (13 recordings from 6 mice) and ES mice (n = 12 recordings from 5 mice). Right: average modulation index of hippocampal LFP power in the gamma frequency (40–80 Hz) upon hippocampal ramp stimulation at P38–P40 (LMEM, p = 0.846). (H) Left: modulation index of prefrontal LFP power in response to hippocampal ramp light stimulation at 473 nm (blue), averaged for P38–P40 control (13 recordings from 6 mice) and ES mice (n = 12 recordings from 5 mice). Right: average modulation index of prefontal LFP power in the gamma frequency (40–80 Hz) upon hippocampal ramp stimulation at P38–P40 (LMEM, p = 0.0328). In (A); (C); (G), left; and (H), left, data are presented as mean ± SEM. In (G), right, and (H), right, data are presented as median with 25th and 75th percentiles; the shaded area represents the probability distribution of the variable. Asterisks (p < 0.05, ∗∗p < 0.01, ∗∗∗p < 0.001) indicate significant differences. See also Figures S4 and S5 and Table S1 for detailed statistics.
Figure 6
Figure 6
Transient ES at P12–P16 weakly affects activity in the adult mPFC (A) Schematic of the protocol for early light stimulation at P12–P16. (B) Representative extracellular recording with the corresponding wavelet spectrum at an identical timescale during transcranial ramp light stimulation (473 nm, 3 s) of L2/3 PYRs in the mPFC of a P16 mouse. (C) Modulation index of LFP power in response to ramp light stimulation at 473 nm (blue) and 594 nm (yellow), averaged for P12–P16 mice (n = 8 mice). (D) Top: average power spectra of spontaneous network activity in the mPFC of control and oES mice at P38–P40 (control, n = 11 recordings, 5 mice; oES n = 12 recordings, 6 mice). Bottom, scatterplot displaying peak strength and peak frequency of LFP power for control and oES mice. (LMEM, peak frequency p = 0.073, peak strength p = 0.250). (E) Top: modulation index of LFP power in response to acute ramp light stimulation (473 nm, 3 s) for control and oES mice at P38–P40 (control, n = 11 recordings, 5 mice; oES, n = 12 recordings, 6 mice). Bottom: scatterplots displaying the peak strength and peak frequency of the power modulation index for control and oES mice (LMEM; peak frequency, p = 0.025; peak strength, p = 0.217). (F) Top: MUA in response to acute ramp light stimulation (473 nm, 3 s) for control and oES mice at P38–P40 (control, n = 11 recordings, 5 mice; oES, n = 12 recordings, 6 mice). Bottom: MUA firing rate before (pre) and during (stim) acute ramp light stimulation for control and oES mice (LMEM; control pre versus stim, p = 0.018; control pre versus stim, p < 0.001; pre control versus oES, p = 0.364; stim control versus oES, p = 0.922). In (C)–(F), top, data are presented as mean ± SEM. In (F), bottom, data are presented as median with 25th and 75th percentiles; the shaded area represents the probability distribution of the variable. Asterisks (p < 0.05, ∗∗p < 0.01, ∗∗∗p < 0.001) indicate significant differences. See also Figure S6 and Table S1 for detailed statistics.
Figure 7
Figure 7
Transient ES alters the excitation/inhibition balance in the adult mPFC during acute light stimulation (A) Single unit firing rates Z scored to pre-stimulation in response to acute ramp light stimulation (473 nm, 3 s) displayed for control (left) and ES mice (right) at P11–P12 (control, n = 455 units, 11 mice; ES, n = 556 units, 10 mice), P23–P26 (control, n = 1,332 units, 6 mice; ES, n = 1,371 units, 5 mice), and P38–P40 (control, n = 901 units, 5 mice; ES, n = 1,101 units, 5 mice). (B) Line plots displaying average firing rates during acute light stimulation (top left), bar diagrams of the percentage of significantly activated and inactivated units (p < 0.01, bottom left), and violin plots showing the index of significantly activated versus inactivated units (right) for control and ES mice at P11–P12, P23–P26, and P38–P40 (P11–P12, LMEM, firing rate p < 0.001, Wilcoxon rank, activated/inactivated index p = 0.982, LMEM, P23–26, firing rate p = 0.004, activated/inactivated index p = 0.317, P38–P40, firing rate p < 0.001, activated/inactivated index p = 0.033). (C) Schematic showing the protocol for in vitro whole-cell patch-clamp recordings from non-transfected L2/3 PYRs (black) during optogenetic stimulation of neighboring transfected cells (red) in the mPFC and representative examples. (D) Violin plots displaying the EPSC/IPSC index during acute light stimulation (473 nm, square pulse, 1 s) for control and ES mice at P23–P26 (control, n = 35 neurons, 5 mice; ES, n = 30 neurons, 5 mice) and P37–P40 (control, n = 41 neurons, 6 mice; ES, n = 33 neurons, 4 mice) (LMEM; P23–P26, p = 0.840; P37–P40, p = 0.030). In (B), left, data are presented as mean ± SEM. In (B), right, and (D), data are presented as median with 25th and 75th percentiles; the shaded area represents the probability distribution of the variable. Black lines and asterisks (p < 0.05, ∗∗p < 0.01, ∗∗∗p < 0.001) indicate significant differences. See also Figure S7 and Table S1 for detailed statistics.
Figure 8
Figure 8
Transient ES alters inhibitory feedback from FS units in the mPFC (A) Representative images showing PV and SOM immunostaining in the mPFC of control and ES mice at P11–P12, P23–P25, and P38–P40. (B) Violin plots displaying the density of PV-positive and SOM-positive neurons in L2/3 and L5/6 of the mPFC of control and ES mice at P11–P12 (control: PV n = 54 slices, 12 mice; SOM n = 59 slices, 12 mice; ES: PV n = 38 slices, 9 mice; SOM n = 43 slices, 9 mice), P23–P25 (control: PV n = 25 slices, 5 mice; SOM n = 25 slices, 5 mice; ES: PV n = 27 slices, 6 mice; SOM n = 25 slices, 6 mice), and P38–P40 (control: PV n = 36 slices, 9 mice; SOM n = 36 slices, 9 mice; ES: PV n = 40 slices, 10 mice; SOM n = 43 slices, 11 mice) (LMEM, L2/3, P11–P12, PV p = 0.296, SOM p = 0.044, P23–P25, PV p = 0.403, SOM p = 0.390, P38–P40, PV p = 0.012, SOM p = 0.012). (C) Average heatmaps of PV interneurons in the mPFC of P38–P40 control (left) and ES mice (right). (D) Line plots of dendritic intersections of PV interneurons with concentric circles (0–150 μm radius) centered around the soma averaged for control (23 cells of 3 mice) and ES mice (28 cells of 3 mice) at P38–P40 (LMEM p < 0.001). (E) Violin plots displaying the dendritic length and soma area of PV interneurons for control (23 cells of 3 mice) and ES mice (28 cells of 3 mice) at P38–P40 (LMEM; dendritic length, p = 0.016). (F) Scatterplots displaying half-width and trough-to-peak duration (top left) and average waveforms for RS and FS units (bottom) as well as violin plots displaying average firing rates (right) for control and ES mice at P38–P40 (control, 814 RS and 84 FS units, 5 mice; ES, 992 RS and 104 FS units, 5 mice) (Wilcoxon rank, P38–P40, RS firing rate p = 0.040, FS firing rate p = 0.575). (G) Average firing rate during acute ramp light stimulation (473 nm, 3 s) for control and ES mice at P38–P40. (LMEM, P38–P40, RS firing rate p < 0.001, FS firing rate p < 0.001). (H) Average firing rate during acute pulse light stimulation (473 nm, 3 ms) for control and ES mice at P38–P40. (LMEM, P38–P40, RS firing rate p < 0.001, FS firing rate p < 0.001). (I) Representative image of a P37 mouse showing L2/3 PYRs ChR2(ET/TC)-2A-RFP expression from IUE and BiPOLES-mCerulean expression in PV interneurons after viral injection at P16 into the mPFC. (J) Schematic showing the protocol for in vitro whole-cell patch-clamp recordings from non-transfected L2/3 PYRs (black) during optogenetic stimulation of neighboring transfected PYRs (red) and/or PV interneurons (green) in the mPFC. (K) Violin plot displaying IPSC amplitude in response to acute light stimulation of PV interneurons (595 nm, square pulse, 10 ms) for control and ES mice at P37–P40 (control, n = 32 neurons, 6 mice; ES, n = 31 neurons, 5 mice) (LMEM, p = 0.056). (L) Violin plot displaying the EPSC/IPSC index during acute light stimulation of L2/3 PYRs and inhibition of PV interneurons (473 nm, square pulse, 1 s) for control and ES mice at P37–P40 (control, n = 35 neurons, 6 mice; ES: n = 30 neurons, 5 mice) (LMEM, p = 0.785). In (B), (E), (F), (K), and (L), data are presented as median with 25th and 75th percentiles; the shaded area represents the probability distribution of the variable. In (D), (G), and (H), data are presented as mean ± SEM. Black lines and asterisks (p < 0.05, ∗∗p < 0.01, ∗∗∗p < 0.001) indicate significant differences. See also Figure S8 and Table S1 for detailed statistics.

Comment in

Similar articles

Cited by

References

    1. Ahlbeck J., Song L., Chini M., Bitzenhofer S.H., Hanganu-Opatz I.L. Glutamatergic drive along the septo-temporal axis of hippocampus boosts prelimbic oscillations in the neonatal mouse. eLife. 2018;7:e33158. - PMC - PubMed
    1. Anastasiades P.G., Butt S.J.B. A role for silent synapses in the development of the pathway from layer 2/3 to 5 pyramidal cells in the neocortex. J. Neurosci. 2012;32:13085–13099. - PMC - PubMed
    1. Atallah B.V., Scanziani M. Instantaneous modulation of gamma oscillation frequency by balancing excitation with inhibition. Neuron. 2009;62:566–577. - PMC - PubMed
    1. Barker G.R.I., Warburton E.C. When is the hippocampus involved in recognition memory? J. Neurosci. 2011;31:10721–10731. - PMC - PubMed
    1. Baron-Cohen S. The cognitive neuroscience of autism. J. Neurol. Neurosurg. Psychiatry. 2004;75:945–948. - PMC - PubMed

Publication types

LinkOut - more resources