. 2021 May 6;28(5):923-937.e4.
doi: 10.1016/j.stem.2021.02.009. Epub 2021 Mar 5.

In vivo reprogramming of NG2 glia enables adult neurogenesis and functional recovery following spinal cord injury

Affiliations

In vivo reprogramming of NG2 glia enables adult neurogenesis and functional recovery following spinal cord injury

Wenjiao Tai et al. Cell Stem Cell. .

Abstract

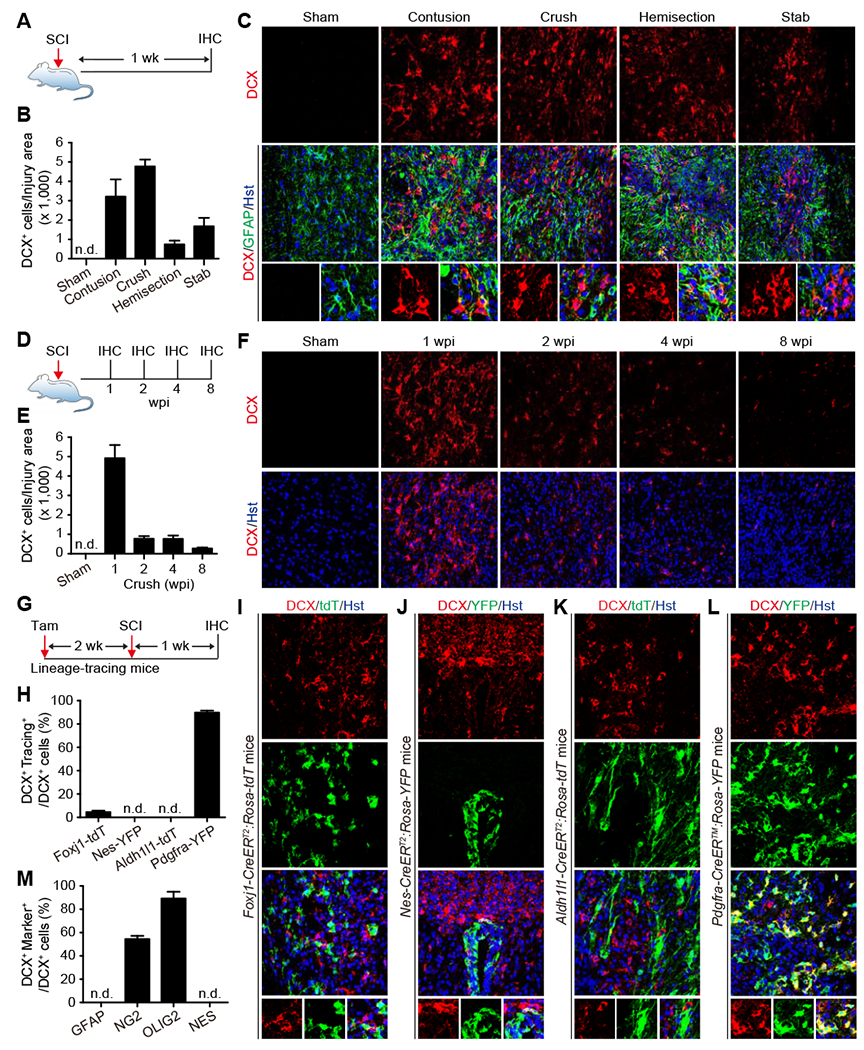
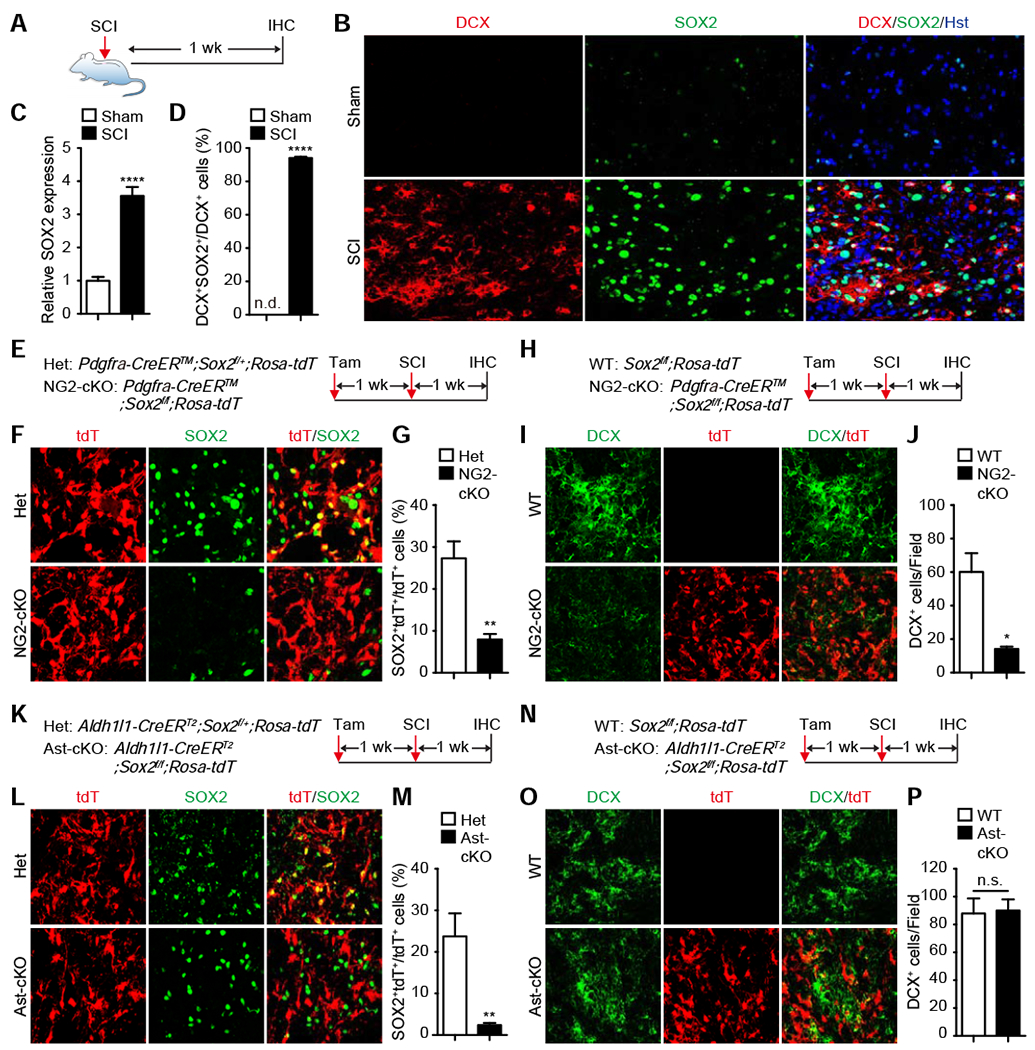
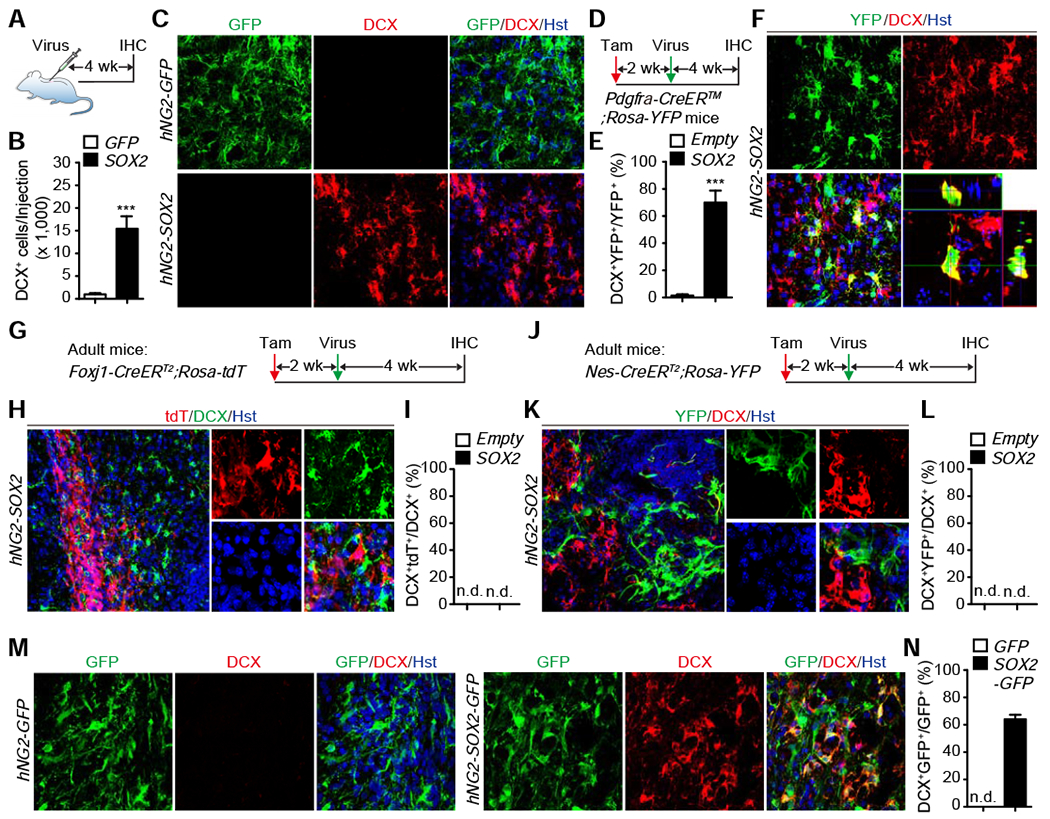
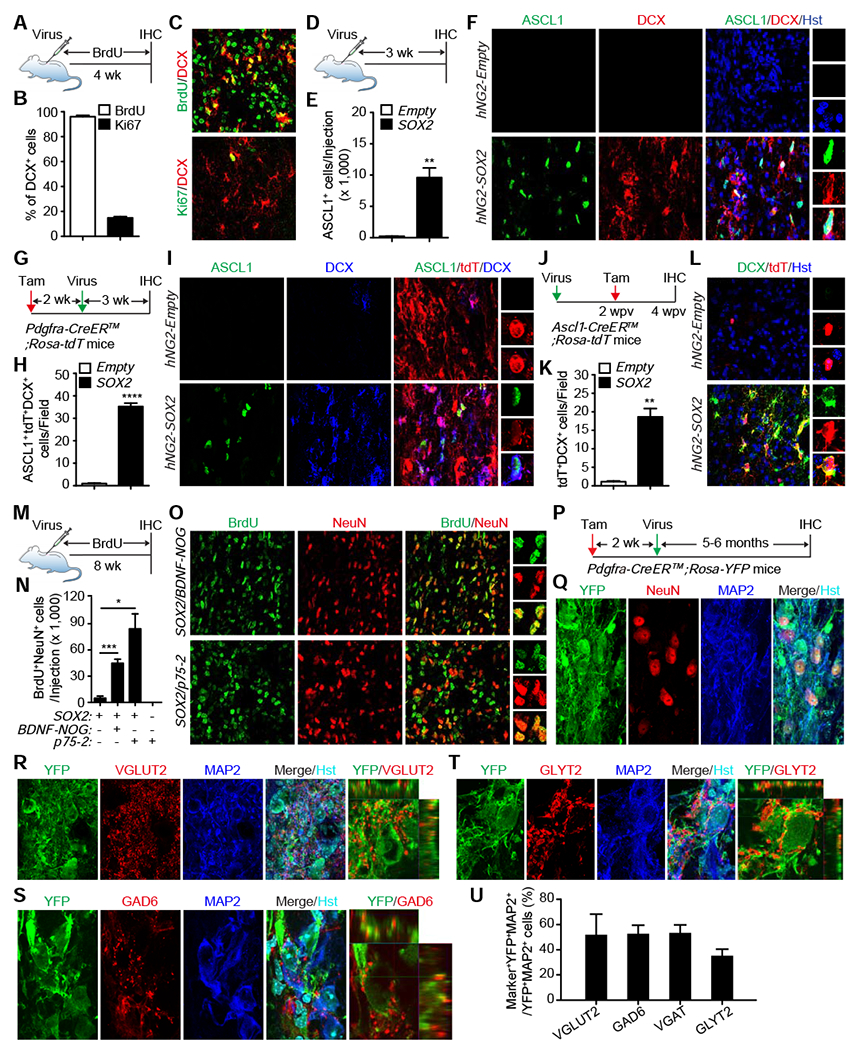
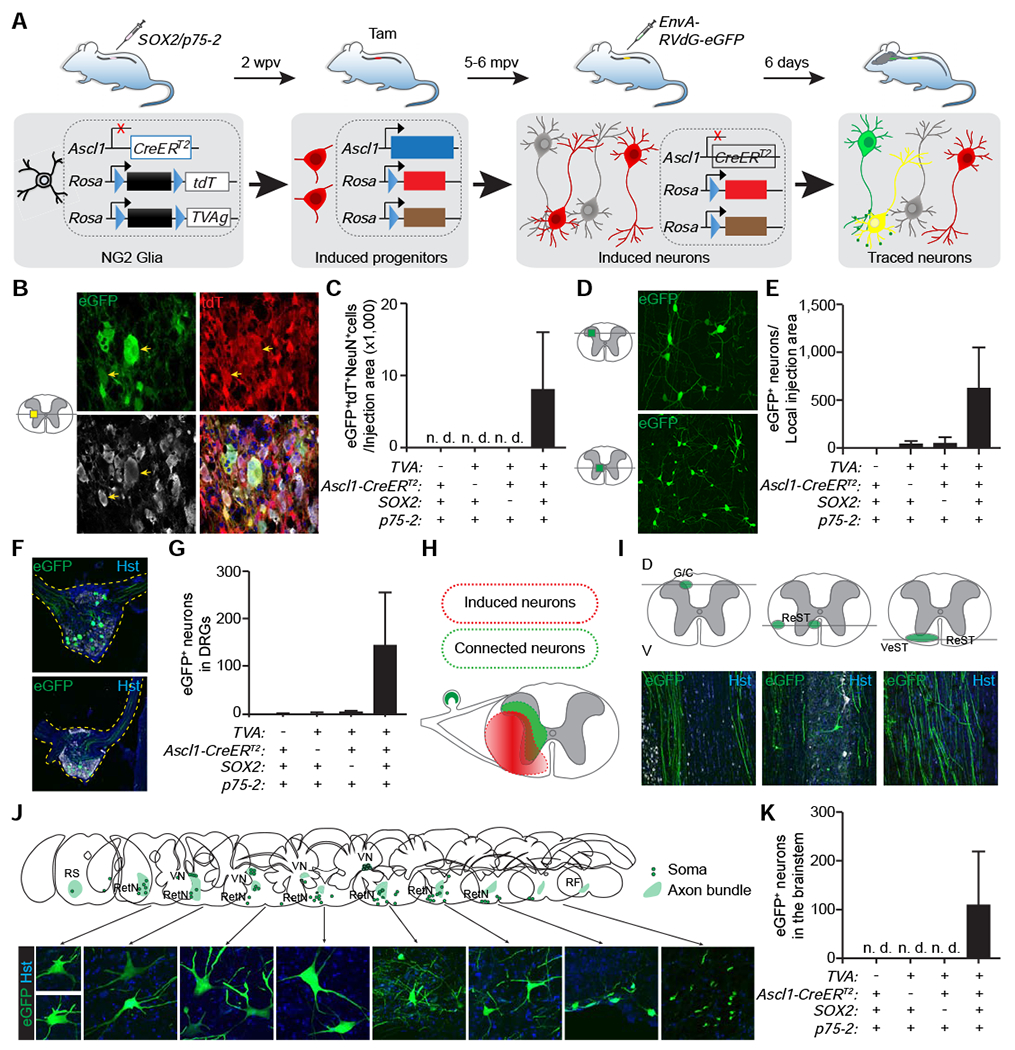
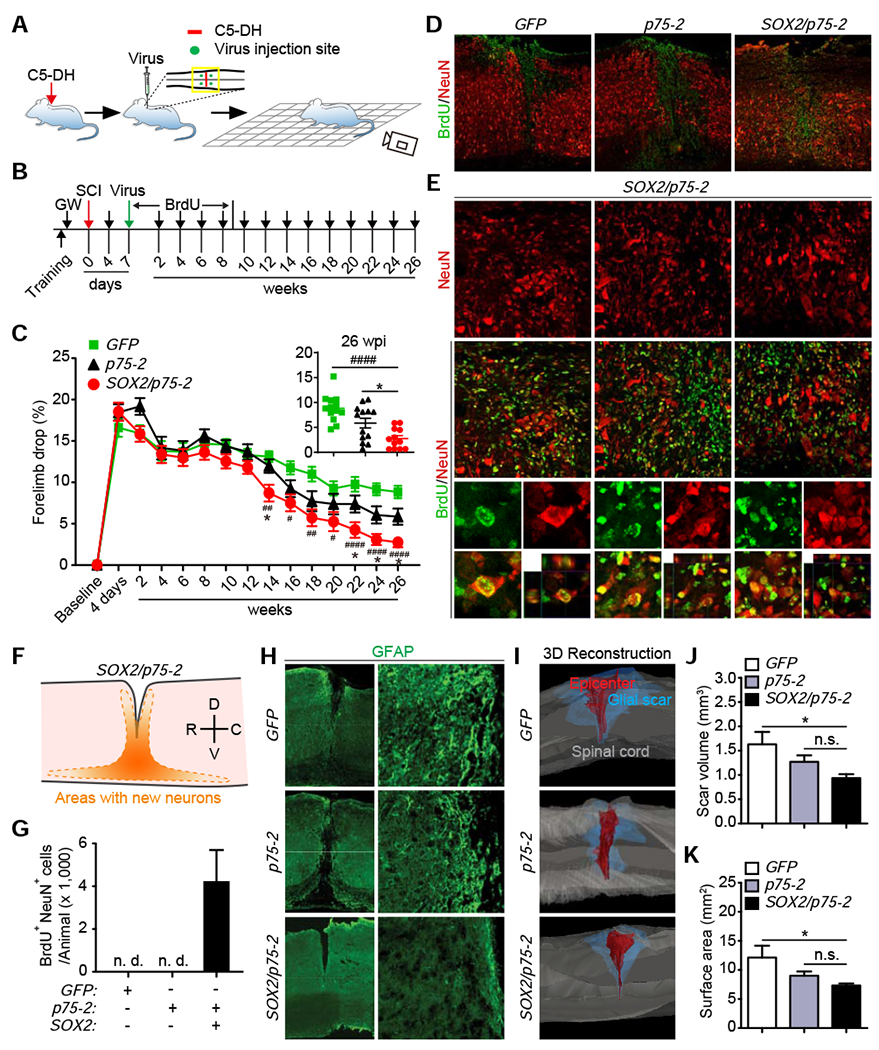
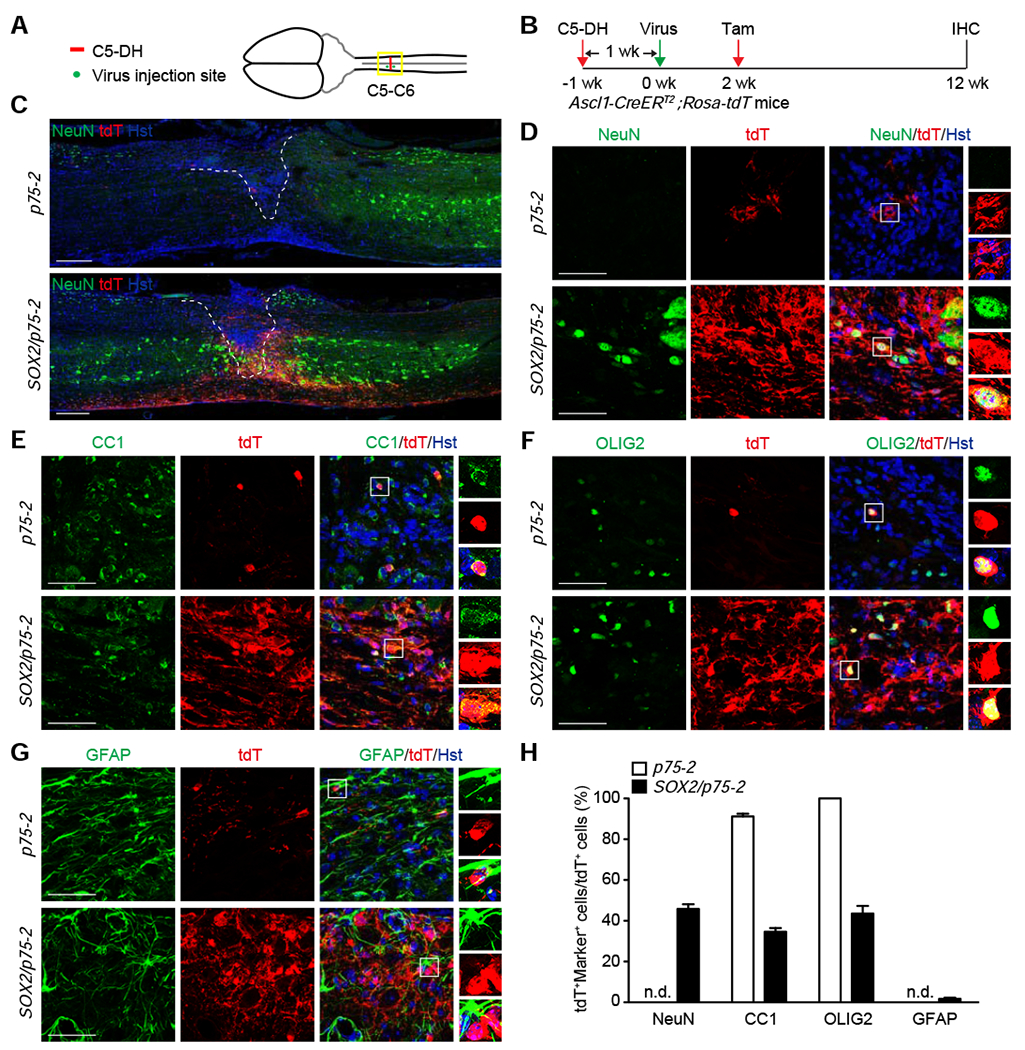
Adult neurogenesis plays critical roles in maintaining brain homeostasis and responding to neurogenic insults. However, the adult mammalian spinal cord lacks an intrinsic capacity for neurogenesis. Here we show that spinal cord injury (SCI) unveils a latent neurogenic potential of NG2+ glial cells, which can be exploited to produce new neurons and promote functional recovery after SCI. Although endogenous SOX2 is required for SCI-induced transient reprogramming, ectopic SOX2 expression is necessary and sufficient to unleash the full neurogenic potential of NG2 glia. Ectopic SOX2-induced neurogenesis proceeds through an expandable ASCL1+ progenitor stage and generates excitatory and inhibitory propriospinal neurons, which make synaptic connections with ascending and descending spinal pathways. Importantly, SOX2-mediated reprogramming of NG2 glia reduces glial scarring and promotes functional recovery after SCI. These results reveal a latent neurogenic potential of somatic glial cells, which can be leveraged for regenerative medicine.

Keywords: NG2 glia; SOX2; adult neurogenesis; astrocytes; ependymal cells; glial scar; in vivo reprogramming; lineage tracing; monosynaptic connections; spinal cord injury.


Conflict of interest statement

Declaration of interests The authors declare no competing interests.

Figures

Figure 1.
Figure 1.. SCI-induced neurogenic reprogramming of NG2 glia.
(A) Experimental design for SCI-induced DCX+ cells. IHC, immunohistochemistry; wk, week. (B) Quantification of DCX+ cells induced by the indicated injury types (mean ± SEM; n=3 mice per condition). n.d., not detected. (C) Confocal images of injury-induced DCX+ cells at one week post injury (wpi) in the adult mouse spinal cord. Enlarged views of the boxed regions are shown in the bottom panels. GFAP expression shows lesion areas. Nuclei are counterstained with Hoechst 33342 (Hst). Scale bars, 50 μm. (D) Experimental design for time-course analysis of SCI-induced DCX+ cells. (E) Quantification of crush-induced DCX+ cells at the indicated time-points (mean ± SEM; n=4-5 mice per time-point). (F) Confocal images of crush-induced DCX+ cells through a time-course. Scale bars, 50 μm. (G) Experimental design for genetic lineage tracings of SCI-induced DCX+ cells. Tam, tamoxifen. (H) Quantification of genetically traced DCX+ cells at 1 wpi (mean ± SEM; n=3-7 mice per group). (I) Lineage tracings showing SCI-induced DCX+ cells rarely originate from ependymal cells. An enlarged view of the boxed region is shown in the bottom panel. tdT is pseudocolored as green. Scale bars, 50 μm. (J) Lineage tracings showing SCI-induced DCX+ cells do not come from NES+ cells located in the central canal. An enlarged view of the boxed region is shown in the bottom panel. Scale bars, 50 μm. (K) lineage tracings showing SCI-induced DCX+ cells do not originate from resident astrocytes. An enlarged view of the boxed region is shown in the bottom panel. tdT is pseudocolored as green. Scale bars, 50 μm. (L) lineage tracings showing SCI-induced DCX+ cells largely originate from NG2 glia. An enlarged view of the boxed region is shown in the bottom panel. Scale bars, 50 μm. (M) Percentage of SCI-induced DCX+ cells expressing the indicated markers (mean ± SEM; n=3 mice per group). See also Figure S1.
Figure 2.
Figure 2.. Cell-autonomous requirement of SOX2 for SCI-induced reprogramming of NG2 glia.
(A) Experimental design for analyzing SOX2 expression in SCI-induced DCX+ cells. (B) Confocal images showing SOX2 expression in SCI-induced DCX+ cells. Scale bars, 50 μm. (C) Quantification of relative SOX2 expression (mean ± SEM; n=6 mice per group; ****p<0.0001 by t-test). (D) Percentage of DCX+ cells with SOX2 co-expression (mean ± SEM; n=6 mice per group; ****p<0.0001 by t-test). (E) Experimental design for inducible deletion of Sox2 in NG2 glia (NG2-cKO). Het, heterozygotes. (F) Confocal images showing inducible deletion of SOX2. Scale bars, 50 μm. (g) Quantification of Sox2-deleted NG2 glia (mean ± SEM; n=4 mice per group; **p=0.0039 by t-test). (H) Experimental design for inducible deletion of Sox2 in NG2 glia. (I) Confocal images showing SCI-induced DCX+ cells in the indicated mouse spinal cord. Scale bars, 50 μm. (J) Quantification of SCI-induced DCX+ cells in the indicated mouse spinal cords (mean ± SEM; n=3 mice per group; *p=0.0151 by t-test). (K) Experimental design for inducible deletion of Sox2 in astrocytes (Ast-cKO). (L) Confocal images showing inducible deletion of Sox2 in astrocytes. Scale bars, 50 μm. (M) Quantification of Sox2-deleted astrocytes (mean ± SEM; n=6 mice per group; **p=0.0033 by t-test). (N) Experimental design for inducible deletion of Sox2 in astrocytes. (O) Confocal images showing SCI-induced DCX+ cells in the indicate mouse spinal cord. Scale bars, 50 μm. (P) Quantification of SCI-induced DCX+ cells in the indicated mouse spinal cords (mean ± SEM; n=6 mice per group; n.s., not significant). See also Figure S2.
Figure 3.
Figure 3.. Elevated SOX2 is sufficient to drive neurogenic reprogramming of NG2 glia.
(A) Experimental design for analyzing SOX2-induced DCX+ cells in NG2 glia. (B) Quantification of SOX2-induced DCX+ cells at 4 wpv (mean ± SEM; n=5 mice per group; ***p=0.0008 by t-test; wpv: weeks post virus-injections). (C) Confocal images showing DCX+ cells induced by ectopic SOX2 in NG2 glia at 4 wpv. Scale bars, 50 μm. (D) Experimental design to genetically trace NG2 glia-derived cells. (E) Percentage of genetically traced cells converted into DCX+ cells at 4 wpv around the injection area (mean ± SEM; n=4 mice per group; ***p=0.0003 by t-test). (F) Confocal images showing an origin of NG2 glia of SOX2-induced DCX+ cells. An orthogonal view of the boxed region is shown on the right. Scale bar, 50 μm. (G) Experimental design to genetically trace derivatives of ependymal cells. (H) Confocal images showing a non-ependymal cell origin of SOX2-induced DCX+ cells. An enlarged view of the boxed region is shown on the right. Scale bars, 50 μm. (I) Percentage of SOX2-induced DCX+ cells from genetically traced ependymal cells at 4 wpv (n=3-7 mice per group). (J) Experimental design to genetically trace derivatives of cells lining the central canal. (K) Confocal images showing a non-central canal cell origin of SOX2-induced DCX+ cells. An enlarged view of the boxed region is shown on the right. Scale bars, 50 μm. (L) Percentage of SOX2-induced DCX+ cells from genetically traced central canal cells at 4 wpv (n=3-4 mice per group). (M) Confocal images showing reprogramming efficiency by SOX2 in NG2 glia. Scale bars, 50 μm. (N) Quantification of reprogramming efficiency at 4 wpv (mean ± SEM; n=5 mice per group). See also Figure S3.
Figure 4.
Figure 4.. Ectopic SOX2 reprograms NG2 glia into mature neurons.
(A) Experimental design to determine proliferation of SOX2-induced DCX+ cells. (B) Percentage of SOX2-induced DCX+ cells going through proliferation (mean ± SEM; n=5 mice per group). (C) Confocal images showing proliferation of SOX2-induced DCX+ cells at 4 wpv. Scale bars, 50 μm. (D) Experimental design for analyzing ASCL1+ progenitors. (E) Quantification of virus-induced ASCL1+ progenitors at 3 wpv (mean ± SEM; n=3 mice per group; **p=0.0036 by t-test). (F) Confocal images showing SOX2-induced ASCL1+progenitors at 3 wpv. Scale bars, 50 μm. (G) Experimental design to determine the NG2 glia origin for SOX2-induced ASCL1+ cells. (H) Quantification of SOX2-induced ASCL1+ progenitors from NG2 glia at 3 wpv (mean ± SEM; n=3 mice per group; ****p<0.0001 by t-test). (I) Confocal images showing SOX2-induced ASCL1+ progenitors and DCX+ cells originating from NG2 glia at 3 wpv. Scale bars, 50 μm. (J) Experimental design to determine the lineage relationship of SOX2-induced ASCL1+ progenitors and DCX+ cells. (K) Quantification of DCX+ cells from SOX2-induced ASCL1+ progenitors at 4 wpv (mean ± SEM; n=3 mice per group; **p=0.0015 by t-test). (L) Confocal images showing lineage-traced DCX+ cells from SOX2-induced ASCL1+progenitors at 4 wpv. Scale bars, 50 μm. (M) Experimental design for analyzing SOX2-induced new neurons. (N) Quantification of SOX2-induced new neurons from NG2 glia (mean ± SEM; n=3-6 mice per group; *p=0.0162 and ***p=0.0006 by t-test). (O) Confocal images of SOX2-induced new neurons from NG2 glia. Enlarged views of the boxed regions are shown in the right panels. Scale bars, 50 μm. (P) Experimental design for analyzing SOX2-induced neurons from NG2 glia. (Q) Confocal images of NG2 glia-derived neurons expressing markers for mature neurons. Examples of these neurons are indicated by arrows. Some of the YFPNeuNMAP2 cells are outlined with dotted circles. Scale bars, 20 μm. (R-T) Confocal images of NG2 glia-derived neurons with the indicated subtype-specific markers. Asterisks indicate examples of NG2 glia-derived neurons, whereas arrowheads point to signal co-localization in orthogonal views. Some of the YFPGLYT2MAP2 cells are outlined with dotted circles. Scale bars, 20 μm. (U) Quantification of subtypes of NG2 glia-derived neurons (mean ± SEM; n=100-500 YFP+MAP2+ cells from 3 mice for each maker). See also Figure S4 and S5.
Figure 5.
Figure 5.. SOX2-induced neurons from NG2 glia form synaptic connections.
(A) Experimental design for analyzing monosynaptic connections of NG2 glia-derived neurons. (B) Confocal images of cells surrounding the virus-injected spinal cord area. Induced neurons are traced with tdT, whereas cells harboring the engineered rabies virus are indicated by eGFP. Arrows show examples of “starter” cells (eGFP+tdT+NeuN+). Some of the eGFPtdTNeuN−> cells are outlined with dotted circles. Scale bar, 20 μm. (C) Estimates of “starter” cells in the virus-injected spinal cord (mean ± SEM; n=3-6 mice per group). (D) Confocal images of rabies-traced propriospinal neurons. Scale bars, 50 μm. (E) Estimates of rabies-traced propriospinal neurons (mean ± SEM; n=3-6 mice per group). (F) Confocal images of rabies-traced DRG neurons. Scale bars, 200 μm. (G) Estimates of rabies-traced DRG neurons (mean ± SEM; n=3-6 mice per group). (H) A schematic representation of spinal areas with induced neurons and rabies-traced neurons. (I) Confocal images of rabies-traced axon bundles at the indicated spinal cord levels. Their approximate locations are marked in the top diagrams. G/C, gracile/cuneate tract; ReST, reticulospinal tract; VeST, vestibulospinal tract. Scale bars, 100 μm. (J) Schematic representations and confocal images of rabies-traced neurons in the brainstem. Rabies-traced axon bundles and somas are indicated in the top diagrams. RS, rubrospinal tract; RetN, reticular nucleus; VN, vestibular nucleus; RF, reticular formation. Scale bars, 20 μm. (K) Estimates of rabies-traced neurons in the brain/brainstem (mean ± SEM; n=3-6 mice per group). See also Figure S6.
Figure 6.
Figure 6.. SOX2-mediated reprogramming of NG2 glia promotes functional recovery following SCI.
(A) A schematic drawing of the procedure. Adult mouse underwent dorsal hemisection at the 5th cervical level (C5-DH), followed by virus injections and behavioral tests. (B) Experimental design for behavioral tests. (C) Percentage of forelimb drops during grid-walking tests (mean ± SEM; n=12-13 mice per group; F(14,454)=176.5 and p<0.0001 for time-dependent effect; F(2,35)=4.299 and p=0.0214 for treatment-dependent effect; SOX2/p75-2 vs. GFP: ##p=0.0015 at 14 wks, #p= 0.0140 at 16 wks, ##p=0.0013 at 18 wks, #p=0.02223 at 20 wks, ####p<0.0001 at 22 wks, 24wks and 26 wks; SOX2/p75-2 vs. p75-2: *p=0.0261 at 14 wks, *p=0.0346 at 22 wks, *p=0.0488 at 24 wks, and *p=0.0383 at 26 wks). The inset graph shows performance of individual mouse at the endpoint 26 wks. (D) Lower magnification views of spinal cord tissues with the indicated marker staining. Scale bars, 200 μm. (E) Enlarged views of the boxed regions in Figure 6D. Arrowheads show examples of BrdU+NeuN+ neurons. Higher magnification views of the boxed regions are shown in the lower panels. Scale bars, 25 μm. (F) A schematic of the distribution of SOX2-induced new neurons. D, dorsal; V, ventral; R, rostral; C, caudal. (G) Quantification of new neurons in the injured spinal cord (mean ± SEM; n=6 mice per group). (H) Low (stitched images) and high magnification views of GFAP-stained glial scar surrounding the lesion epicenter. Scale bars, 500 μm and 50 μm for the left and right panels, respectively. (I) Representative 3D reconstructions of glial scar at the lesion site. Scale bars, 500 μm. (J) Quantification of glial scar volume (mean ± SEM; n=8 mice per group; *p=0.0247). (K) Quantification of glial scar surface area (mean ± SEM; n=8 mice per group; *p=0.0361). See also Figure S7.
Figure 7.
Figure 7.. SOX2-reprogrammed NG2 glia are bipotent in the spinal cord with injury.
(A) A schematic drawing of C5-DH SCI and the locations of virus injections. (B) Experimental design for analyzing the fates of SOX2-reprogrammed NG2 glia in adult Ascl1-CreERT2;Rosa-tdT mice. (C) Stitched images of lower magnification views of spinal cords injected with the indicated viruses at 12 wpv. Scale bar, 250 μm. (D-G) Confocal images of the indicated cell markers surrounding the injured spinal cord. Scale bars, 50 μm. (H) Quantification of the fates of lineage traced cells (mean ± SEM; n=3-4 mice per group).

Similar articles

Cited by

References

    1. Al-Ali H, Ding Y, Slepak T, Wu W, Sun Y, Martinez Y, Xu XM, Lemmon VP, and Bixby JL (2017). The mTOR Substrate S6 Kinase 1 (S6K1) Is a Negative Regulator of Axon Regeneration and a Potential Drug Target for Central Nervous System Injury. J Neurosci 37, 7079–7095. - PMC - PubMed
    1. Barnabe-Heider F, Goritz C, Sabelstrom H, Takebayashi H, Pfrieger FW, Meletis K, and Frisen J (2010). Origin of new glial cells in intact and injured adult spinal cord. Cell stem cell 7, 470–482. - PubMed
    1. Buffo A, Rite I, Tripathi P, Lepier A, Colak D, Horn AP, Mori T, and Gotz M (2008). Origin and progeny of reactive gliosis: A source of multipotent cells in the injured brain. Proceedings of the National Academy of Sciences of the United States of America 105, 3581–3586. - PMC - PubMed
    1. Chen B, Li Y, Yu B, Zhang Z, Brommer B, Williams PR, Liu Y, Hegarty SV, Zhou S, Zhu J, et al. (2018). Reactivation of Dormant Relay Pathways in Injured Spinal Cord by KCC2 Manipulations. Cell 174, 1599. - PMC - PubMed
    1. Chen C, Zhong X, Smith DK, Tai W, Yang J, Zou Y, Wang LL, Sun J, Qin S, and Zhang CL (2019). Astrocyte-Specific Deletion of Sox2 Promotes Functional Recovery After Traumatic Brain Injury. Cereb Cortex 29, 54–69. - PMC - PubMed

Publication types