
X Chromosome Contribution to the Genetic Architecture of Primary Biliary Cholangitis

Rosanna Asselta et al. Gastroenterology. 2021 Jun.

Abstract

Background & aims: Genome-wide association studies in primary biliary cholangitis (PBC) have failed to find X chromosome (chrX) variants associated with the disease. Here, we specifically explore the chrX contribution to PBC, a sexually dimorphic complex autoimmune disease.

Methods: We performed a chrX-wide association study, including genotype data from 5 genome-wide association studies (from Italy, United Kingdom, Canada, China, and Japan; 5244 case patients and 11,875 control individuals).

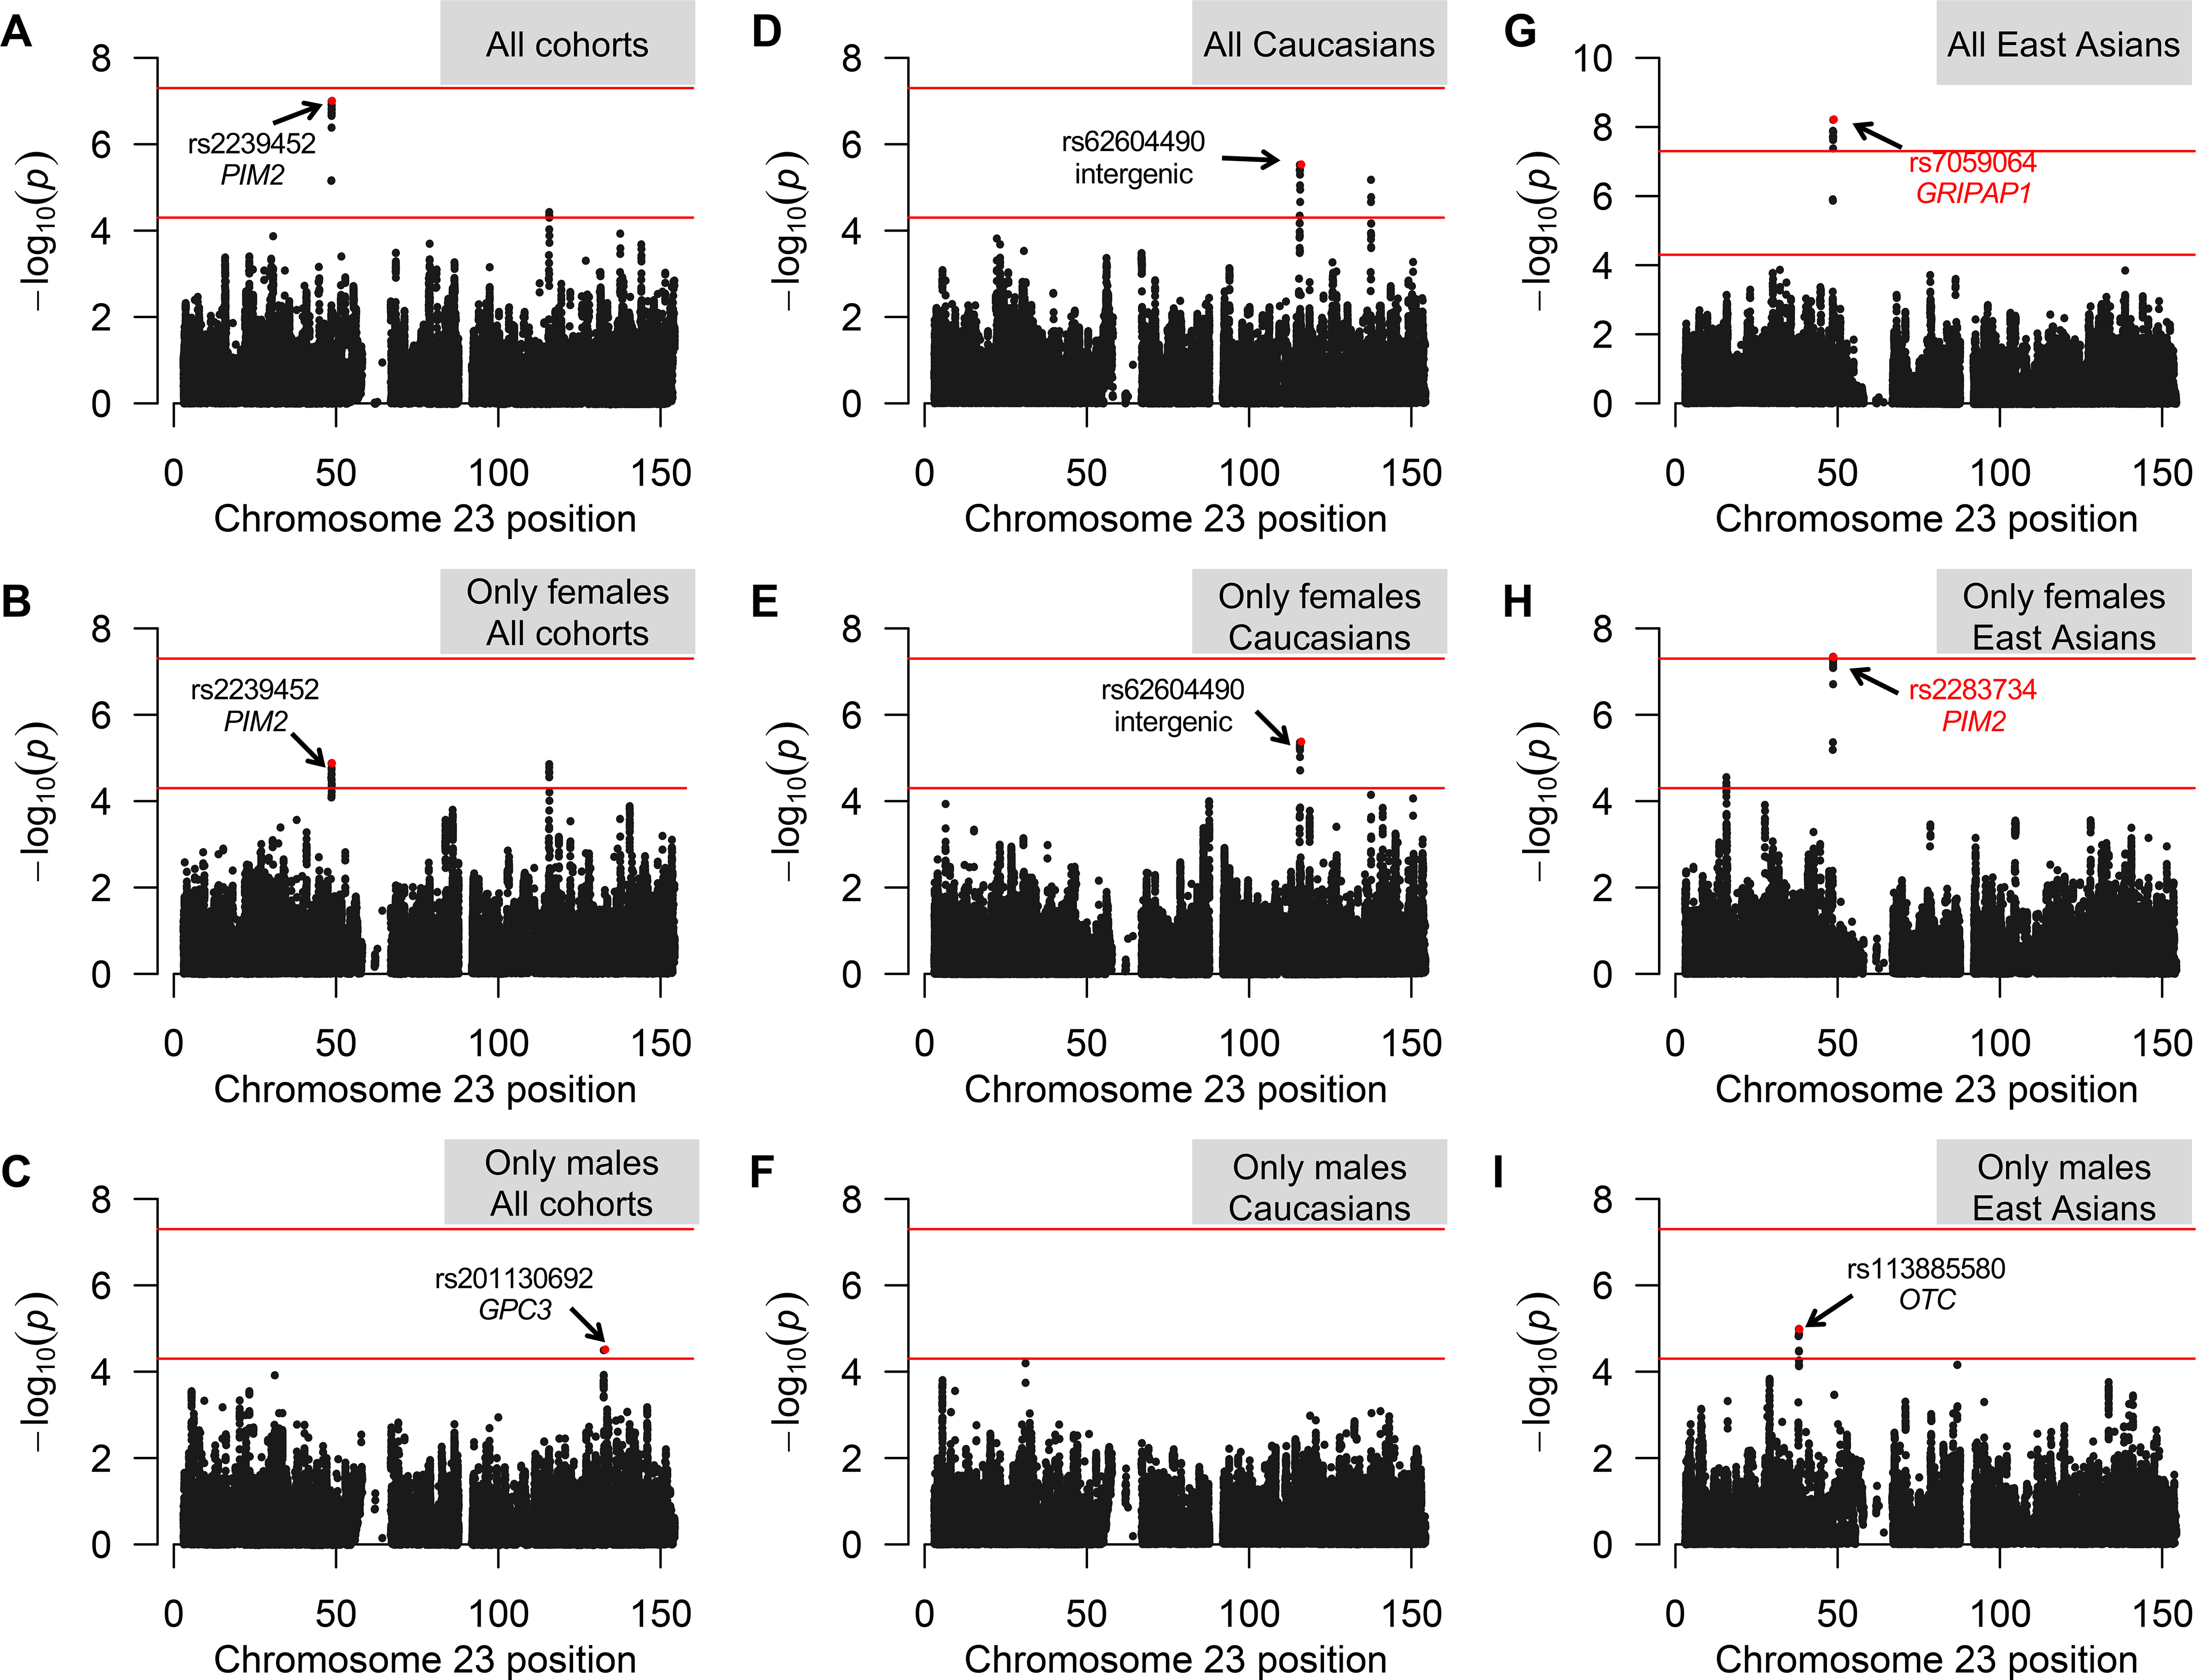
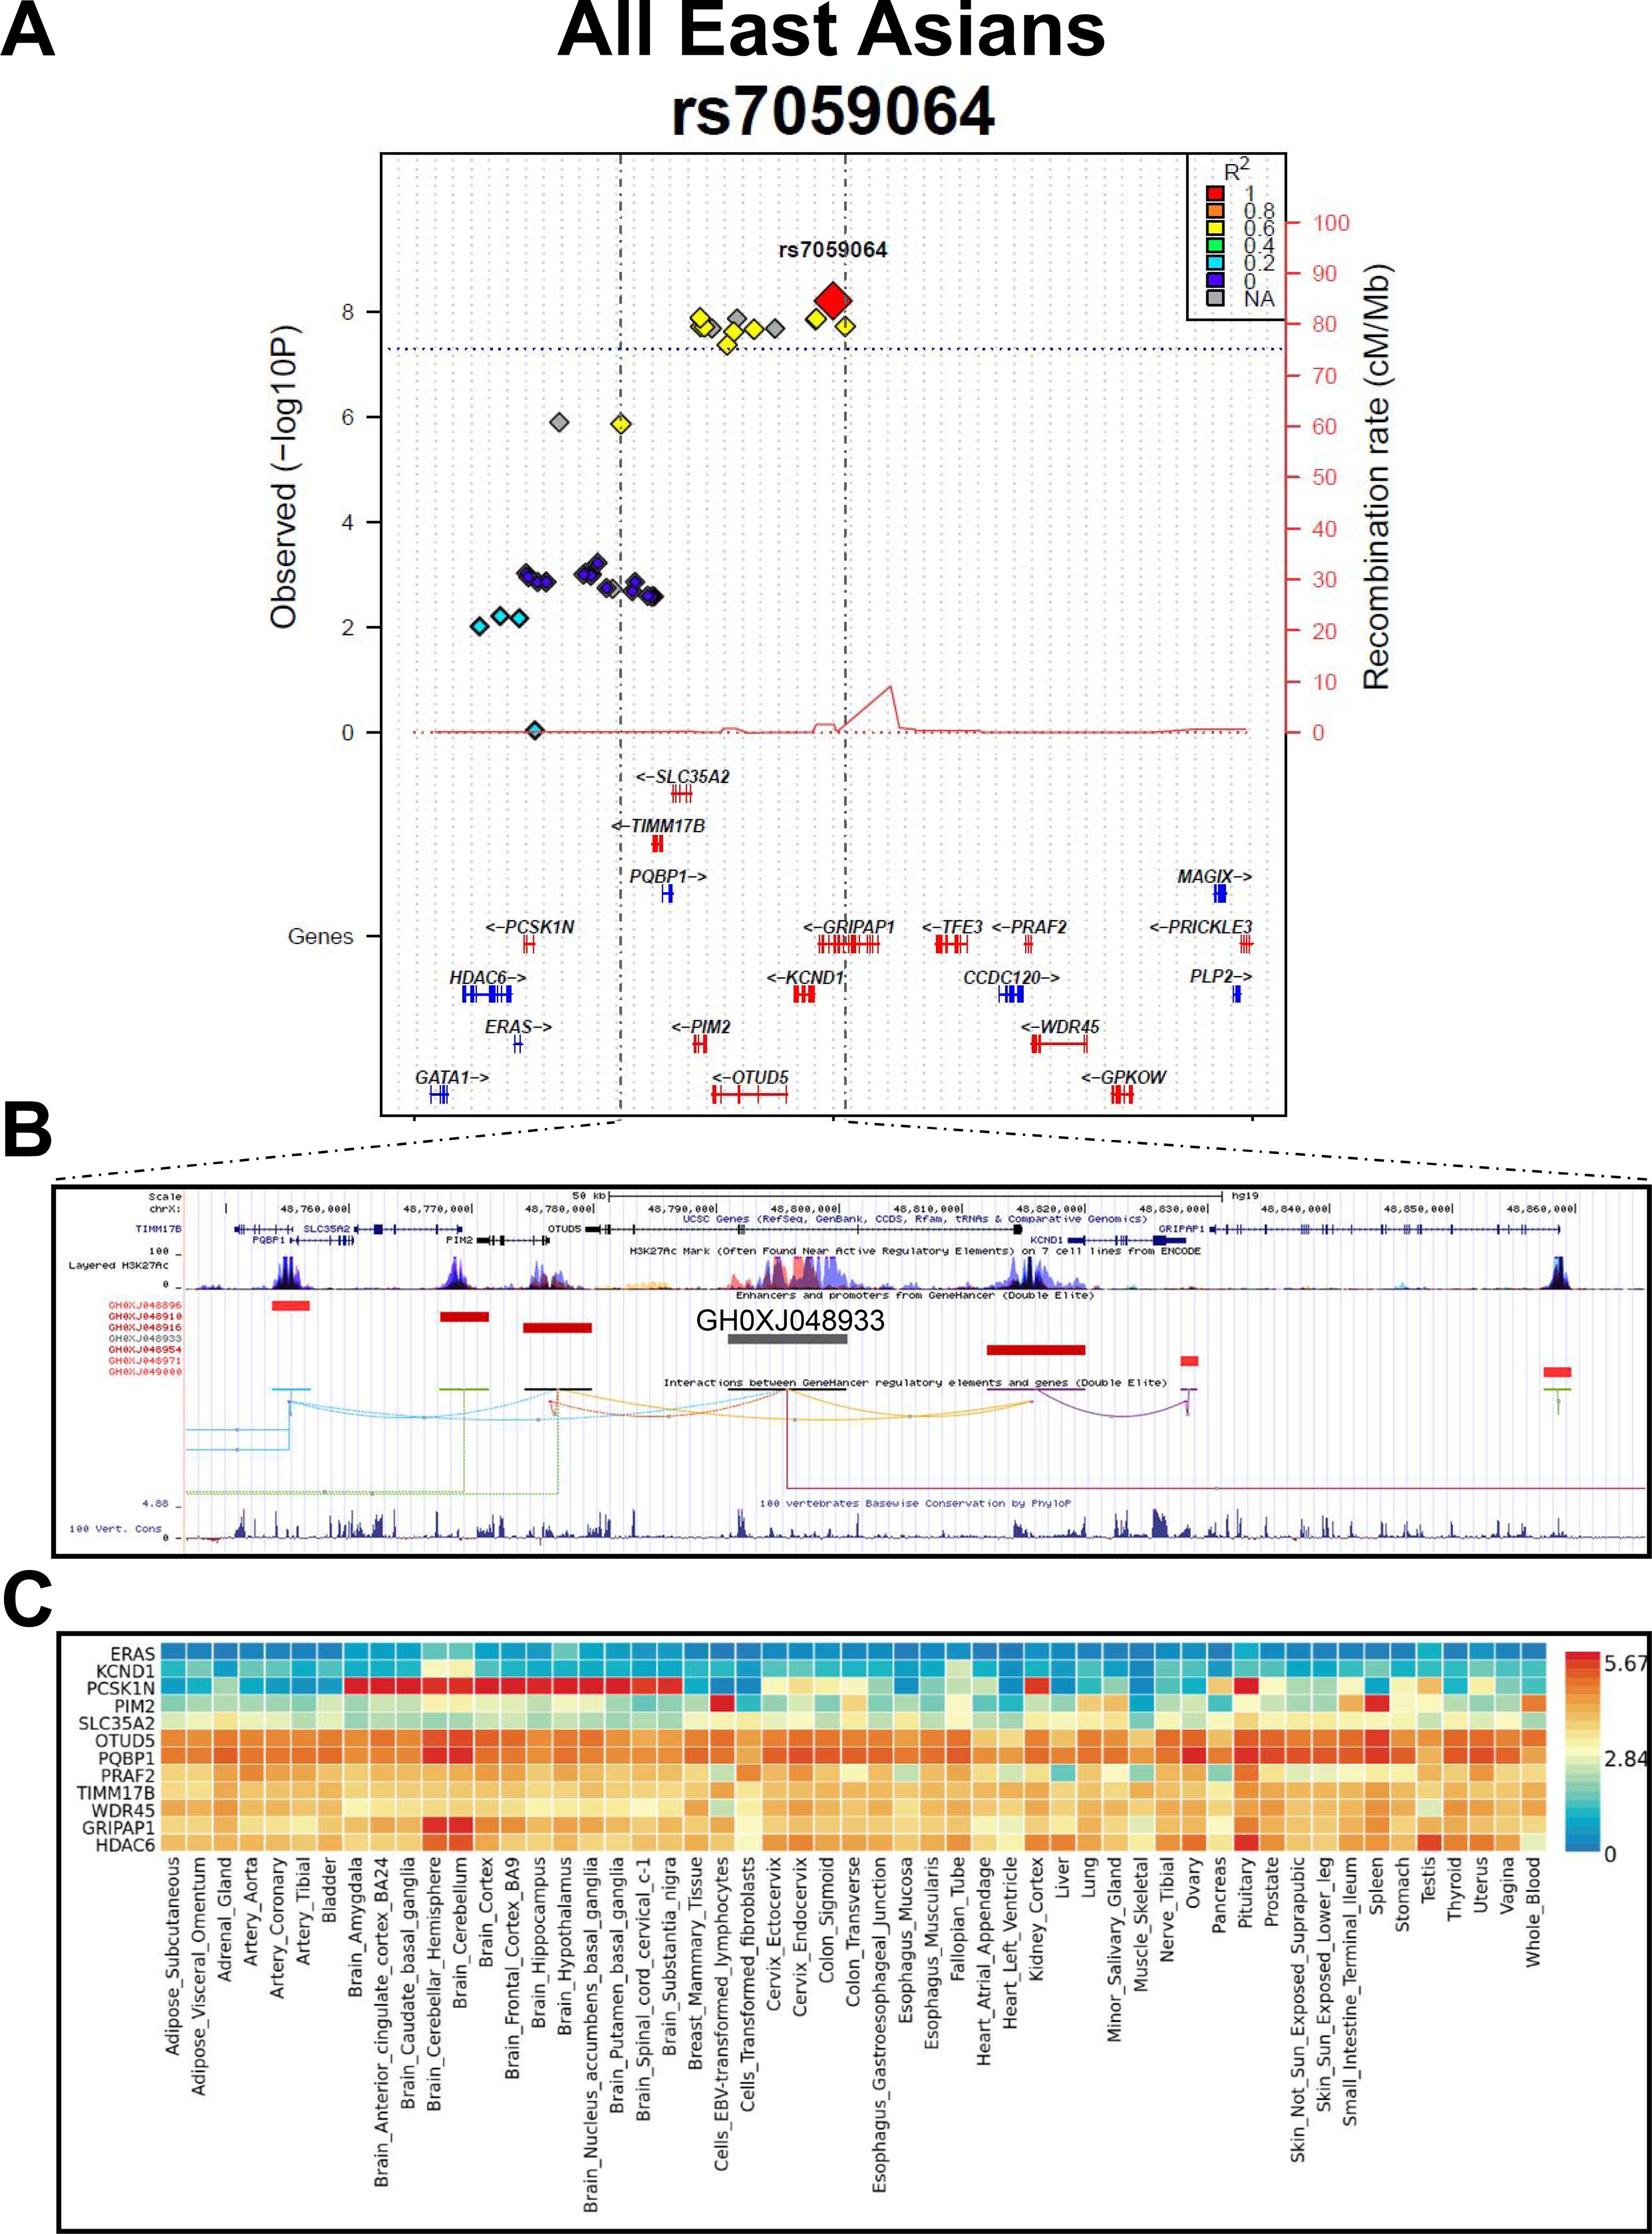
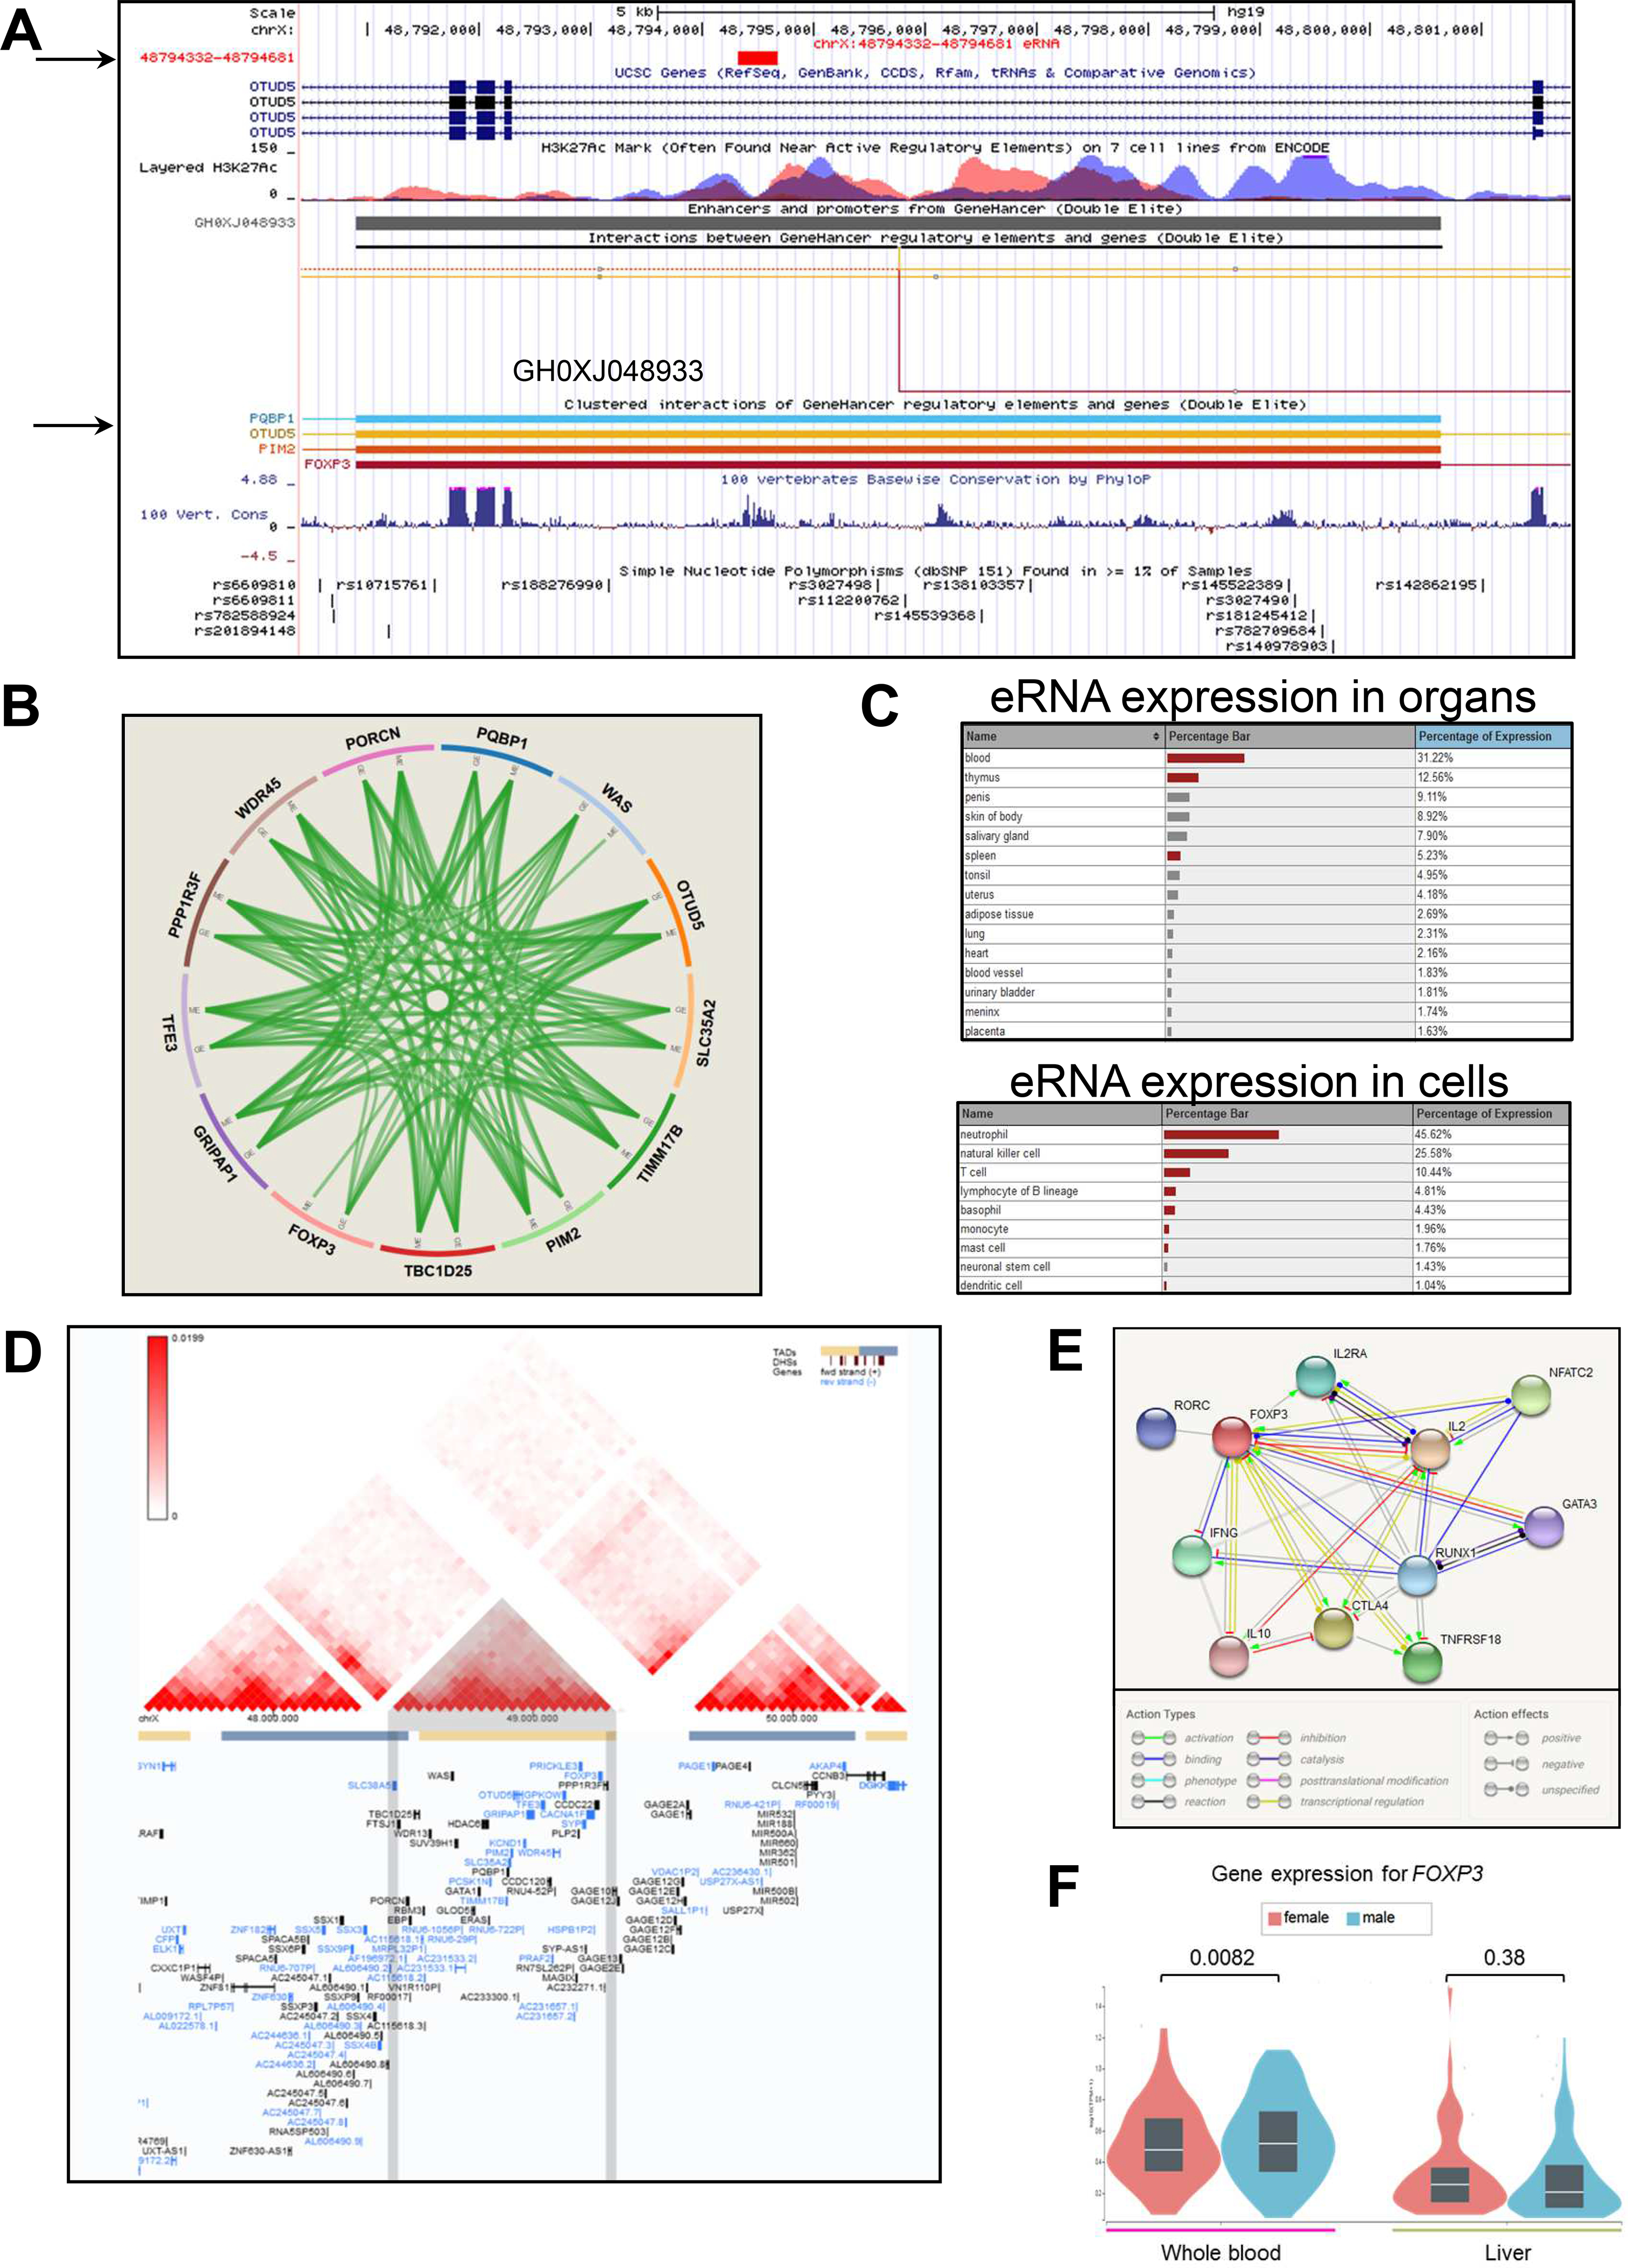
Results: Single-marker association analyses found approximately 100 loci displaying P < 5 × 10⁻⁴, with the most significant being a signal within the OTUD5 gene (rs3027490; P = 4.80 × 10⁻⁶; odds ratio [OR], 1.39; 95% confidence interval [CI], 1.028-1.88; Japanese cohort). Although the transethnic meta-analysis evidenced only a suggestive signal (rs2239452, mapping within the PIM2 gene; OR, 1.17; 95% CI, 1.09-1.26; P = 9.93 × 10⁻⁸), the population-specific meta-analysis showed a genome-wide significant locus in East Asian individuals pointing to the same region (rs7059064, mapping within the GRIPAP1 gene; P = 6.2 × 10⁻⁹; OR, 1.33; 95% CI, 1.21-1.46). Indeed, rs7059064 tags a unique linkage disequilibrium block including 7 genes: TIMM17B, PQBP1, PIM2, SLC35A2, OTUD5, KCND1, and GRIPAP1, as well as a superenhancer (GH0XJ048933 within OTUD5) targeting all these genes. GH0XJ048933 is also predicted to target FOXP3, the main T-regulatory cell lineage specification factor. Consistently, OTUD5 and FOXP3 RNA levels were up-regulated in PBC case patients (1.75- and 1.64-fold, respectively).

Conclusions: This work represents the first comprehensive study, to our knowledge, of the chrX contribution to the genetics of an autoimmune liver disease and shows a novel PBC-related genome-wide significant locus.

Keywords: Meta-analysis; Superenhancer; X-Wide Association Study.


Figures

Figure 1.
Figure 1.. Single-SNP association analysis results.
A) Manhattan plots showing the associations of chrX SNPs with PBC in the analyzed cohorts (CA, Canadians; ITA, Italians; UK, British; JP, Japanese; CH, Chinese) for the Stouffer analysis (Test 2). The blue line represents the P=1*10−5 significance level. SNPs showing lowest P values are indicated by an arrow. B) Venn diagrams show the number of genes mapping in correspondence/proximity of SNPs at P<0.0005 for each population. Chinese and Japanese show the major number of overlapping signals (genes are listed); the only gene shared by three populations is also highlighted.
Figure 2.
Figure 2.. Manhattan plots of meta-analyses.
Manhattan plots summarizing the results of transethnic (A-C), population-specific (D-I), and sex-stratified meta-analyses (B,C,E,F,H,I). The horizontal lines represent the suggestive P=5*10−5 and the genome-wide Bonferroni-corrected P=5*10−8 significance levels. SNPs showing lowest P values are indicated by an arrow (if intragenic, the relevant gene is also indicated); those reported in red, survive to the Bonferroni correction for multiple testing.
Figure 3.
Figure 3.. The GRIPAP1/PIM2 locus.
A) Plot of the regional association signals surrounding the rs7059064 top hit in East Asians. The plot was built using the LocusTrack site (https://gump.qimr.edu.au/general/gabrieC/LocusTrack/). B) Screenshot from the UCSC Genome browser (http://genome.ucsc.edu/; GRCh37/hg19) highlighting the PBC-associated LD region (coordinates chrX:48,750,000–48,865,000). The panel shows the following tracks: i) the ruler with the scale at the genomic level; ii) chrX nucleotide numbering; iii) the UCSC RefSeq track; iv) ENCODE data (https://www.encodeproject.org/) for H3K4Me1, H3K4Me3, H3K27Ac histone marks, derived from seven cell lines; v) enhancers (grey bars) and promoters (red bars) from GeneHancer with the GH0XJ048933 enhancer targets; vi) interactions (curved lines) connecting GeneHancer regulatory elements/genes; vii) basewise conservation track. C) Expression panel across tissues of the genes depicted in panel A (GTEx data; https://gtexportal.org/home/).
Figure 4.
Figure 4.. The GH0XJ048933 SE codes for an eRNA and co-regulates the genes of the GRIPAP1/PIM2 locus.
A) Screenshot from the UCSC Genome browser showing the GH0XJ048933 SE region (chrX:48,791,000–48,802,000). Listed tracks are: i) the ruler with the scale at the genomic level; ii) chrX nucleotide numbering; iii) the track for eRNAs from the FANTOM5 Human Enhancers project (http://slidebase.binf.ku.dk/human_enhancers/); iv) the UCSC RefSeq track; v) ENCODE data for H3K4Me1, H3K4Me3, H3K27Ac histone marks, derived from seven cell lines; vi) the enhancers/promoters track from GeneHancer; the grey bar indicates the GH0XJ048933 enhancer; vii) interactions connecting GeneHancer regulatory elements and genes (interactions with OTUD5, PIM2, PQBP1, FOXP3 are depicted); viii) basewise conservation track; ix) the dbSNP(151) track for common polymorphisms. B) Integration of gene expression (GE), protein expression (PE), copy number (CN) and methylation (ME) relative to the 13 genes regulated by the GH0XJ048933 SE. Data come from the TCGA portal (https://tcga-data.nci.nih.gov/docs/publications/tcga/?). Circle plot was built by using the Zodiac tool (http://www.compgenome.org/zodiac/). Only significant intergenic interactions are shown (FDR≤0.1). Green lines indicate positive interactions. C) The tables show expression data (>1%) in organs/cells for the eRNA gene mapping within GH0XJ048933. Red bars indicate a significant over-representation of the transcript (FANTOM5 data). D) TAD structure of the chrX:47,480,000–50,440,000 region. The central TAD contains all genes of the PBC-associated region tagged by rs7059064. The panel was produced though the 3D-Genome Browser (http://3dgenome.org), using Hi-C data produced in HepG2 cells (hepatocytes) and generated by the Dekker Laboratory (resolution: 40kb). E) FOXP3 interactome. The best 10 interactions are shown (highest confidence=90%). Evidence are based on text-mining, experiments, databases, co-expression data, gene fusions, co-occurrences. The panel was produced using the STRING tool (https://string-db.org/). F) Violin plots show FOXP3 RNA expression levels in whole blood and liver, obtained through the GTEx portal, stratified on sex (265 males, 142 females).
Figure 5.
Figure 5.. OTUD5 and FOXP3 are overexpressed in PBC.
Boxplots show expression levels of OTUD5 (A) and FOXP3 (B) measured by semi-quantitative real-time RT-PCR in PBMCs of a PBC case-control cohort. Boxes define the interquartile range; thick lines refer to the median. Results were normalized to expression levels of the HMBS housekeeping gene and are presented as rescaled values. The number of subjects is indicated (N). Significance levels of t-tests: *: P<0.05; **: P<0.005.

References

    1. Kaplan MM, Gershwin ME. Primary biliary cirrhosis. N Engl J Med 2005;353:1261–1273. - PubMed
    1. Invernizzi P, Selmi C, Gershwin ME. Update on primary biliary cirrhosis. Dig Liver Dis 2010;42:401–408. - PMC - PubMed
    1. Gerussi A, Cristoferi L, Carbone M, et al. The immunobiology of female predominance in primary biliary cholangitis. J Autoimmun 2018;95:124–132. - PubMed
    1. Invernizzi P, Miozzo M, Battezzati PM, Bianchi I, Grati FR, Simoni G, Selmi C, Watnik M, Gershwin ME, Podda M. Frequency of monosomy X in women with primary biliary cirrhosis. Lancet 2004;363:533–535. - PubMed
    1. Webb GJ, Hirschfield GM. Using GWAS to identify genetic predisposition in hepatic autoimmunity. J Autoimmun 2016;66:25–39. - PubMed

Publication types

MeSH terms

LinkOut - more resources