. 2021 May:97:32-46.e35.
doi: 10.1016/j.exphem.2021.02.012. Epub 2021 Mar 3.

Hypoxia promotes erythroid differentiation through the development of progenitors and proerythroblasts

Affiliations

Hypoxia promotes erythroid differentiation through the development of progenitors and proerythroblasts

Aditi Bapat et al. Exp Hematol. 2021 May.

Abstract

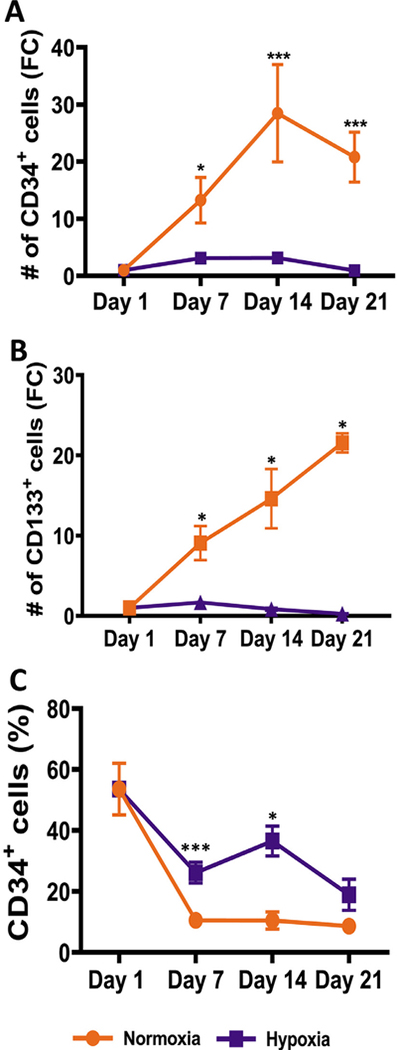
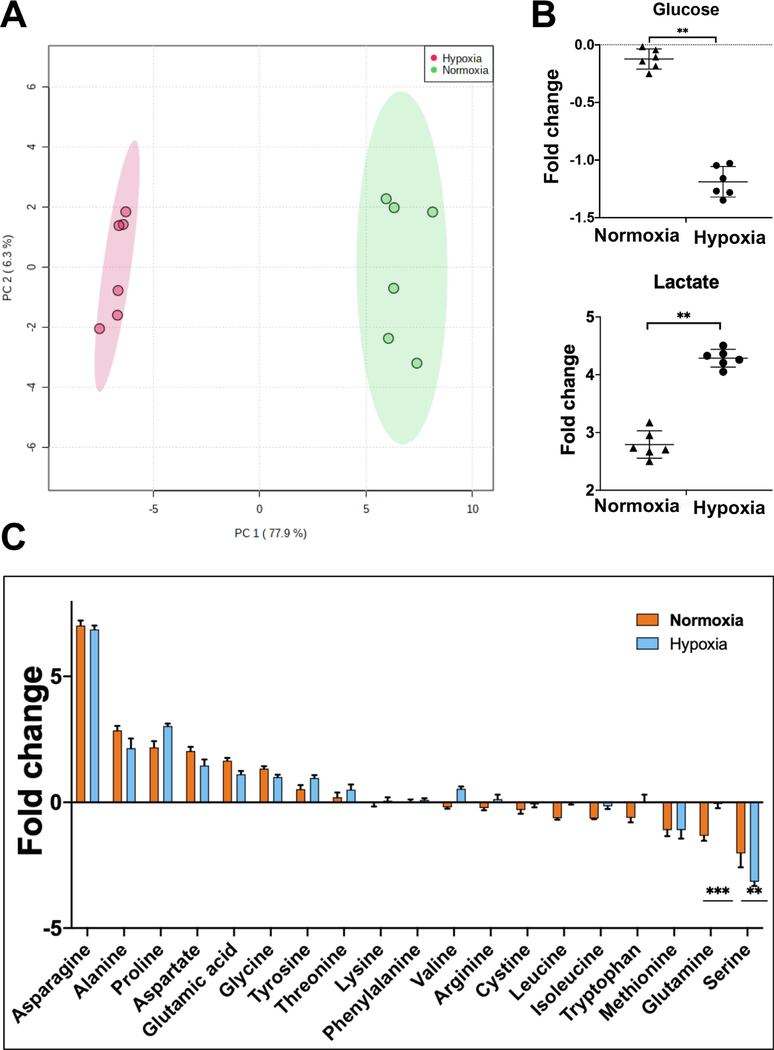
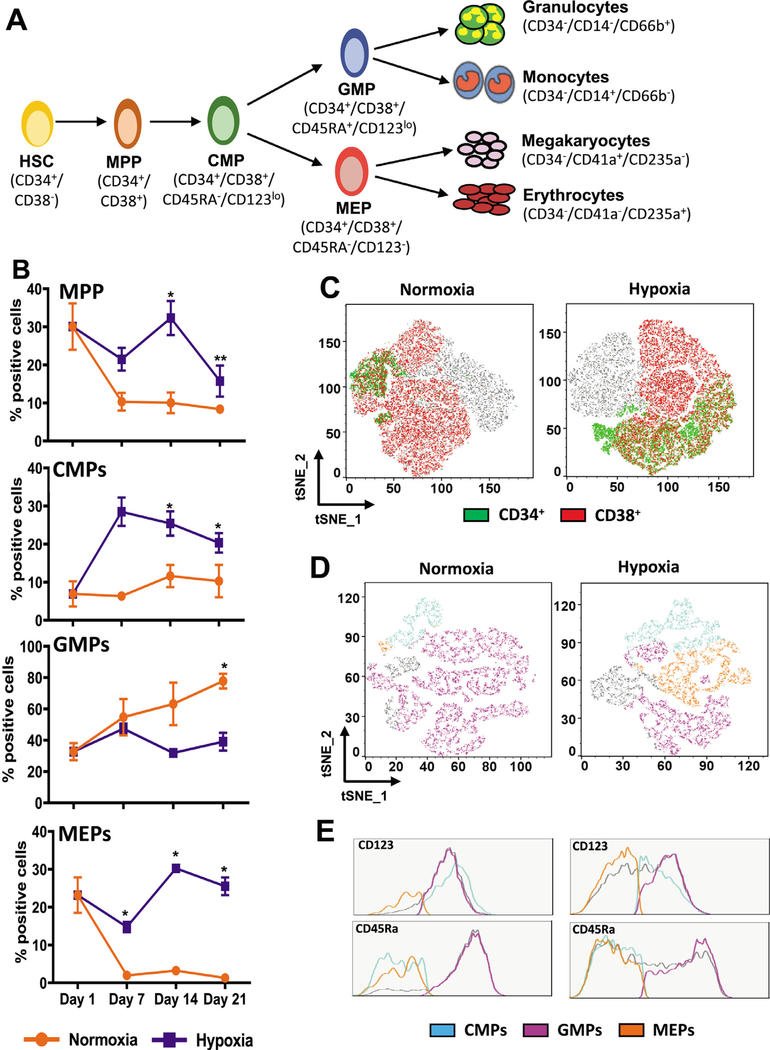
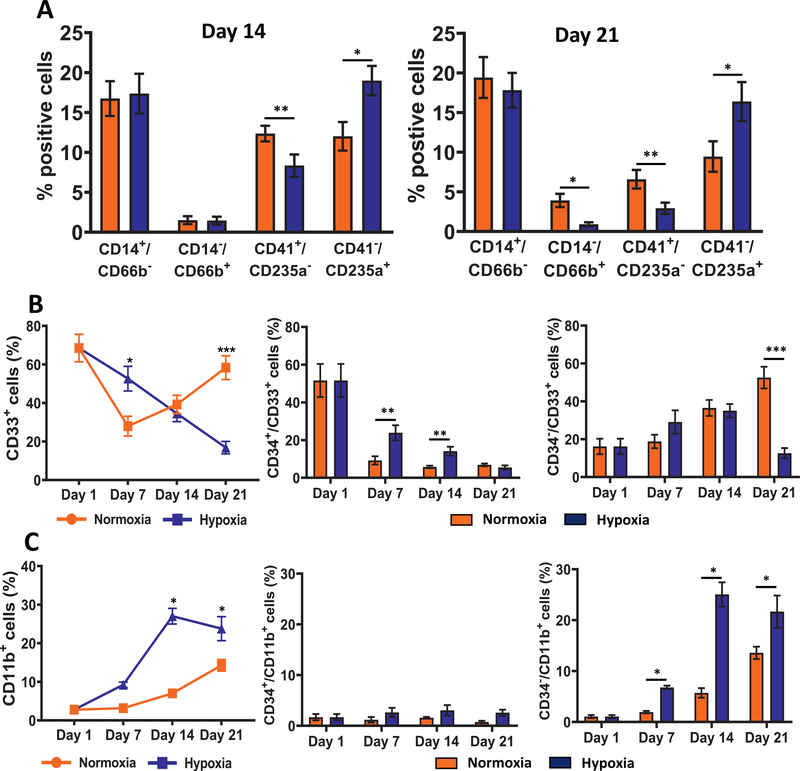
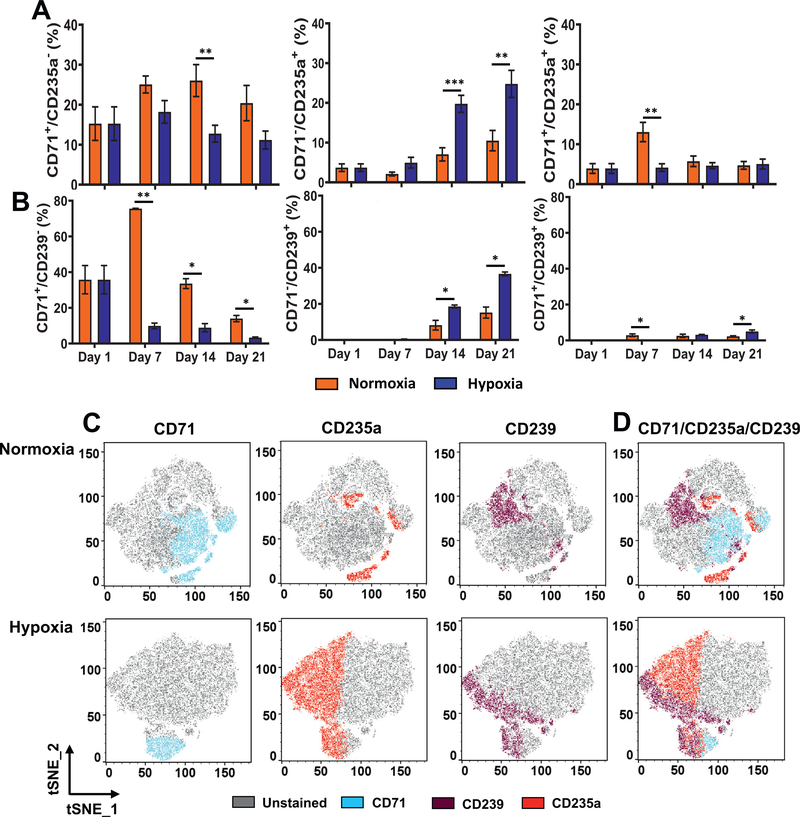
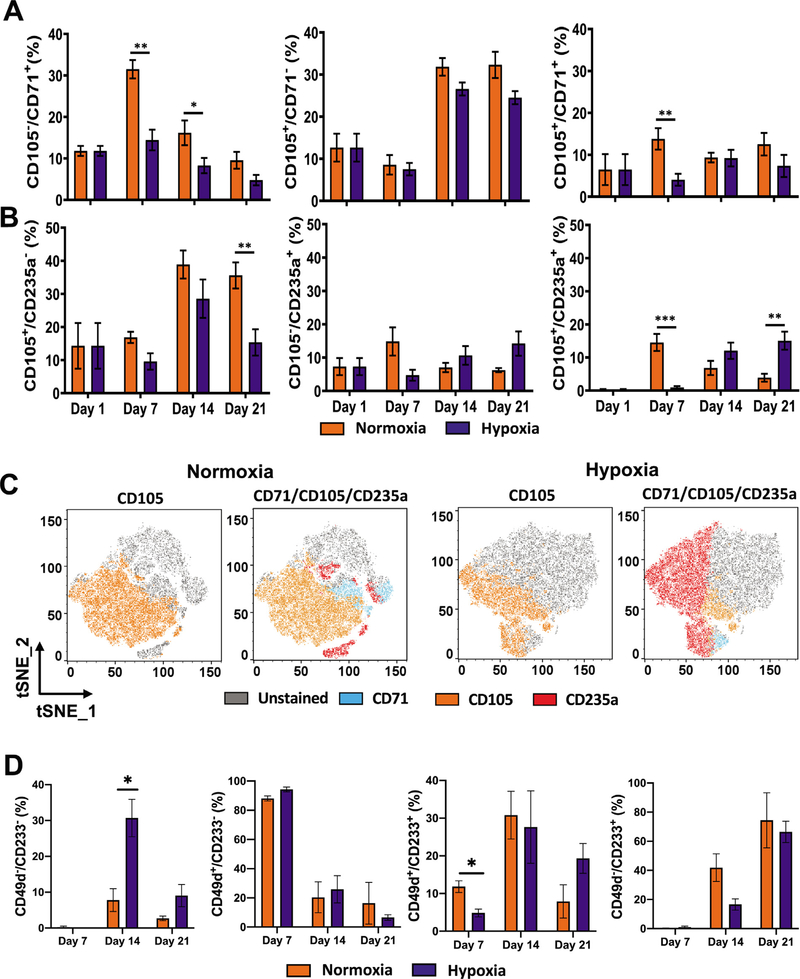
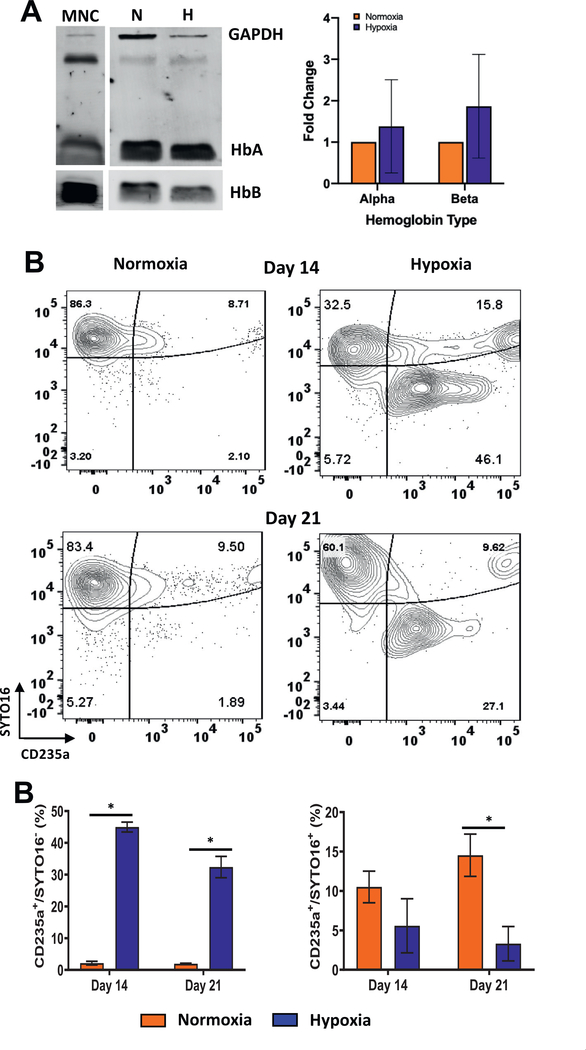
Oxygen is a critical noncellular component of the bone marrow microenvironment that plays an important role in the development of hematopoietic cell lineages. In this study, we investigated the impact of low oxygen (hypoxia) on ex vivo myeloerythroid differentiation of human cord blood-derived CD34+ hematopoietic stem and progenitor cells. We characterized the culture conditions to demonstrate that low oxygen inhibits cell proliferation and causes a metabolic shift in the stem and progenitor populations. We found that hypoxia promotes erythroid differentiation by supporting the development of progenitor populations. Hypoxia also increases the megakaryoerythroid potential of the common myeloid progenitors and the erythroid potential of megakaryoerythroid progenitors and significantly accelerates maturation of erythroid cells. Specifically, we determined that hypoxia promotes the loss of CD71 and the appearance of the erythroid markers CD235a and CD239. Further, evaluation of erythroid populations revealed a hypoxia-induced increase in proerythroblasts and in enucleation of CD235a+ cells. These results reveal the extensive role of hypoxia at multiple steps during erythroid development. Overall, our work establishes a valuable model for further investigations into the relationship between erythroid progenitors and/or erythroblast populations and their hypoxic microenvironment.


Figures

Figure 1.
Figure 1.
Hypoxia reduces proliferation of CD34+ hematopoietic stem and progenitor cells. CD34+ and CD133+ cells in cultures in both hypoxia and normoxia were determined by flow cytometry on days 1, 7, 14 and 21. (A) Fold change in the number of CD34+ cells in the normoxic and hypoxic cultures was calculated relative to day 1. (B) Fold change in the number of CD133+ cells in the normoxic and hypoxic cultures was calculated relative to day 1. (C) Percentage of CD34+ cells in the Lin/Live population is shown. Data are represented as the mean with standard error (n = 6 for CD34 and n = 4 for CD133). Statistical analysis was performed using the Mann-Whitney test, and p values ≤ 0.05 were considered significant. *p < 0.05, **p < 0.005, ***p < 0.0005.
Figure 2.
Figure 2.
Hypoxia causes a metabolic shift in CD34+ hematopoietic stem and progenitor cells. (A) Principal component analysis of samples on the basis of fold change in metabolites in spent medium relative to fresh medium from CD34+ cell cultures incubated in hypoxia or normoxia. (B) Fold change in glucose and lactate in spent medium relative to fresh medium from CD34+ cell cultures incubated in normoxia or hypoxia. (C) Fold change in amino acids in spent medium relative to fresh medium from CD34+ cell cultures incubated in normoxia or hypoxia. Spent medium was collected on day 4 of culture. Statistical analysis was performed in MetaboAnalyst, and p values ≤ 0.05 were considered significant. *p < 0.05, **p < 0.005, ***p < 0.0005.
Figure 3.
Figure 3.
Hypoxia promotes the development of megakaryoerythroid progenitors. (A) Schematic of myeloerythroid differentiation from hematopoietic stem cells. The surface markers used for immunophenotyping of the cells interrogated in this study are indicated. (B) Percentage of multipotent progenitors (MPP), common myeloid progenitors (CMP), megakaryoerythroid progenitors (MEP), and granulocyte−monocyte progenitors (GMP) in cultures incubated in hypoxia and normoxia. For MPPs, the percentage of positive cells in the Lin/Live population was determined, and for CMPs, GMPs, and MEPs, the percentage of positive cells in the MPP population was determined on days 1, 7, 14, and 21. Data are represented as the mean with standard error (n = 4). Statistical analysis was performed using the Mann-Whitney test, and p values ≤ 0.05 were considered significant. (C) tSNE analysis was performed on flow cytometry standard files. tSNE plots for day 21 analysis revealing CD34+ and CD38+ cells in normoxia and hypoxia are represented in the Lin/Live population. (D) tSNE analysis plots revealing the distribution of CMPs, GMPs, and MEPs in the CD34+/CD38+ population in normoxia or hypoxia on day 21 are represented. (E) Histograms for CD45Ra and CD123 expression indicating relative distribution of CMPs (CD45Ra/CD123lo), GMPs (CD45Ra+/CD123lo), and MEPs (CD45Ra/CD123) in normoxia and hypoxia. *p < 0.05, **p < 0.005, ***p < 0.0005.
Figure 4.
Figure 4.
Hypoxia increases erythroid differentiation. (A) Immunophenotypic analysis of lineage cells: monocytes (CD34/CD14+/CD66b), granulocytes (CD34/CD14/CD66b+), megakaryocytes (CD34/CD41a+/CD235a), and erythrocytes (CD34/CD41a/CD235a+) on days 14 and 21. Percentage of positive cells in the CD34/Live population are illustrated. (B) Distribution of cells expressing CD33 was determined on days 1, 7, 14, and 21 by flow cytometry. Percentages of total CD33+, CD34+/CD33+, and CD34/CD33+ cells in the live population are illustrated. (C) Distribution of cells expressing CD11b was determined on days 1, 7, 14, and 21 by flow cytometry. Percentages of total CD11b+, CD34+/CD11b+, and CD34/CD11b+ cells in the live population are illustrated. Data are represented as the mean with standard error (n = 4). Statistical analysis was performed using the Mann-Whitney test, and p values ≤ 0.05 were considered significant. *p < 0.05, **p < 0.005, ***p < 0.0005.
Figure 5.
Figure 5.
Hypoxia enhances expression of erythroid markers. (A) Longitudinal analysis of CD71 relative to the erythroid marker CD235a in cultures incubated in normoxia or hypoxia. Percentages of CD71+/CD235a, CD71/CD235a+, and CD71+/CD235a+ in the CD34/Live population are illustrated. (B) Longitudinal analysis of CD71 relative to the erythroid marker CD239 in cultures incubated in normoxia or hypoxia. Percentages of CD71+/CD239, CD71/CD239+, and CD71+/CD239+ cells in the CD34/Live population are illustrated. Data are represented as the mean with standard error (n = 4). Statistical analysis was performed using the Mann-Whitney test, and p values ≤ 0.05 were considered significant. (C) tSNE plots revealing distribution of CD71+, CD235a+, and CD239+ cells on day 21 in normoxia or hypoxia. (D) tSNE plots of overlay of CD71+, CD235a+, and CD239+ cells in normoxia or hypoxia on day 21. tSNE analysis was performed in FlowJo. *p < 0.05, **p < 0.005, ***p < 0.0005.
Figure 6.
Figure 6.
Expression of CD105 is persistent in hypoxia. (A) Longitudinal analysis of CD71 and CD105 in cultures incubated in normoxia or hypoxia. Percentages of CD71+/CD105, CD71/CD105+, and CD71+/CD105+ in the CD34/Live population are illustrated. (B) Longitudinal analysis of CD105 relative to the erythroid marker CD235a in cultures incubated in normoxia or hypoxia. Percentages of CD105+/CD235a, CD105/CD235a+, and CD105+/CD235s+ cells in the CD34/Live population are illustrated. Data are represented as the mean with standard error (n = 4). Statistical significance was calculated using the Mann-Whitney test, and p values ≤ 0.05 were considered significant. (C) tSNE plots revealing the distribution of CD105+ cells and overlay of CD71+, CD105+, and CD235a+ cells on day 21 in normoxia or hypoxia. tSNE analysis was performed in FlowJo. (D) Longitudinal analysis of the CD49d and CD233 in cultures incubated in normoxia or hypoxia. Percentages of CD49d/CD233, CD49d+/CD233, CD49d+/CD233+, and CD49d+/CD233 cells in the CD235a+ population are illustrated. *p < 0.05, **p < 0.005, ***p < 0.0005.
Figure 7.
Figure 7.
Hypoxia promotes enucleation of erythroid cells. (A) Immunoblotting of α- and β-hemoglobin expression in CD34+ cell cultures incubated in normoxia or hypoxia and in cord blood-derived mononuclear cells (MNCs). Average protein expression (§SE, n = 3) normalized to GAPDH is illustrated. (B) Enucleation was determined by SYTO16 staining. Contour plots for CD235a+ and SYTO16+ cells in cultures incubated in hypoxia or normoxia. (C) Percentages of enucleated (CD235a+/SYTO16) and nucleated (CD235a+/SYTO16+) erythroid cells in the CD34/Live population on days 14 and 21 are represented as the mean with standard error (n = 4). Statistical analysis was performed using the Mann-Whitney test, and p values ≤ 0.05 were considered significant. *p < 0.05, **p < 0.005, ***p < 0.0005.

References

    1. Szade K, Gulati GS, Chan CKF, et al. Where hematopoietic stem cells live: the bone marrow niche. Antioxid Redox Signal. 2018;29:191–204. - PMC - PubMed
    1. Garcia M, Chen CC. The bone marrow microenvironment—driver of leukemia evolution? Stem Cell Investig. 2017;4:11. - PMC - PubMed
    1. Calvi LM, Li AJ, Becker MW. What is the role of the microenvironment in MDS? Best Pract Res Clin Haematol. 2019;32:101113. - PubMed
    1. Morrison SJ, Scadden DT. The bone marrow niche for haematopoietic stem cells. Nature. 2014;505:327–334. - PMC - PubMed
    1. Crane GM, Jeffery E, Morrison SJ. Adult haematopoietic stem cell niches. Nat Rev Immunol. 2017;17:573–590. - PubMed

Publication types

LinkOut - more resources