. 2021 Jul;100(1):107-121.
doi: 10.1016/j.kint.2021.02.025. Epub 2021 Mar 3.

Annexin A1 alleviates kidney injury by promoting the resolution of inflammation in diabetic nephropathy

Affiliations

Annexin A1 alleviates kidney injury by promoting the resolution of inflammation in diabetic nephropathy

Liang Wu et al. Kidney Int. 2021 Jul.

Erratum in

Abstract

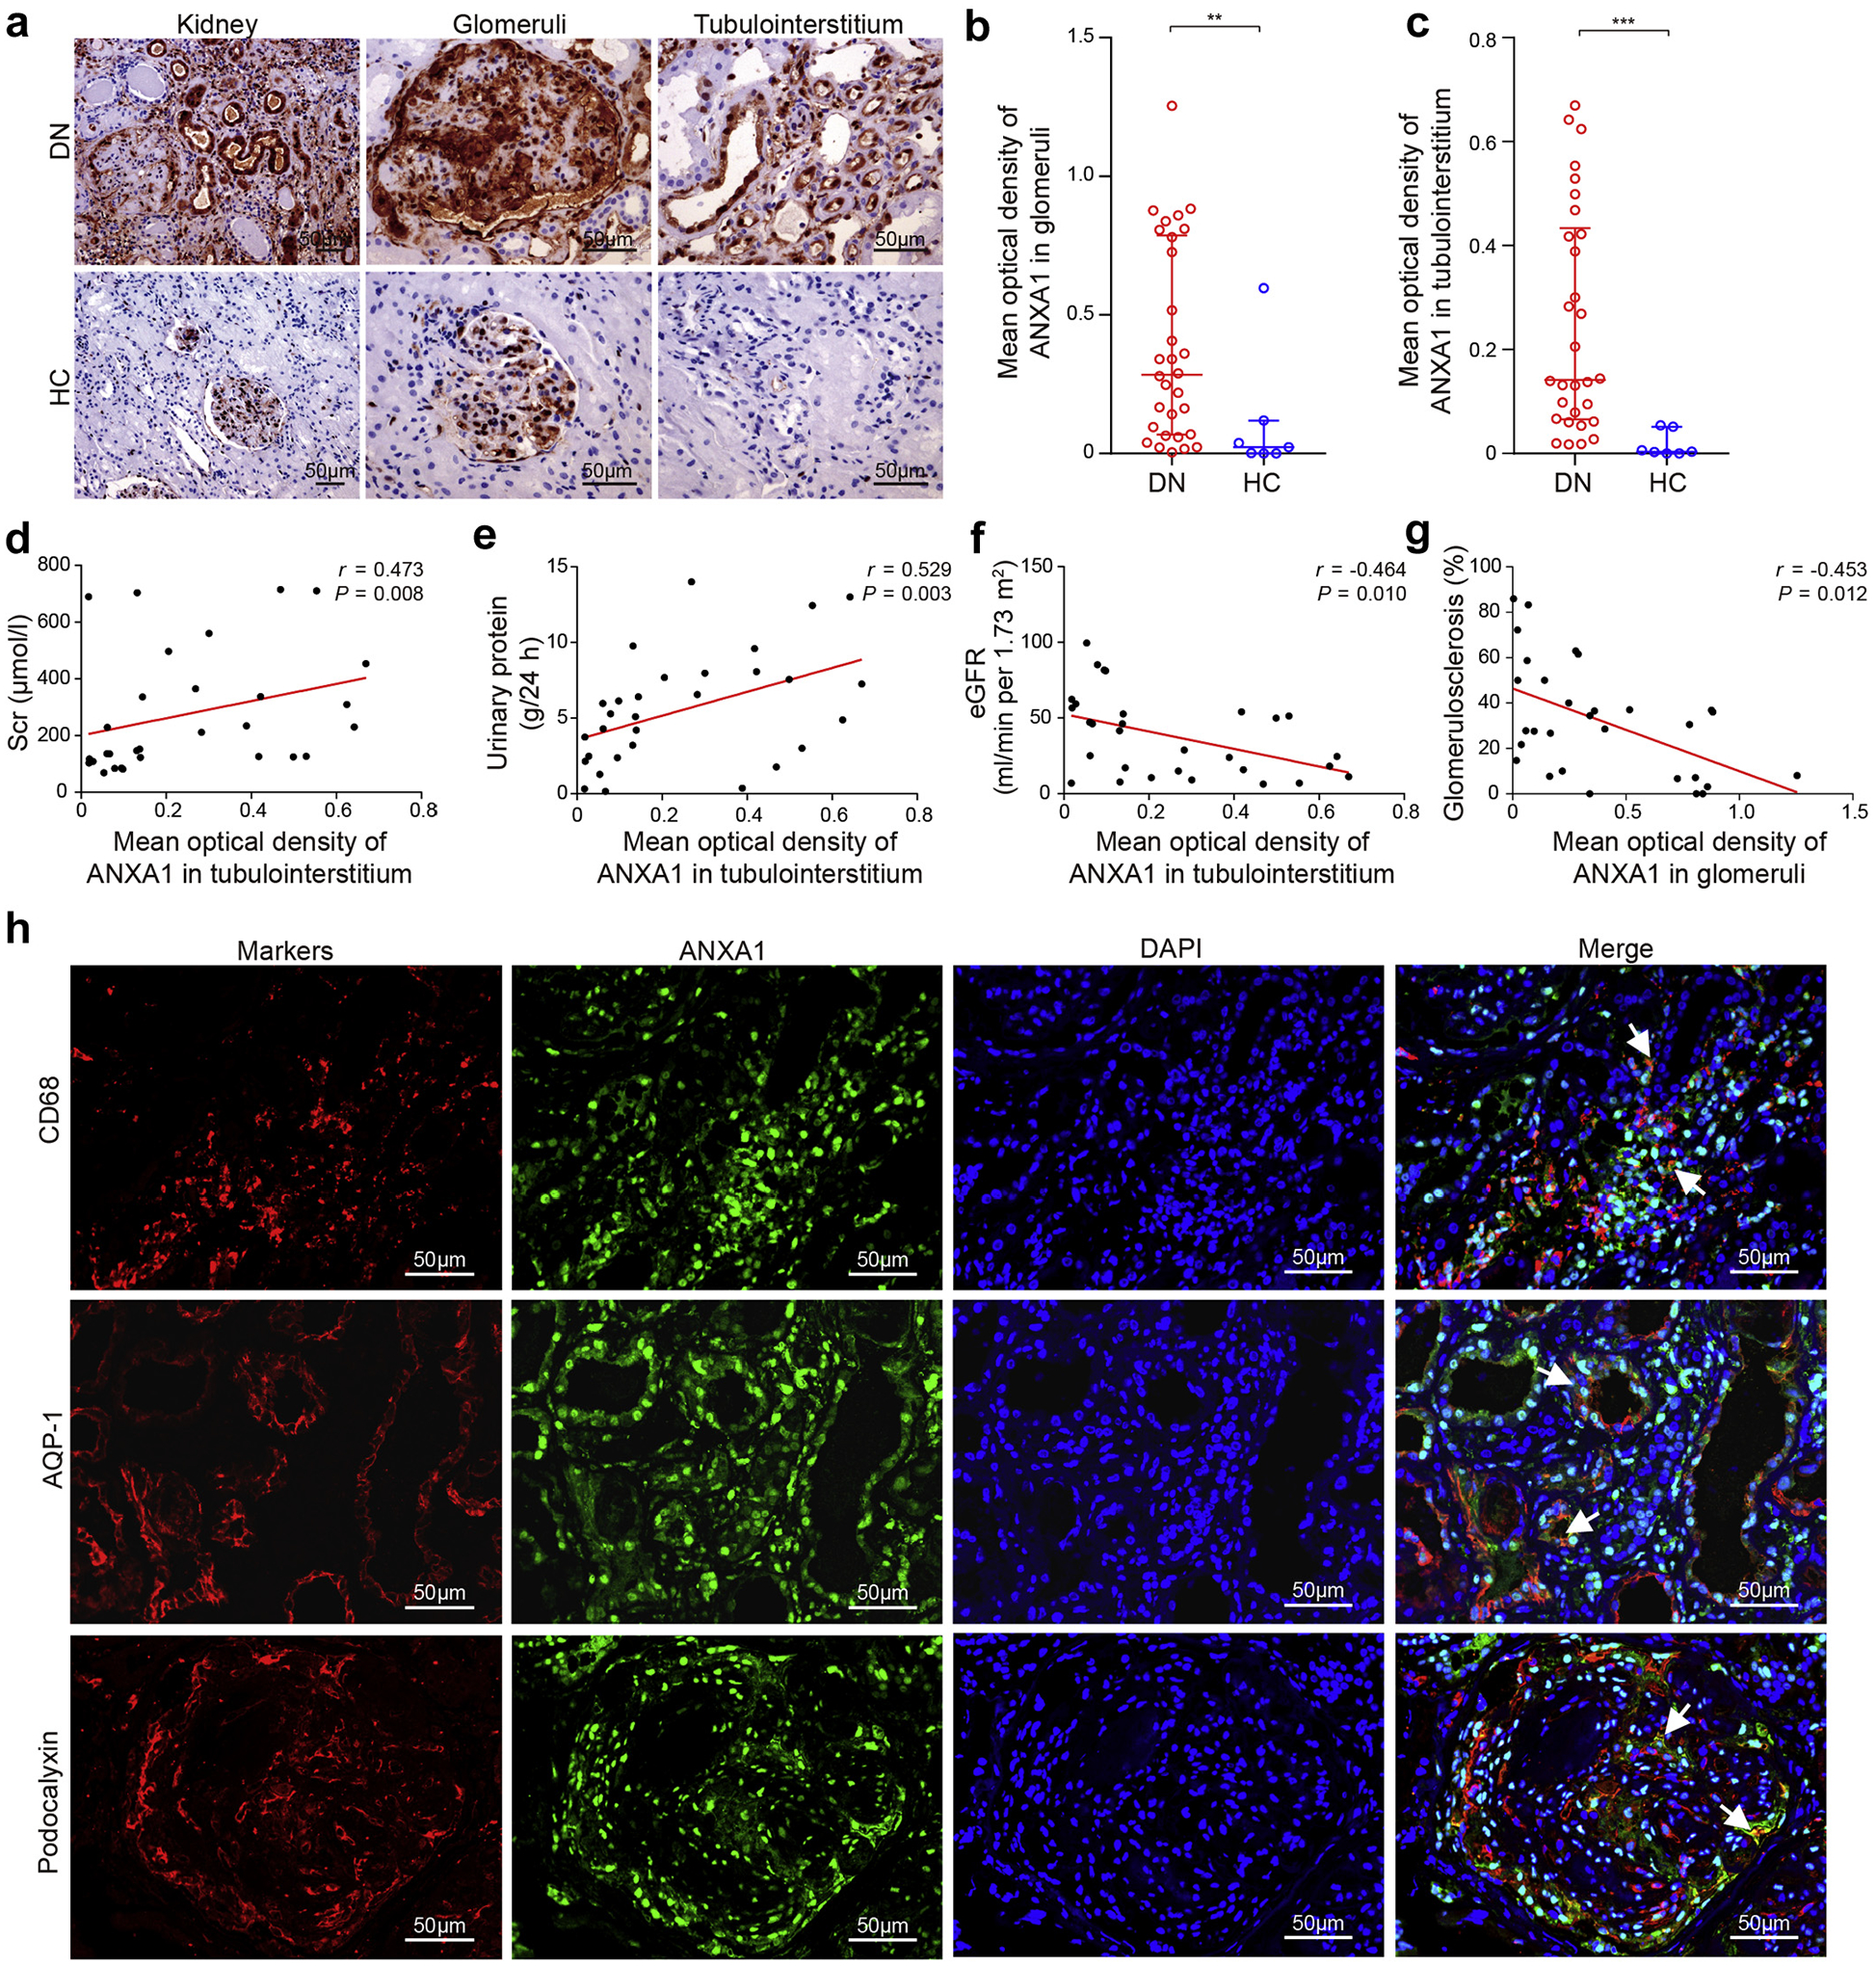
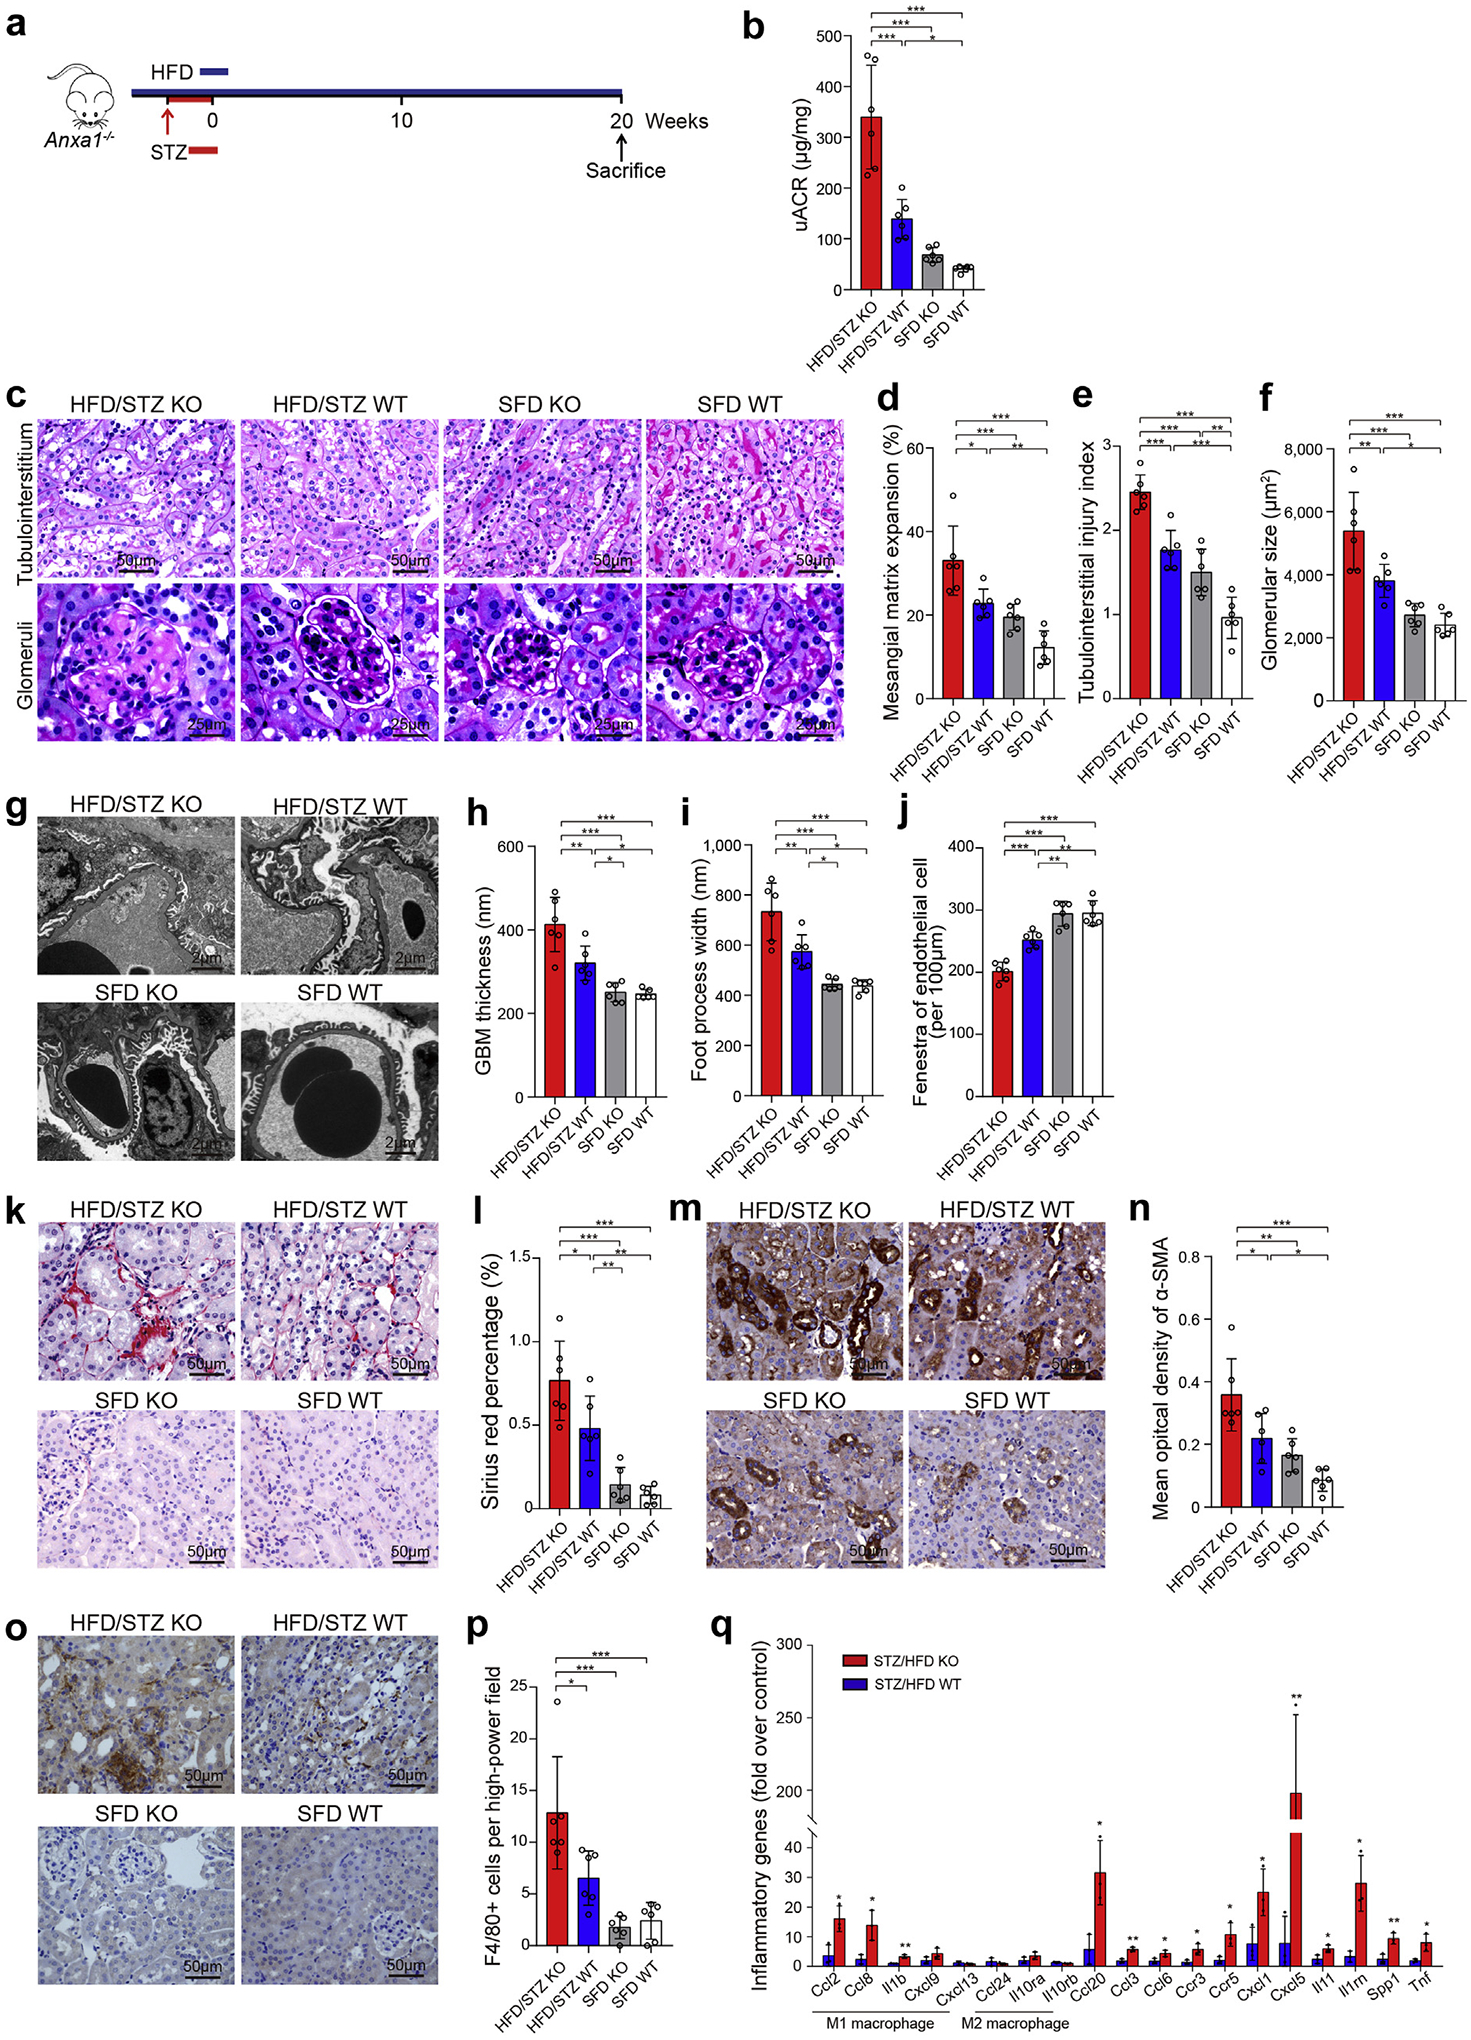
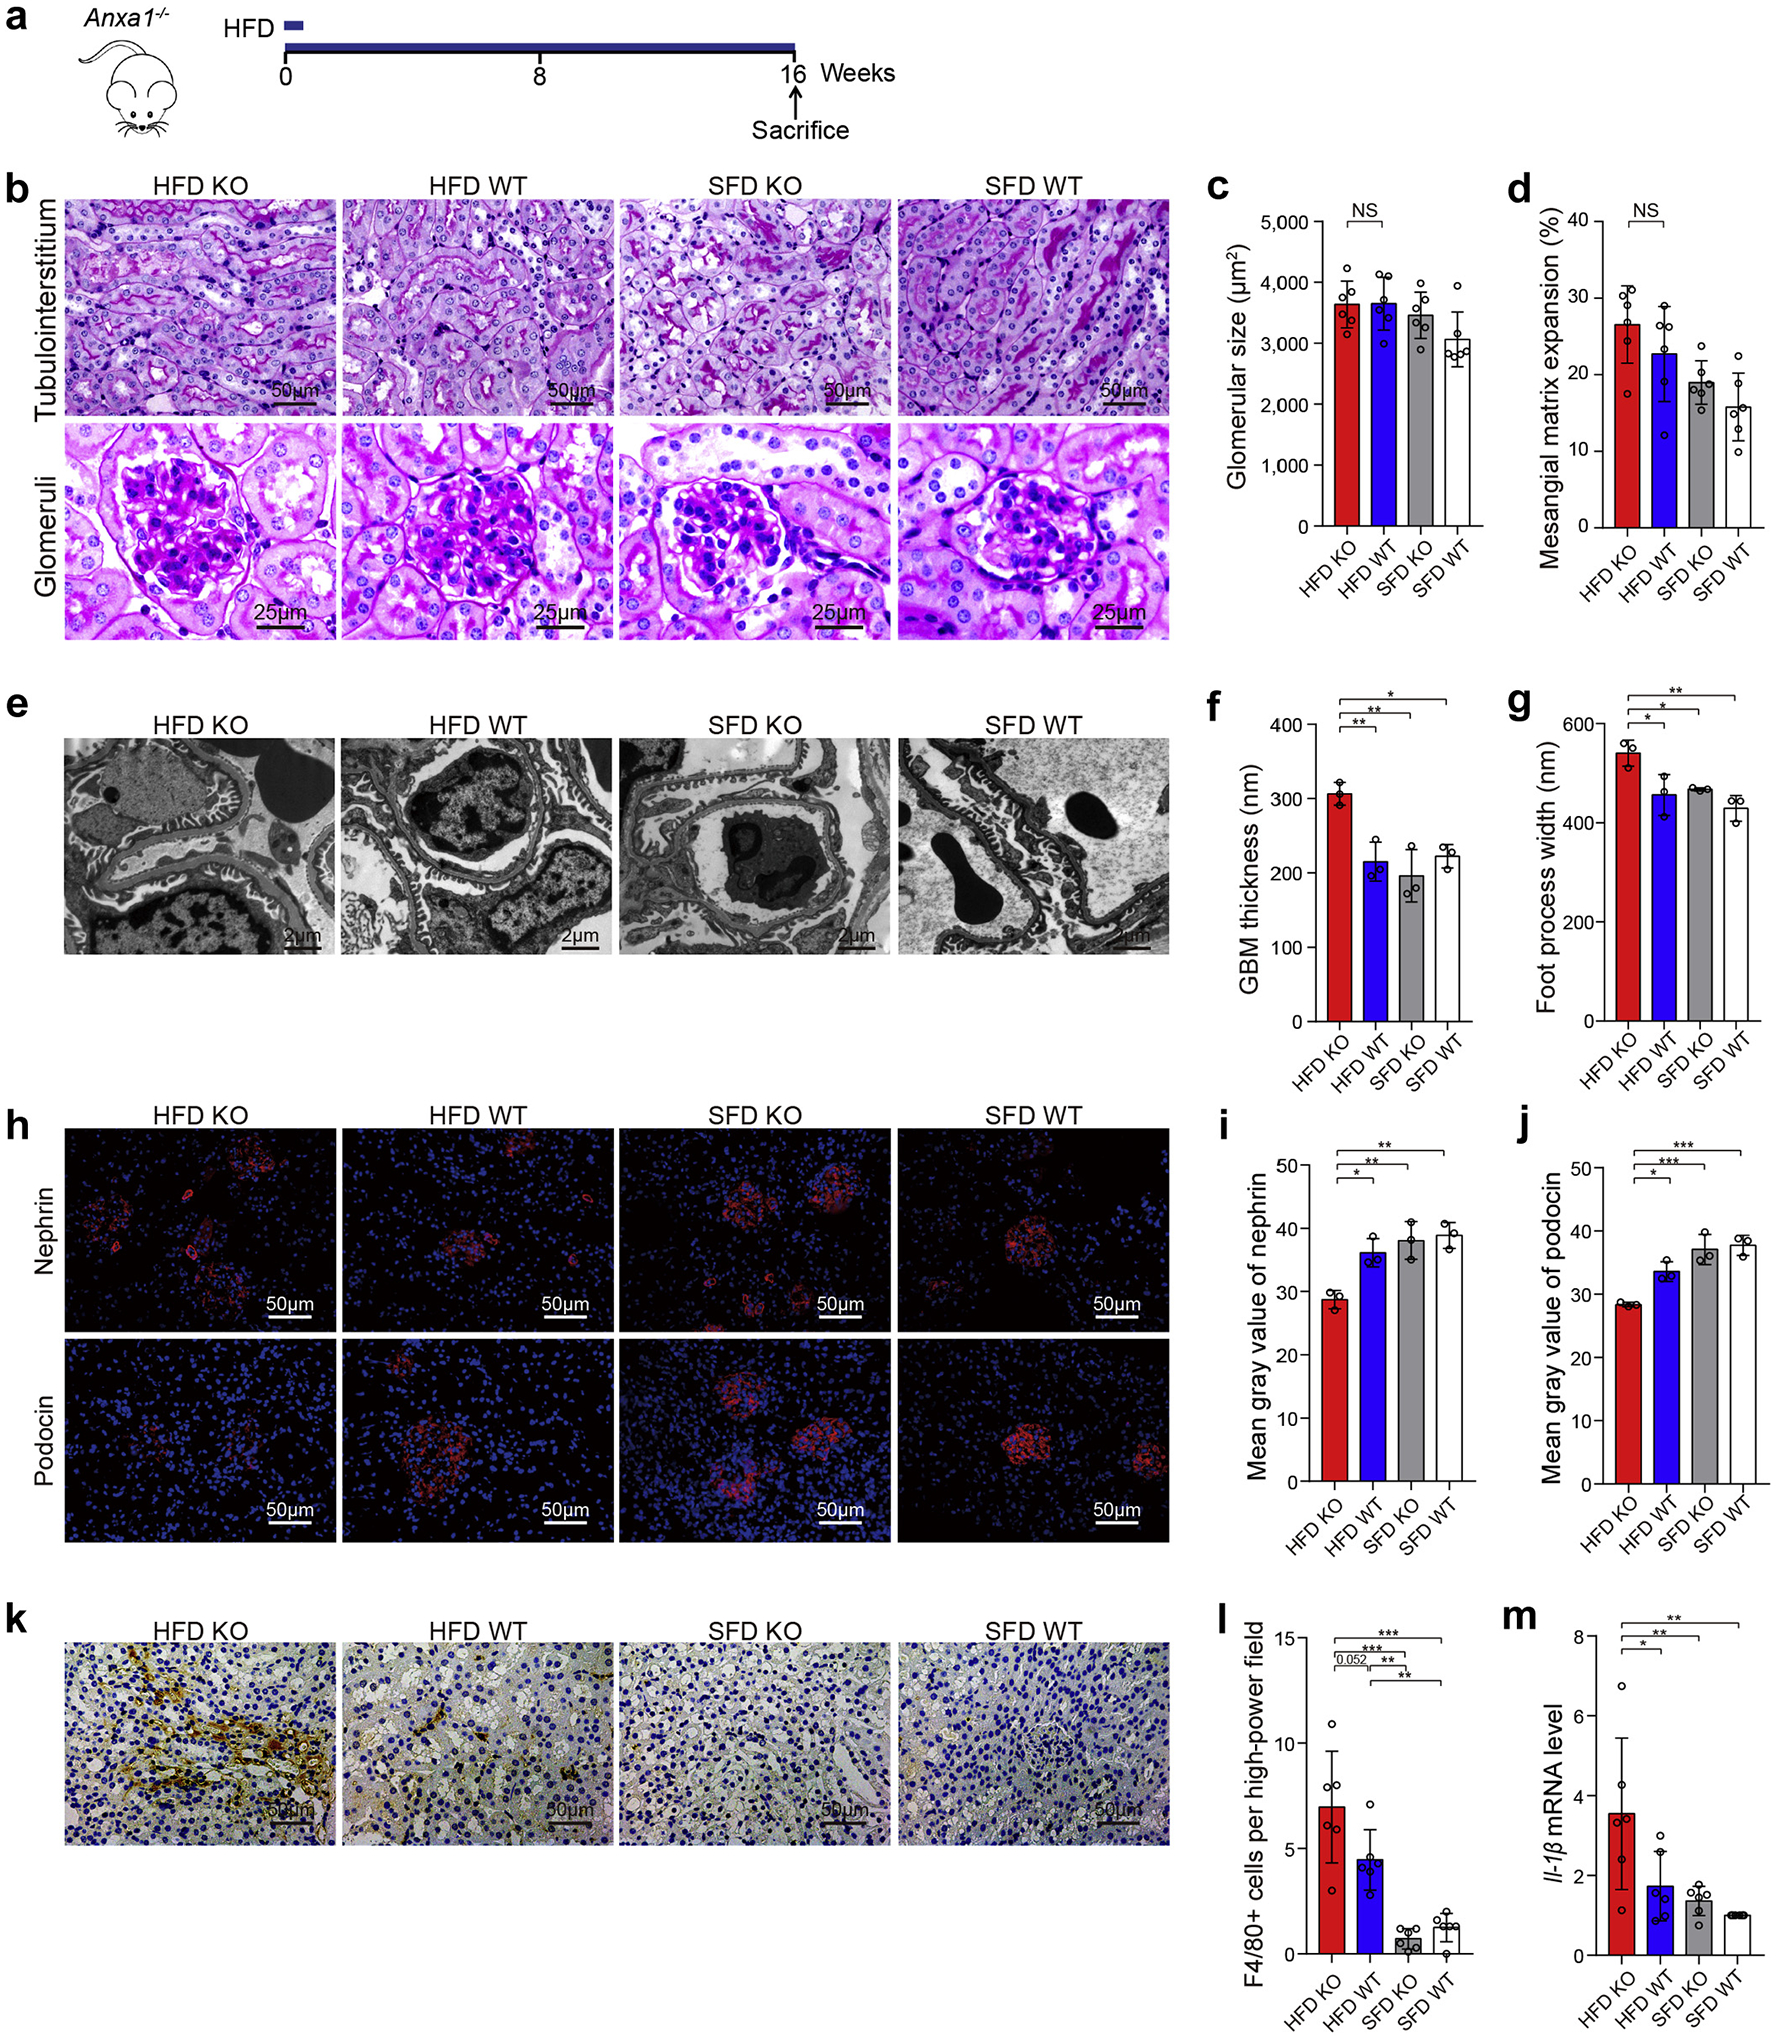
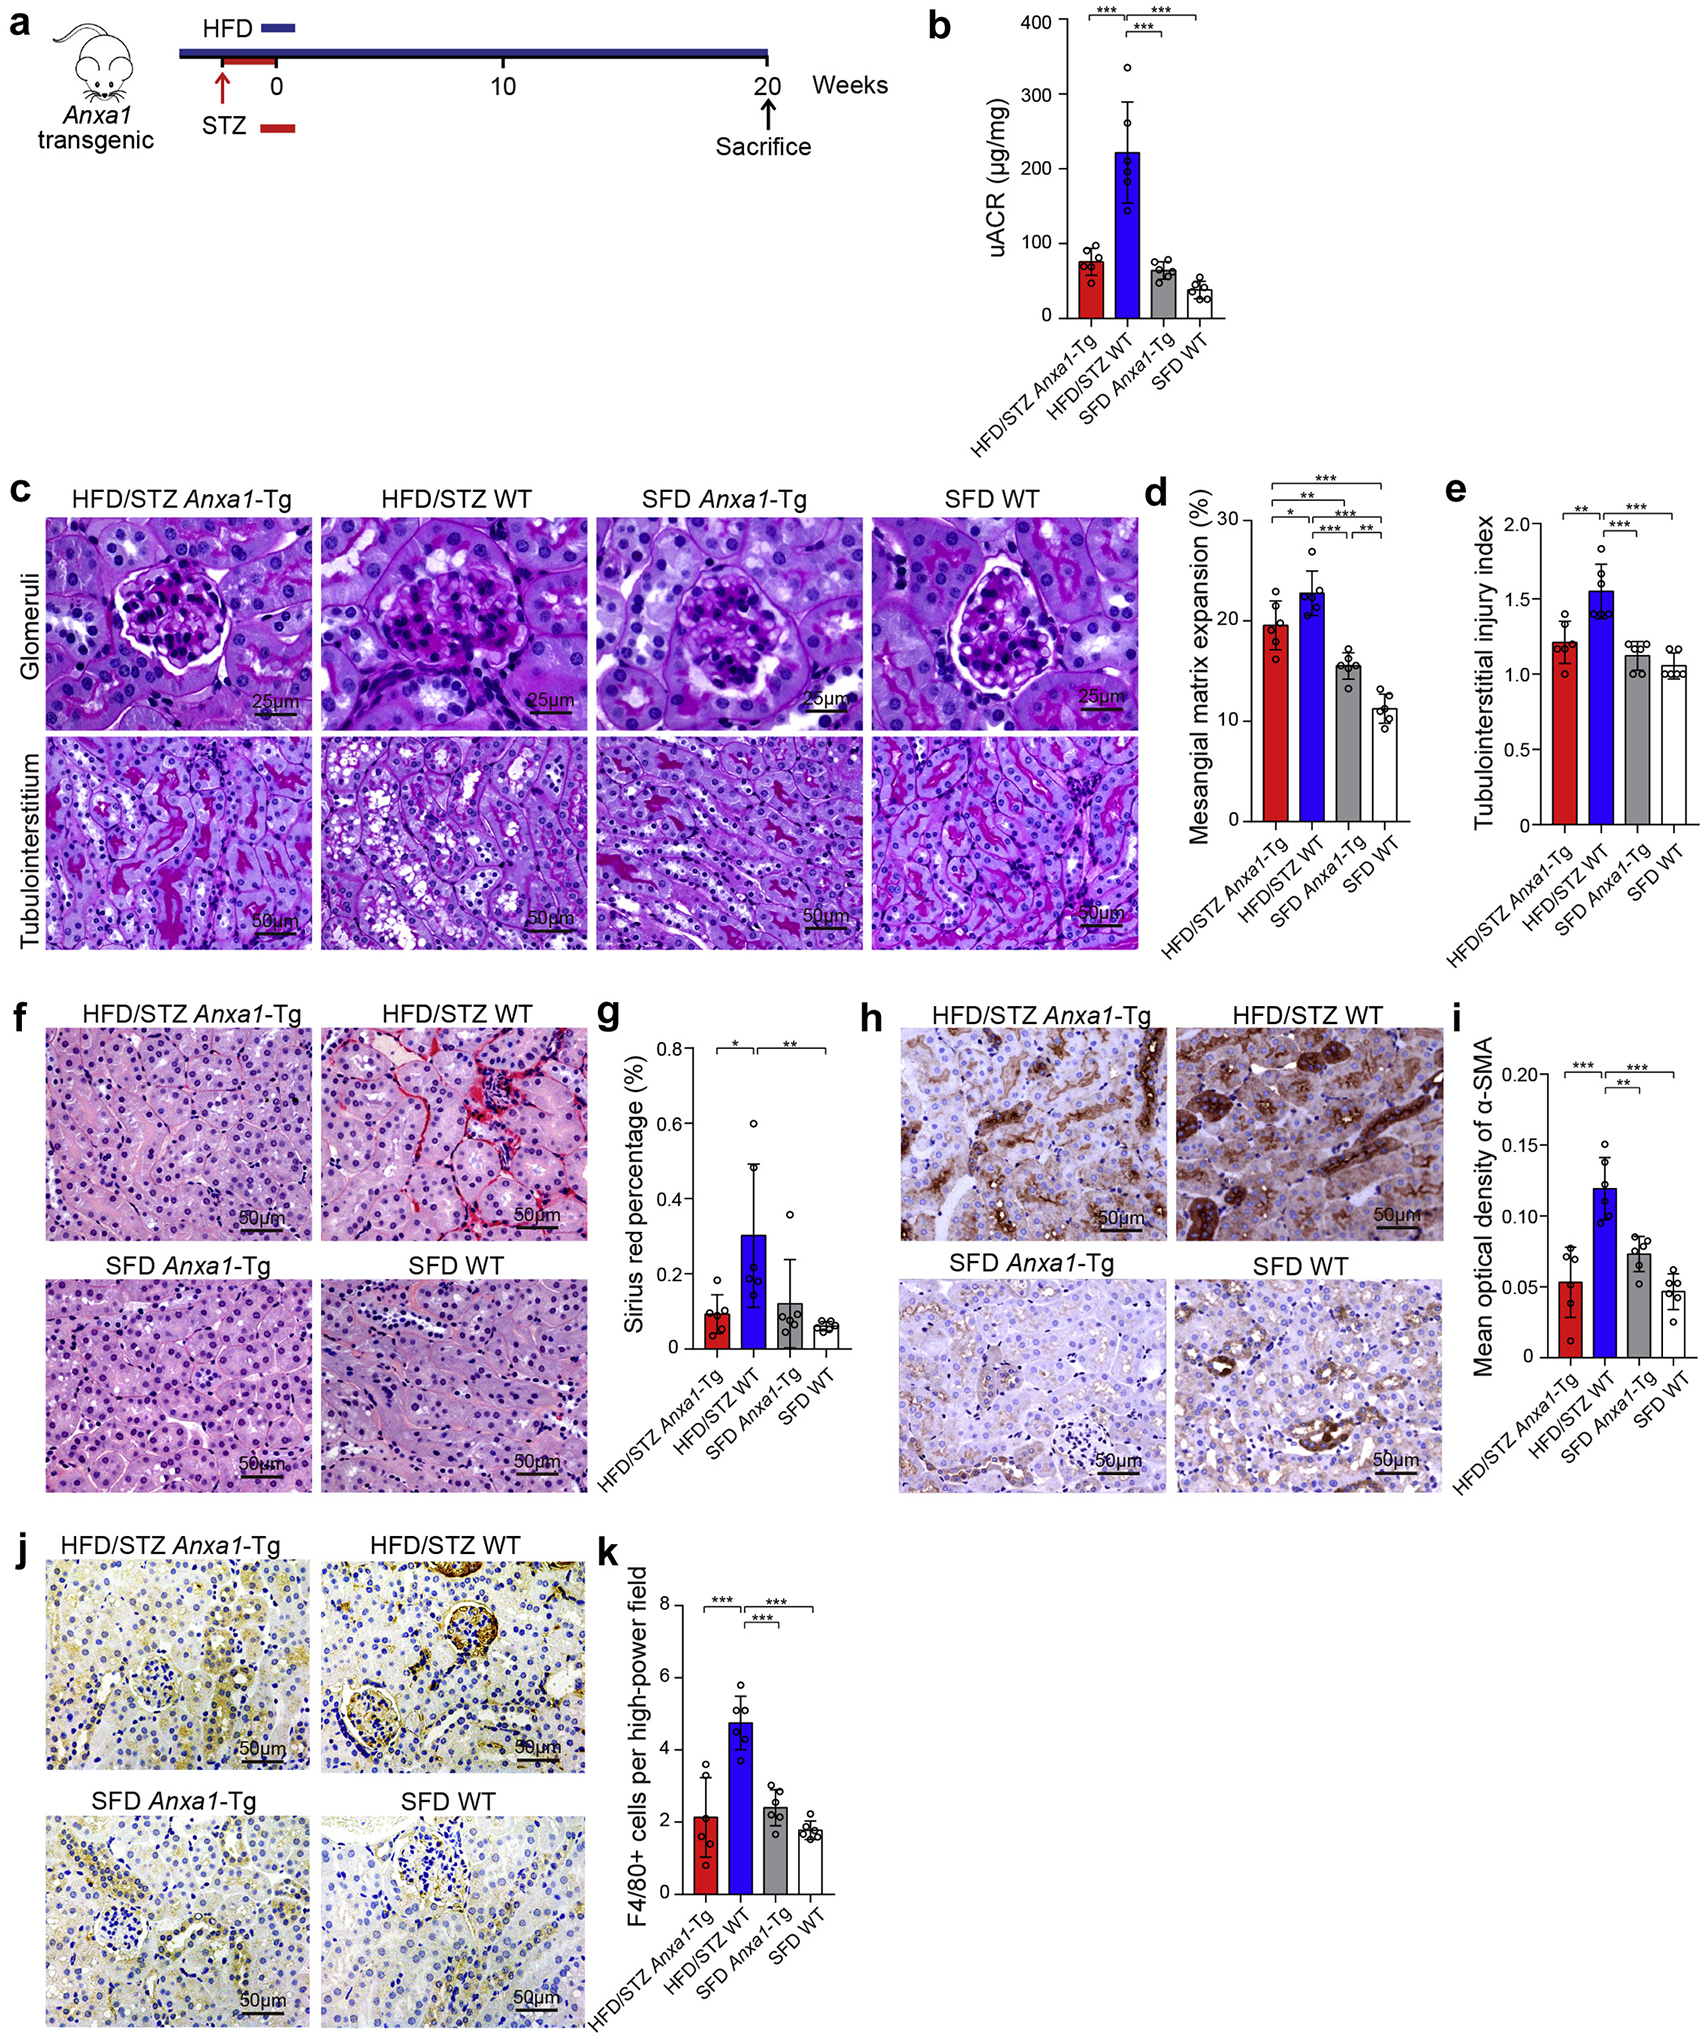
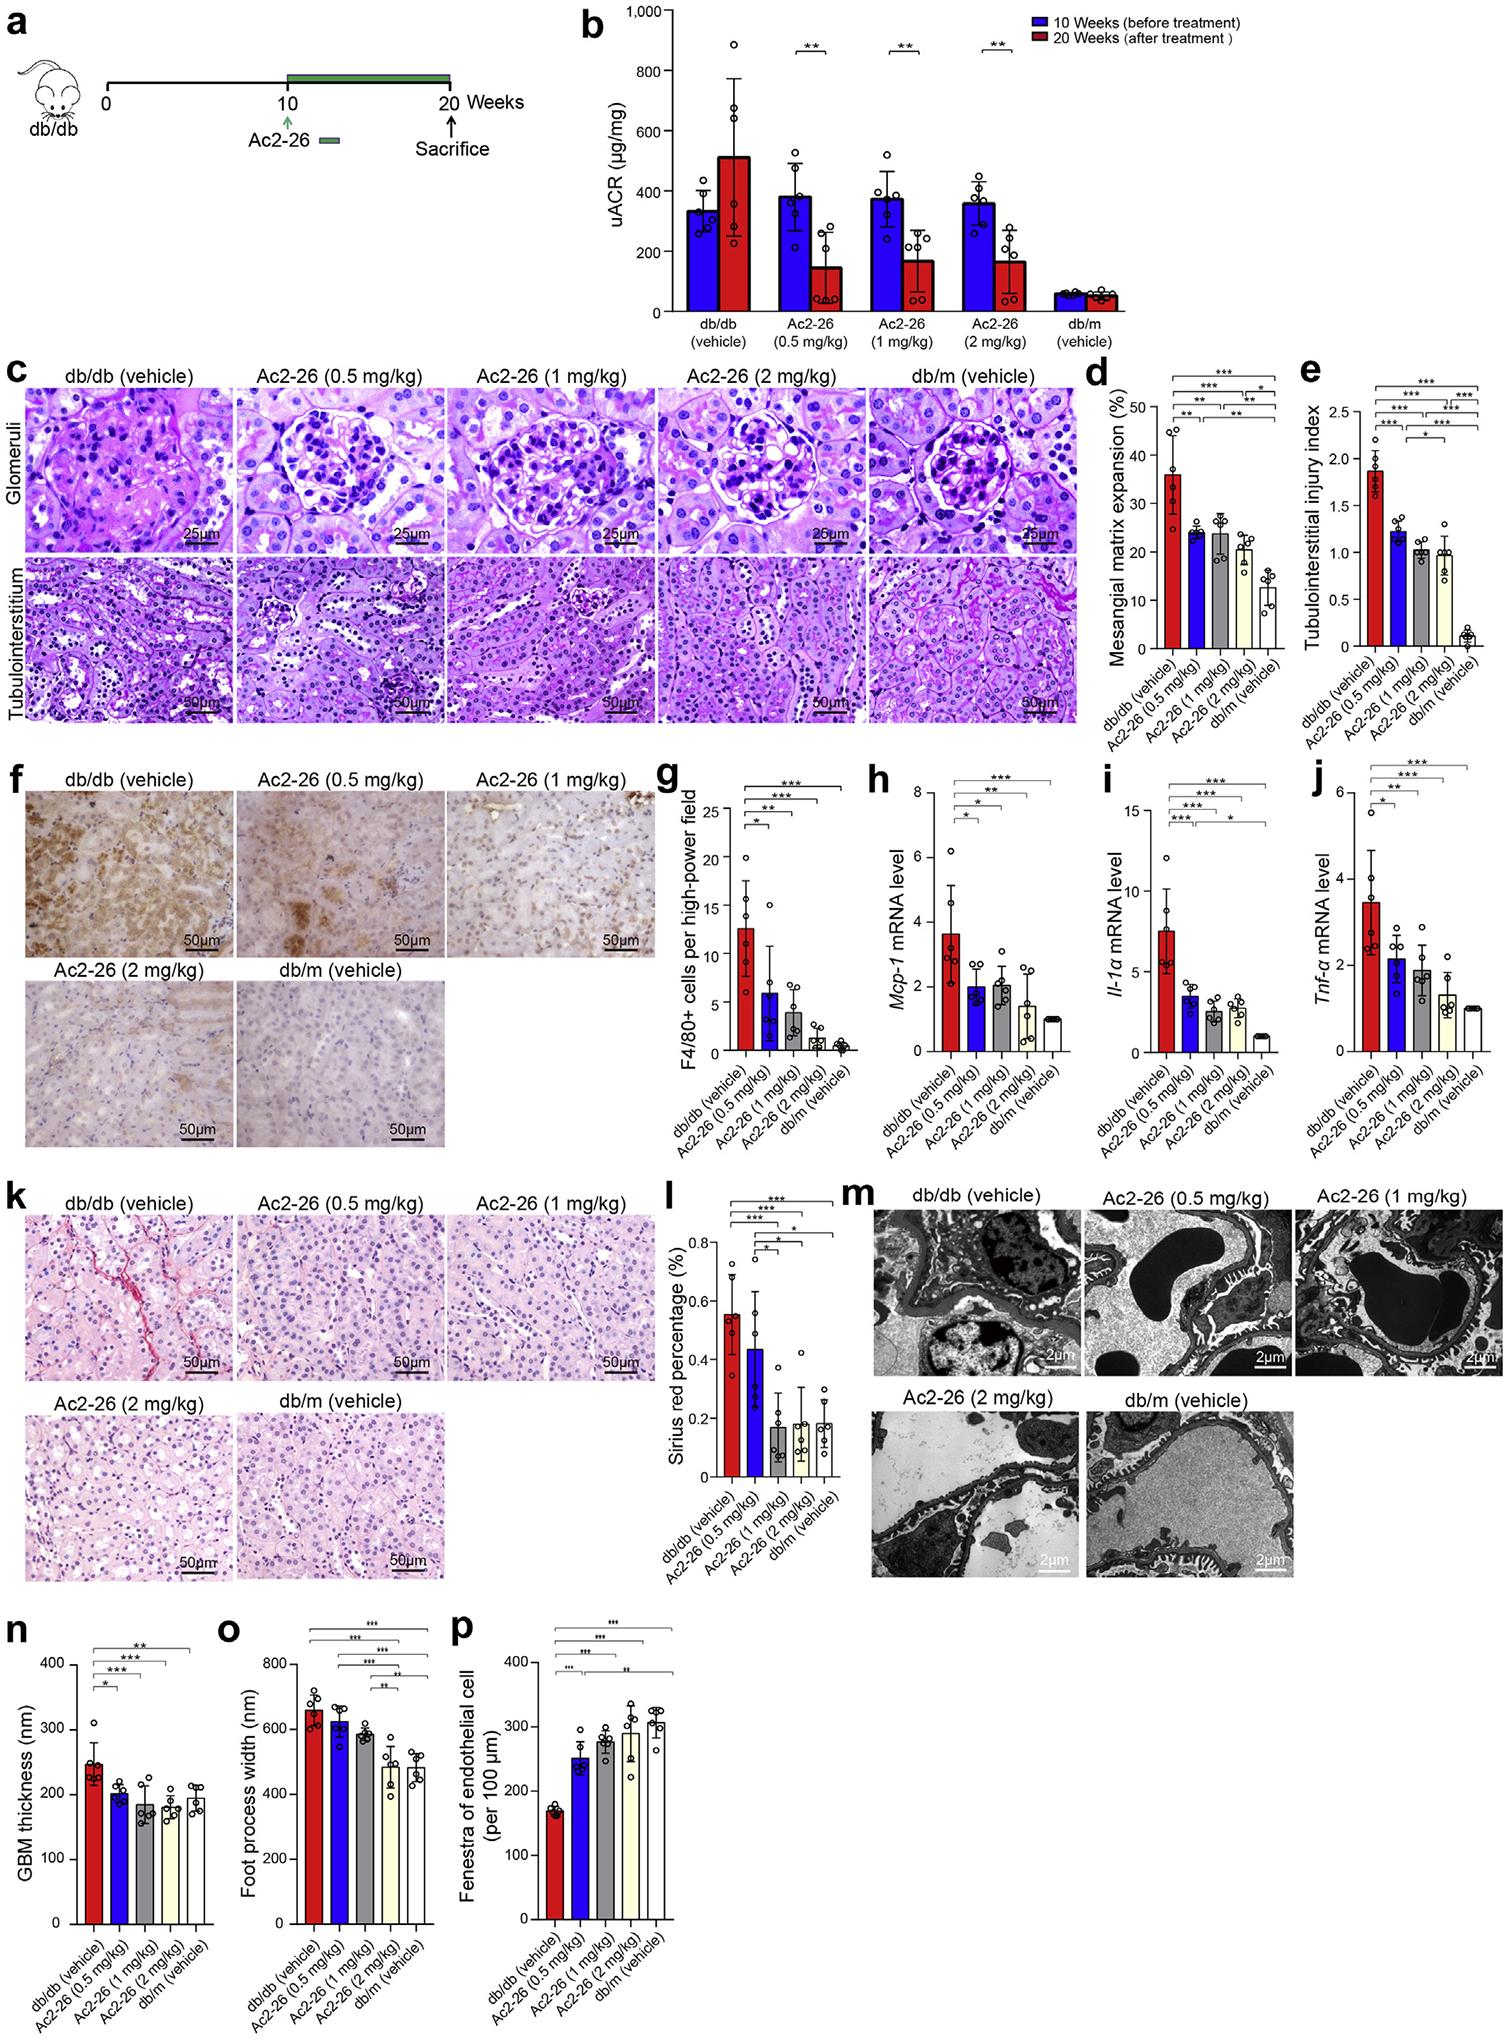
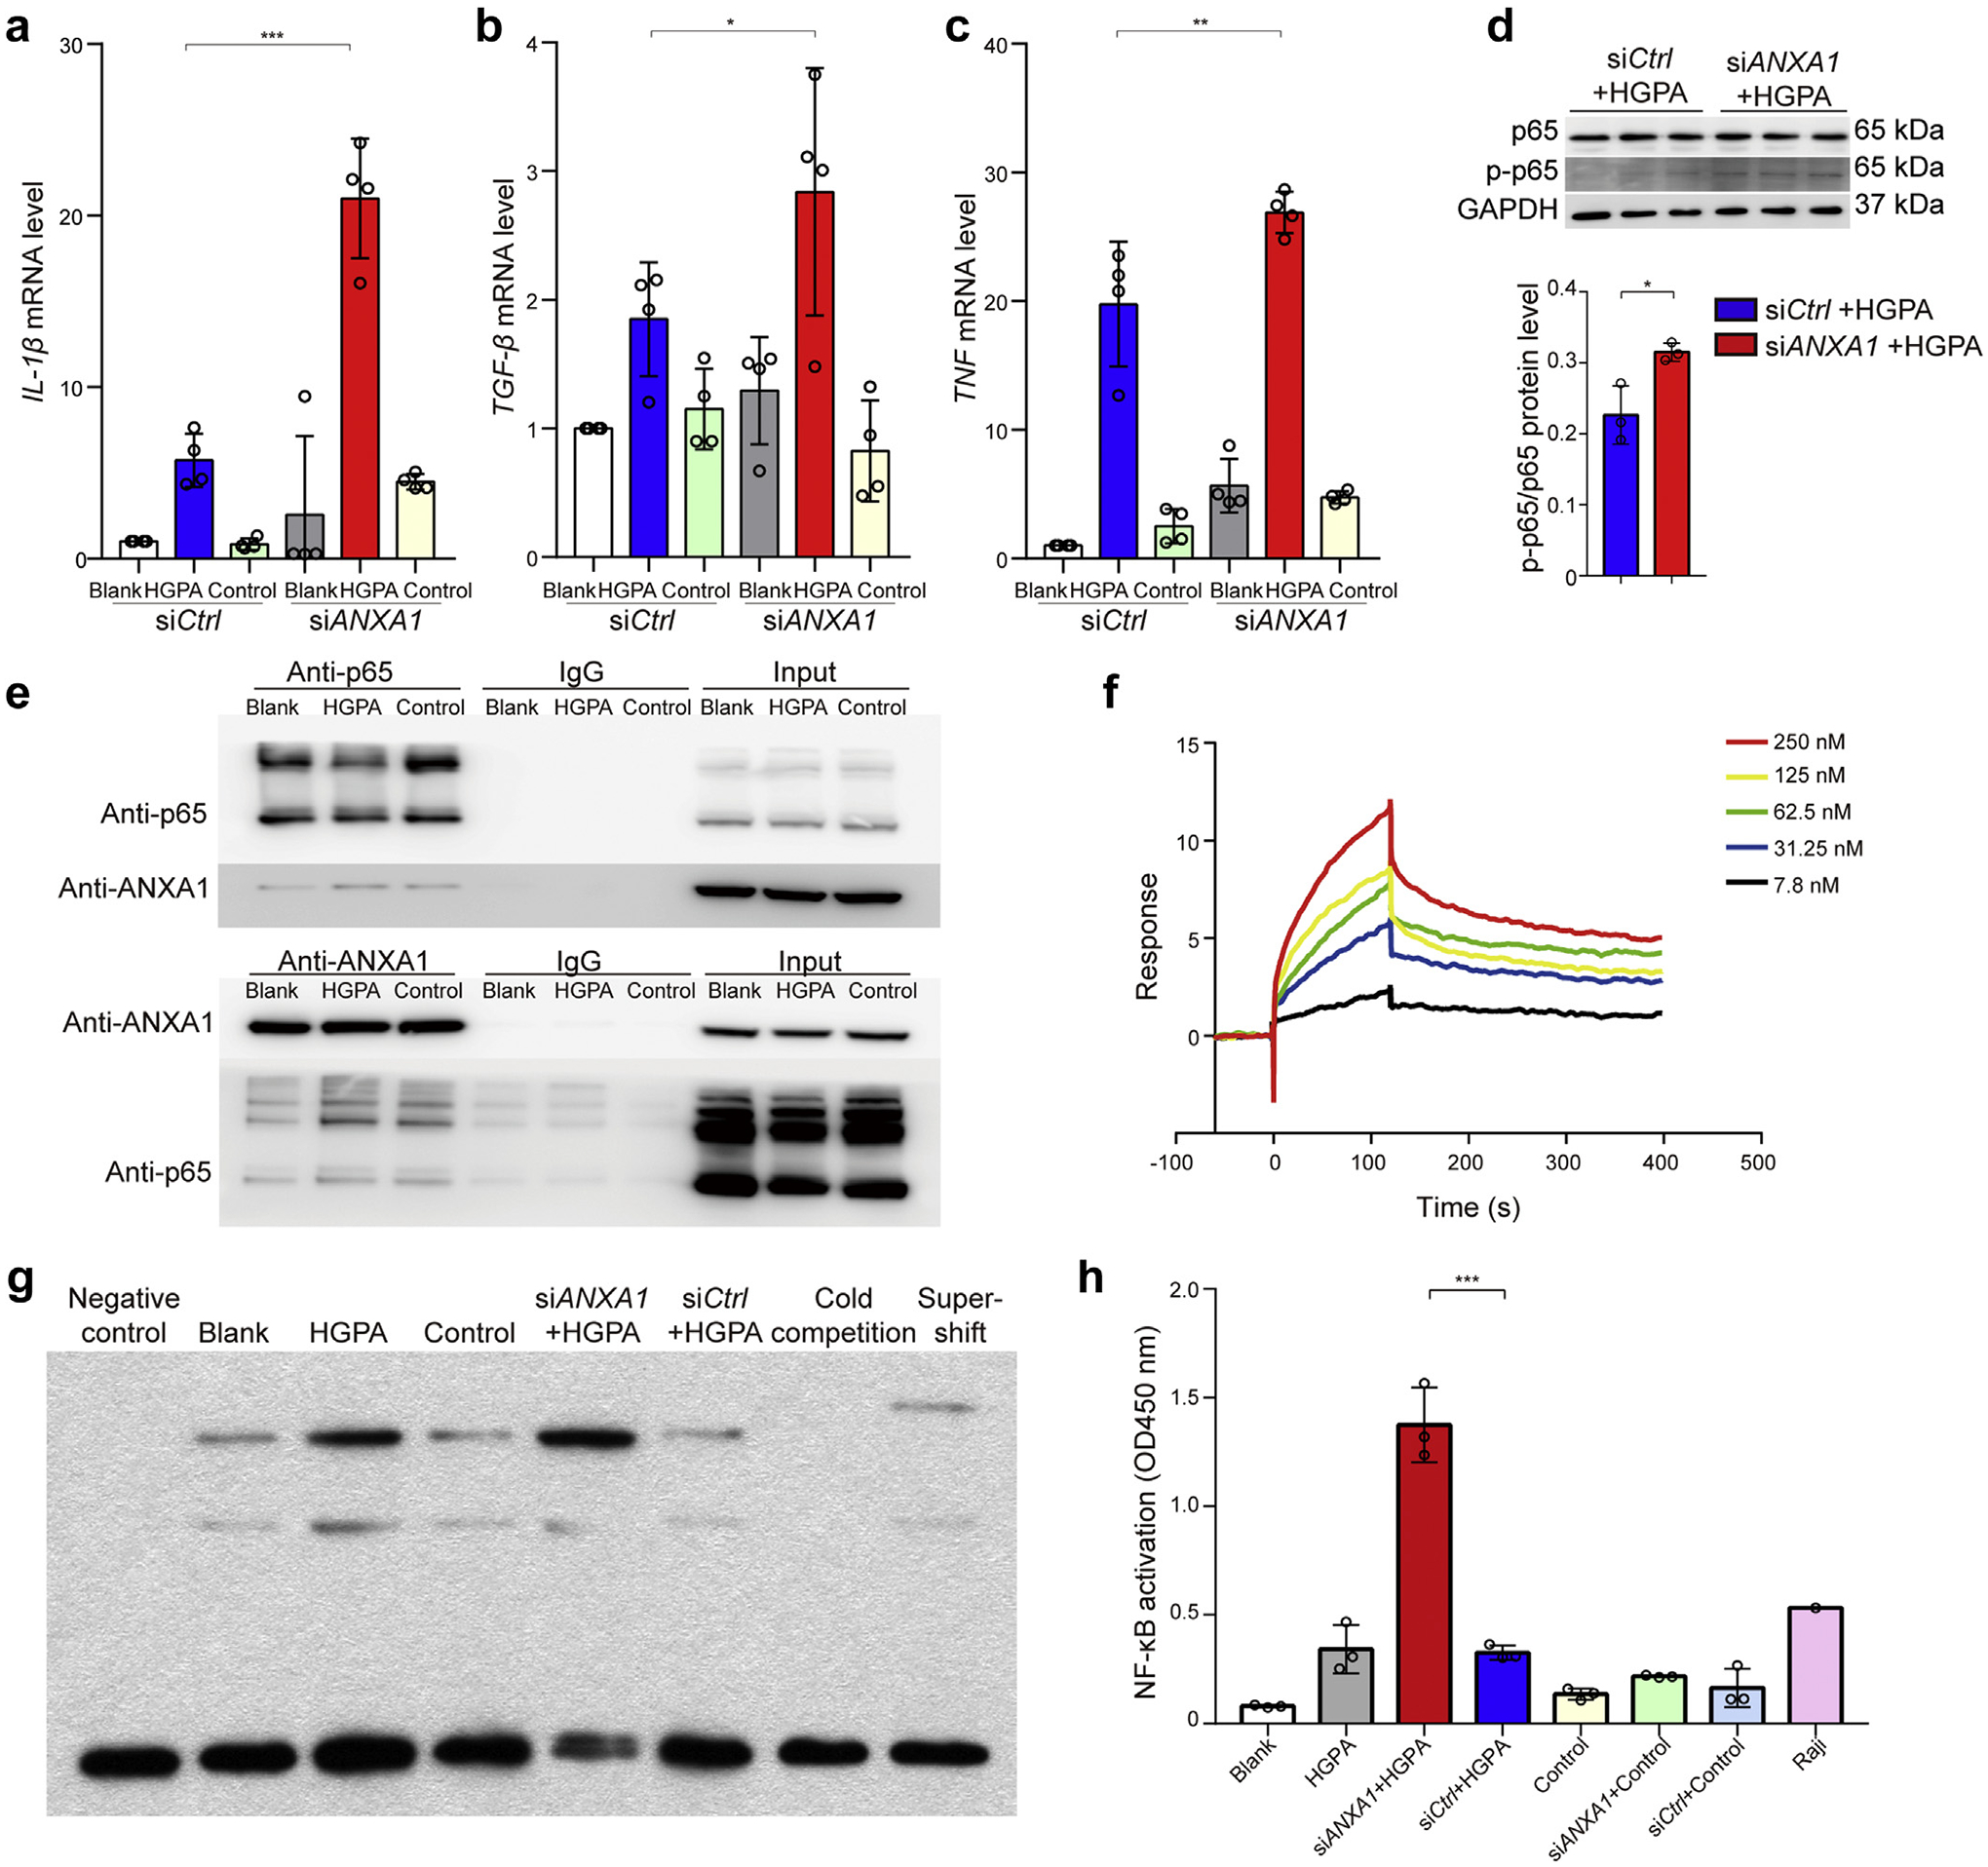
Since failed resolution of inflammation is a major contributor to the progression of diabetic nephropathy, identifying endogenously generated molecules that promote the physiological resolution of inflammation may be a promising therapeutic approach for this disease. Annexin A1 (ANXA1), as an endogenous mediator, plays an important role in resolving inflammation. Whether ANXA1 could affect established diabetic nephropathy through modulating inflammatory states remains largely unknown. In the current study, we found that in patients with diabetic nephropathy, the levels of ANXA1 were upregulated in kidneys, and correlated with kidney function as well as kidney outcomes. Therefore, the role of endogenous ANXA1 in mouse models of diabetic nephropathy was further evaluated. ANXA1 deficiency exacerbated kidney injuries, exhibiting more severe albuminuria, mesangial matrix expansion, tubulointerstitial lesions, kidney inflammation and fibrosis in high fat diet/streptozotocin-induced-diabetic mice. Consistently, ANXA1 overexpression ameliorated kidney injuries in mice with diabetic nephropathy. Additionally, we found Ac2-26 (an ANXA1 mimetic peptide) had therapeutic potential for alleviating kidney injuries in db/db mice and diabetic Anxa1 knockout mice. Mechanistic studies demonstrated that intracellular ANXA1 bound to the transcription factor NF-κB p65 subunit, inhibiting its activation thereby modulating the inflammatory state. Thus, our data indicate that ANXA1 may be a promising therapeutic approach to treating and reversing diabetic nephropathy.

Keywords: Ac2-26; annexin A1; diabetic nephropathy; proresolution.


Figures

Figure 1 |
Figure 1 |. Annexin A1 (ANXA1) in kidney biopsies from patients with diabetic nephropathy (DN).
(a) Representative images of ANXA1 staining in human kidney cortical tissue, in the glomeruli and tubulointerstitium from DN and control in the Chinese cohort. Bars = 50 μm. (b) Glomerular ANXA1 staining in DN patients (n = 30) was significantly higher than that in controls (n = 7). (c) Tubulointerstitial ANXA1 staining in DN patients (n = 30) was significantly higher than that in controls (n = 7). Tubulointerstitial ANXA1 expression was positively correlated with (d) serum creatinine (Scr) and (e) 24-hour urinary protein in DN patients. (f) Tubulointerstitial ANXA1 expression was negatively correlated with estimated glomerular filtration rate (eGFR) in DN patients. (g) Glomerular ANXA1 expression was negatively correlated with the percentage of glomerulosclerosis. (h) Representative confocal microscopic images showed the expression of ANXA1 in macrophages (cluster of differentiation [CD] 68), proximal tubule epithelial cells (aquaporin 1 [AQP-1]), and podocytes (podocalyxin) in kidneys from DN. Bars = 50 μm. Data analyses were performed by Mann-Whitney U test for 2 groups. Correlations were determined by Spearman analysis. Data are expressed as median (interquartile range). **P < 0.01, and ***P < 0.001. DAPI, 4′,6-diamidino-2-phenylindole; HC, healthy control. To optimize viewing of this image, please see the online version of this article at www.kidney-international.org.
Figure 2 |
Figure 2 |. Annexin A1 (Anxa1) knockout (KO) aggravated nephropathy in high-fat diet (HFD) plus streptozotocin (STZ)-induced diabetic nephropathy mice.
(a) Study design overview. Eight-week-old Anxa1 KO mice were fed with an HFD for 1 month, followed by i.p. injection of 50 mg/kg STZ for 5 days. Mice were maintained for 20 weeks of HFD feeding before sacrifice. n = 6 per group. (b) Four groups were evaluated for urine albumin-to-creatinine ratio (uACR). (c) Representative photomicrographs of periodic acid–Schiff staining. Bar = 50 μm for tubulointerstitium and 25 μm for glomeruli. Quantification showing (d) mesangial matrix expansion, (e) tubulointerstitial injury index, and (f) glomerular size. (g) Representative photomicrographs of transmission electron microscopy. Bars = 2 μm. Quantification of (h) mean glomerular basement membrane (GBM) thickness, (i) mean foot process width, and (j) endothelial fenestrations in 4 groups. (k) Representative photomicrographs of Sirius red. Bars = 50 μm. (l) Quantitative analysis of Sirius red. (m) Representative photomicrographs of α-smooth muscle actin (α-SMA). Bars = 50 μm. (n) Quantitative analysis of α-SMA. (o) Representative photomicrographs of F4/80 staining. Bars = 50 μm. (p) Quantitative analysis of F4/80 staining. (q) Quantification of inflammatory gene expression by polymerase chain reaction array, HFD/STZ Anxa1 KO versus HFD/STZ wild-type (WT) mice (n = 3). Throughout, data analyses were performed by Student t test for 2 groups and 2-way analysis of variance, followed by a Tukey test, for 4 groups. Data are expressed as mean ± SD. *P < 0.05, **P < 0.01, and ***P < 0.001. SFD, standard fat diet. To optimize viewing of this image, please see the online version of this article at www.kidney-international.org.
Figure 3 |
Figure 3 |. Annexin A1 (Anxa1) knockout (KO) caused kidney injuries in high-fat diet (HFD)–induced diabetic mice.
(a) Study design overview. Anxa1 KO mice were maintained for 16 weeks of HFD feeding. (b) Representative photomicrographs showing typical tubulointerstitial (bars = 50 μm) and glomerular structure (bars = 25 μm) in control and diabetic mice. Quantification showing (c) glomerular size and (d) mesangial matrix expansion (n = 6). (e) Representative transmission electron microscopy images in kidney cortex tissue isolated from diabetic Anxa1 KO and wild-type (WT) mice as well as nondiabetic mice. Bars = 2 μm. Quantification of (f) mean glomerular basement membrane (GBM) thickness and (g) mean foot process width in 4 groups (n = 3). (h) Representative microscopic images showing the expressions of nephrin and podocin in the kidney from different groups of mice. Bars = 50 μm. Quantitative analysis of (i) nephrin and (j) podocin (n = 3). (k) Representative photomicrographs of F4/80 staining. Bars = 50 μm. (l) Quantitative analysis of F4/80 staining. (m) Quantification of Il-1β gene expression by real-time polymerase chain reaction among 4 groups (n = 6). Throughout, data analyses were performed by 2-way analysis of variance, followed by a Tukey test, for 4 groups and expressed as mean ± SD. *P < 0.05, **P < 0.01, and ***P < 0.001. SFD, standard fat diet. To optimize viewing of this image, please see the online version of this article at www.kidney-international.org.
Figure 4 |
Figure 4 |. Overexpression of annexin A1 (Anxa1) suppresses diabetic nephropathy.
(a) Study design overview. Anxa1 transgenic (Anxa1-Tg) mice and wild-type (WT) mice were fed with a high-fat diet (HFD) for 1 month, followed by a daily i.p. injection of 50 mg/kg streptozotocin (STZ) for 5 days. Mice were maintained for 20 weeks on an HFD before sacrifice. n = 6 per group. (b) Urine albumin-to-creatinine ratio (uACR) in 4 groups. (c) Representative photomicrographs of periodic acid–Schiff staining. Bars = 50 μm for tubulointerstitium and 25 μm for glomeruli. Quantification showing (d) mesangial matrix expansion and (e) tubulointerstitial injury index. (f) Representative photomicrographs of Sirius red. Bars = 50 μm. (g) Quantitative analysis of Sirius red. (h) Representative photomicrographs of α-smooth muscle actin (α-SMA). Bars = 50 μm. (i) Quantitative analysis of α-SMA. (j) Representative photomicrographs of F4/80 staining. Bars = 50 μm. (k) Quantitative analysis of F4/80 staining. Data represent mean ± SD. Data analyses were performed by 2-way analysis of variance, followed by a Tukey test, for 4 groups. *P < 0.05, **P < 0.01, and ***P < 0.001. SFD, standard fat diet. To optimize viewing of this image, please see the online version of this article at www.kidney-international.org.
Figure 5 |
Figure 5 |. Ac2-26 administration treats established nephropathy in db/db mice.
(a) Ac2-26 treatment protocol for db/db mice. Diabetic db/db mice were allowed to progress for 10 weeks, after which the subgroups of diabetic mice were administered different concentrations of Ac2-26 (0.5, 1, or 2 mg/kg), or phosphate-buffered saline every 2 days i.p. from weeks 10 to 20. n = 6 per group. (b) The levels of urine albumin-to-creatinine ratio (uACR) at 10 and 20 weeks (n = 6). (c) Representative photomicrographs of periodic acid–Schiff staining. Bars = 50 μm for tubulointerstitium and 25 μm for glomeruli. Quantification showing (d) mesangial matrix expansion and (e) tubulointerstitial injury index. (f) Representative photomicrographs of F4/80 staining. Bars = 50 μm. (g) Quantitative analysis of F4/80 staining. Quantification of (h) Mcp-1, (i) Il-1α, and (j) Tnf-α gene expression by real-time polymerase chain reaction among 4 groups. (k) Representative photomicrographs of Sirius red. Bars = 50 μm. (l) Quantitative analysis of Sirius red. (m) Representative transmission electron microscopy images. Bars = 2 μm. Quantification of (n) mean glomerular basement membrane (GBM) thickness, (o) foot process width, and (p) endothelial fenestrations (n = 6). Data analyses were performed by Student t test for 2 groups and 1-way analysis of variance, followed by a Tukey test, for multiple groups. *P < 0.05, **P < 0.01, and ***P < 0.001. To optimize viewing of this image, please see the online version of this article at www.kidney-international.org.
Figure 6 |
Figure 6 |. Annexin A1 (ANXA1) binds to the p65 subunit of nuclear factor (NF)–κB and inhibits its activation in HK-2 cells.
Quantitative real-time polymerase chain reaction analyzed (a) Il-1β, (b) TGF-β, and (c) TNF mRNA level in HK-2 cells transfected with ANXA1 small, interfering RNA (siRNA) under high glucose plus palmitic acid (HGPA) conditions. n = 4 per group. (d) Top: Representative Western blot images. Bottom: Analyses of phosphorylated p65 (p-p65) and p65 in HK-2 cells with treatment. n = 3 per group. (e) Top: Total protein lysates of HK-2 cells treated with HGPA or siRNA against ANXA1 (siANXA1) were immunoprecipitated using an antibody against the p65 subunit of NF-κB and immunoblotted (IB) against ANXA1. Bottom: Total protein lysates of HK-2 cells treated with HGPA or siANXA1 were immunoprecipitated using an antibody against ANXA1 and IB against the p65 subunit of NF-κB. (f) The surface plasmon resonance (SPR) curves generated from ANXA1 binding to p65. The ANXA1 protein concentration ranged from 7.8 to 250 nM. The apparent dissociation constants for the interaction were obtained from fitting the SPR response curves to a simple 1:1 Langmuir binding model. (g) Electrophoretic mobility shift assay showed the binding of NF-κB to the DNA probe in HK-2 cells under different treatments. (h) Enzyme-linked immunosorbent assay showed the NF-κB activity as indicated. n = 3 per group. Data analysis was performed by Student t test for 2 groups and 2-way analysis of variance, followed by a Tukey test, for multiple groups and expressed as mean ± SD. The blank group served as the normal control group. The control group served as the isotonic solvent control group using mannitol and endotoxin-free bovine serum albumin. *P < 0.05, **P < 0.01, and ***P < 0.001. GAPDH, glyceraldehyde 3-phosphate dehydrogenase; siCtrl, negative control siRNA.

References

    1. Pradhan AD, Manson JE, Rifai N, et al. C-reactive protein, interleukin 6, and risk of developing type 2 diabetes mellitus. JAMA. 2001;286:327–334. - PubMed
    1. Hu FB, Meigs JB, Li TY, et al. Inflammatory markers and risk of developing type 2 diabetes in women. Diabetes. 2004;53:693–700. - PubMed
    1. Serhan CN, Yacoubian S, Yang R. Anti-inflammatory and proresolving lipid mediators. Annu Rev Pathol. 2008;3:279–312. - PMC - PubMed
    1. Flower RJ, Blackwell GJ. Anti-inflammatory steroids induce biosynthesis of a phospholipase A2 inhibitor which prevents prostaglandin generation. Nature. 1979;278:456–459. - PubMed
    1. Purvis GSD, Collino M, Loiola RA, et al. Identification of AnnexinA1 as an endogenous regulator of RhoA, and its role in the pathophysiology and experimental therapy of type-2 diabetes. Front Immunol. 2019;10:571. - PMC - PubMed

Publication types