. 2021 Jun:139:50-65.
doi: 10.1016/j.tpb.2021.02.002. Epub 2021 Mar 3.

Variance and limiting distribution of coalescence times in a diploid model of a consanguineous population

Affiliations

Variance and limiting distribution of coalescence times in a diploid model of a consanguineous population

Alissa L Severson et al. Theor Popul Biol. 2021 Jun.

Abstract

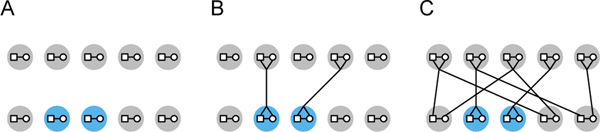
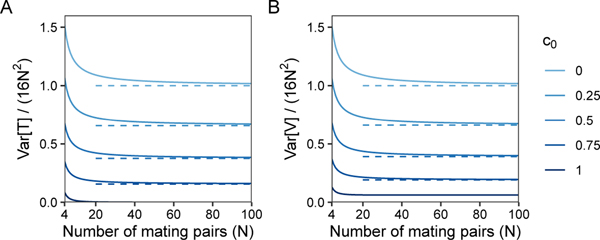
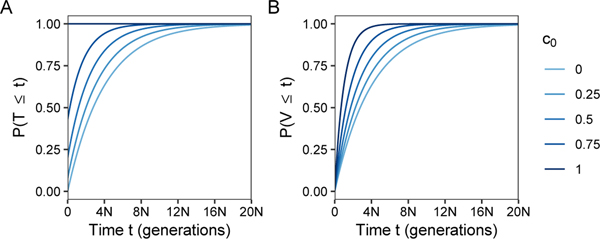
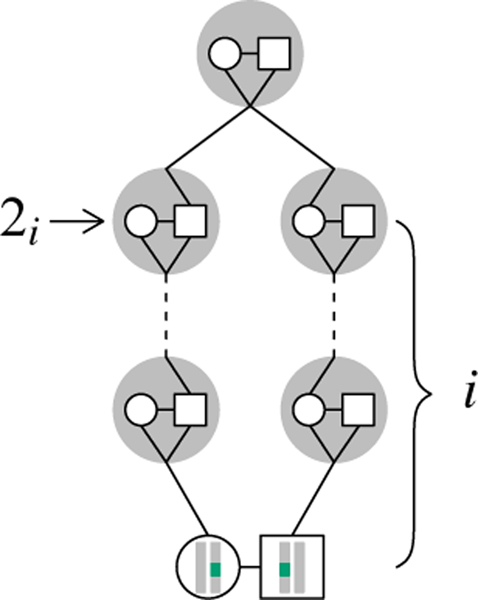
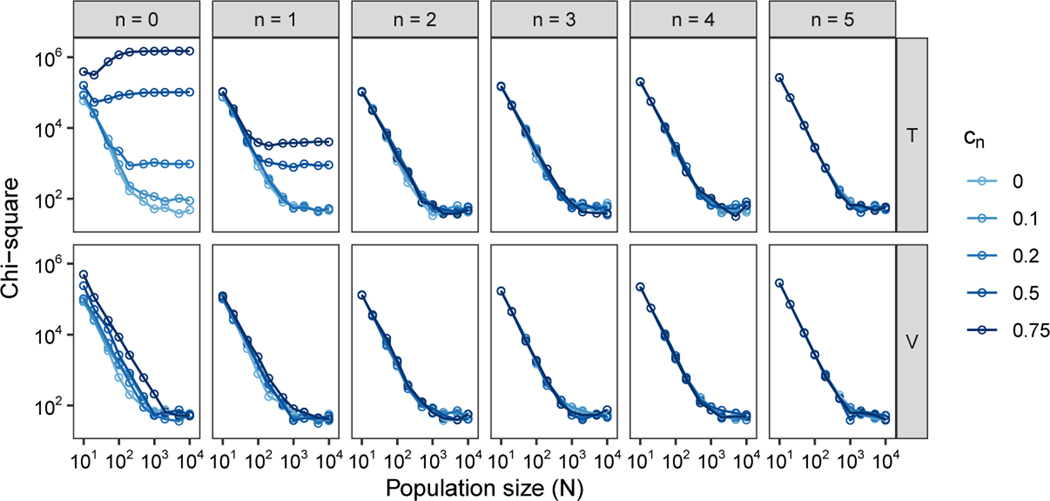
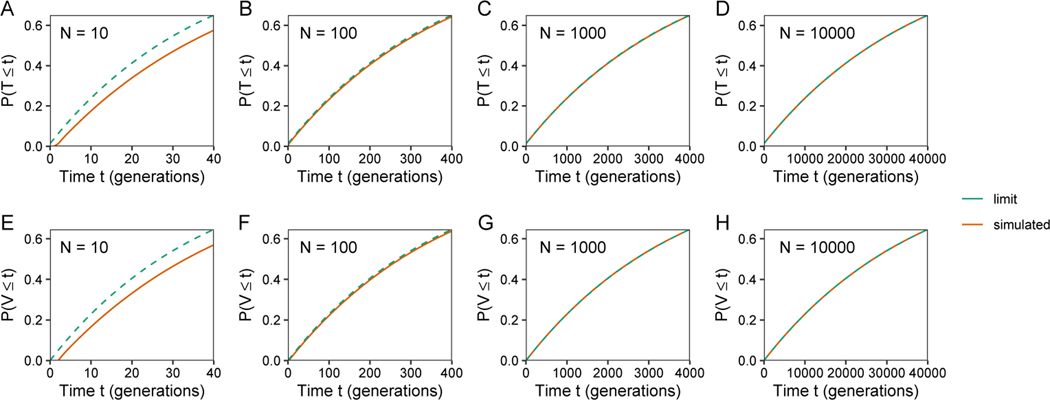
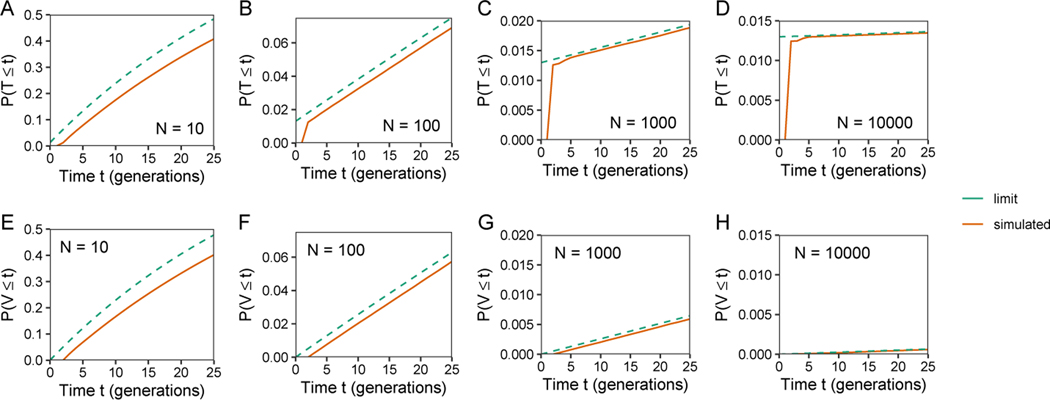
Recent modeling studies interested in runs of homozygosity (ROH) and identity by descent (IBD) have sought to connect these properties of genomic sharing to pairwise coalescence times. Here, we examine a variety of features of pairwise coalescence times in models that consider consanguinity. In particular, we extend a recent diploid analysis of mean coalescence times for lineage pairs within and between individuals in a consanguineous population to derive the variance of coalescence times, studying its dependence on the frequency of consanguinity and the kinship coefficient of consanguineous relationships. We also introduce a separation-of-time-scales approach that treats consanguinity models analogously to mathematically similar phenomena such as partial selfing, using this approach to obtain coalescence-time distributions. This approach shows that the consanguinity model behaves similarly to a standard coalescent, scaling population size by a factor 1-3c, where c represents the kinship coefficient of a randomly chosen mating pair. It provides the explanation for an earlier result describing mean coalescence time in the consanguinity model in terms of c. The results extend the potential to make predictions about ROH and IBD in relation to demographic parameters of diploid populations.

Keywords: Coalescent; Consanguinity; Separation-of-time-scales.


Conflict of interest statement

Declaration of Competing Interest The authors declare that they have no known competing financial interests or personal relationships that could have appeared to influence the work reported in this paper.

Figures

Figure 1:
Figure 1:
Diploid model of sib mating. (A) In each generation, a fraction c0 = 0.4 of N = 5 mating pairs are sib mating pairs. (B) Sib mating pairs are each assigned a parental pair from the previous generation. (C) Non-consanguineous pairs are each assigned two distinct parental pairs, representing the two sets of parents for the two individuals in the non-consanguineous pair.
Figure 2:
Figure 2:
Normalized variance of pairwise coalescence times as a function of the number of mating pairs N and the fraction of sib mating pairs c0. (A) Var[T]/(16N2), eq. 11. (B) Var[V]/(16N2), eq. 12. Dashed lines represent limiting reduction factors due to consanguinity as N,(1c0)(112c0) in (A) (eq. 13) and (134c0)2 in (B) (eq. 14).
Figure 3:
Figure 3:
The cumulative distributions of coalescence times within (T) and between (V) individuals as functions of generations t and the fraction c0 of sib mating pairs. (A) (Tt), eq. 29. (B) (Vt), eq. 30.
Figure 4:
Figure 4:
New states in the superposition model. Two alleles in two individuals who are in an ith cousin mating pair and have no closer relationship, i generations ago, are in separate mating pairs. We term their state i generations ago 2i. In the next generation back, the alleles might be in the shared ancestral mating pair, as shown. Here, i = 2.
Figure 5:
Figure 5:
Values of the chi-square test statistic comparing the limiting distributions for T and V, eqs. 47 and 48, and the simulated exact distributions. The plots consider a range of values for the number of mating pairs (N), the consanguinity rate (cn), and the degree of cousin relationship (n).
Figure 6:
Figure 6:
Limiting cumulative distribution functions for T and V, eqs. 47 and 48, and simulated exact cumulative distributions, for 4N generations. The plots consider a range of values for the number of mating pairs (N), fixing the degree of cousin relationship at n = 1 and the consanguinity rate at c1 = 0.2. (A) T, N = 10. (B) T, N = 100. (C) T, N = 1000. (D) T, N = 10000. (E) V, N = 10. (F) V, N = 100. (G) V, N = 1000. (H) V, N = 10000.
Figure 7:
Figure 7:
Limiting cumulative distribution functions for T and V, eqs. 47 and 48, and simulated exact cumulative distributions, for 25 generations. The plots consider a range of values for the number of mating pairs (N), fixing the degree of cousin relationship at n = 1 and the consanguinity rate at c1 = 0.2. (A) T, N = 10. (B) T, N = 100. (C) T, N = 1000. (D) T, N = 10000. (E) V, N = 10. (F) V, N = 100. (G) V, N = 1000. (H) V, N = 10000.

References

    1. CAMPBELL RB, 2015The effect of inbreeding constraints and offspring distribution on time to the most recent common ancestor. Journal of Theoretical Biology 382: 74–80. - PubMed
    1. CARMI S, PALAMARA PF, VACIC V, LENCZ T, DARVASI A, et al., 2013The variance of identity-by-descent sharing in the Wright-Fisher model. Genetics 193: 911–928. - PMC - PubMed
    1. CARMI S, WILTON PR, WAKELEY J, and PE’ER I, 2014A renewal theory approach to IBD sharing. Theoretical Population Biology 97: 35–48. - PMC - PubMed
    1. CHANG JT, 1999Recent common ancestors of all present-day individuals. Advances in Applied Probability 31: 1002–1026.
    1. ELDON B, and WAKELEY J, 2009Coalescence times and FST under a skewed offspring distribution among individuals in a population. Genetics 181: 615–629. - PMC - PubMed

Publication types

LinkOut - more resources