Review
. 2021 Nov:85:100956.
doi: 10.1016/j.preteyeres.2021.100956. Epub 2021 Mar 4.

Human limbal epithelial stem cell regulation, bioengineering and function

Affiliations
Review

Human limbal epithelial stem cell regulation, bioengineering and function

Clémence Bonnet et al. Prog Retin Eye Res. 2021 Nov.

Abstract

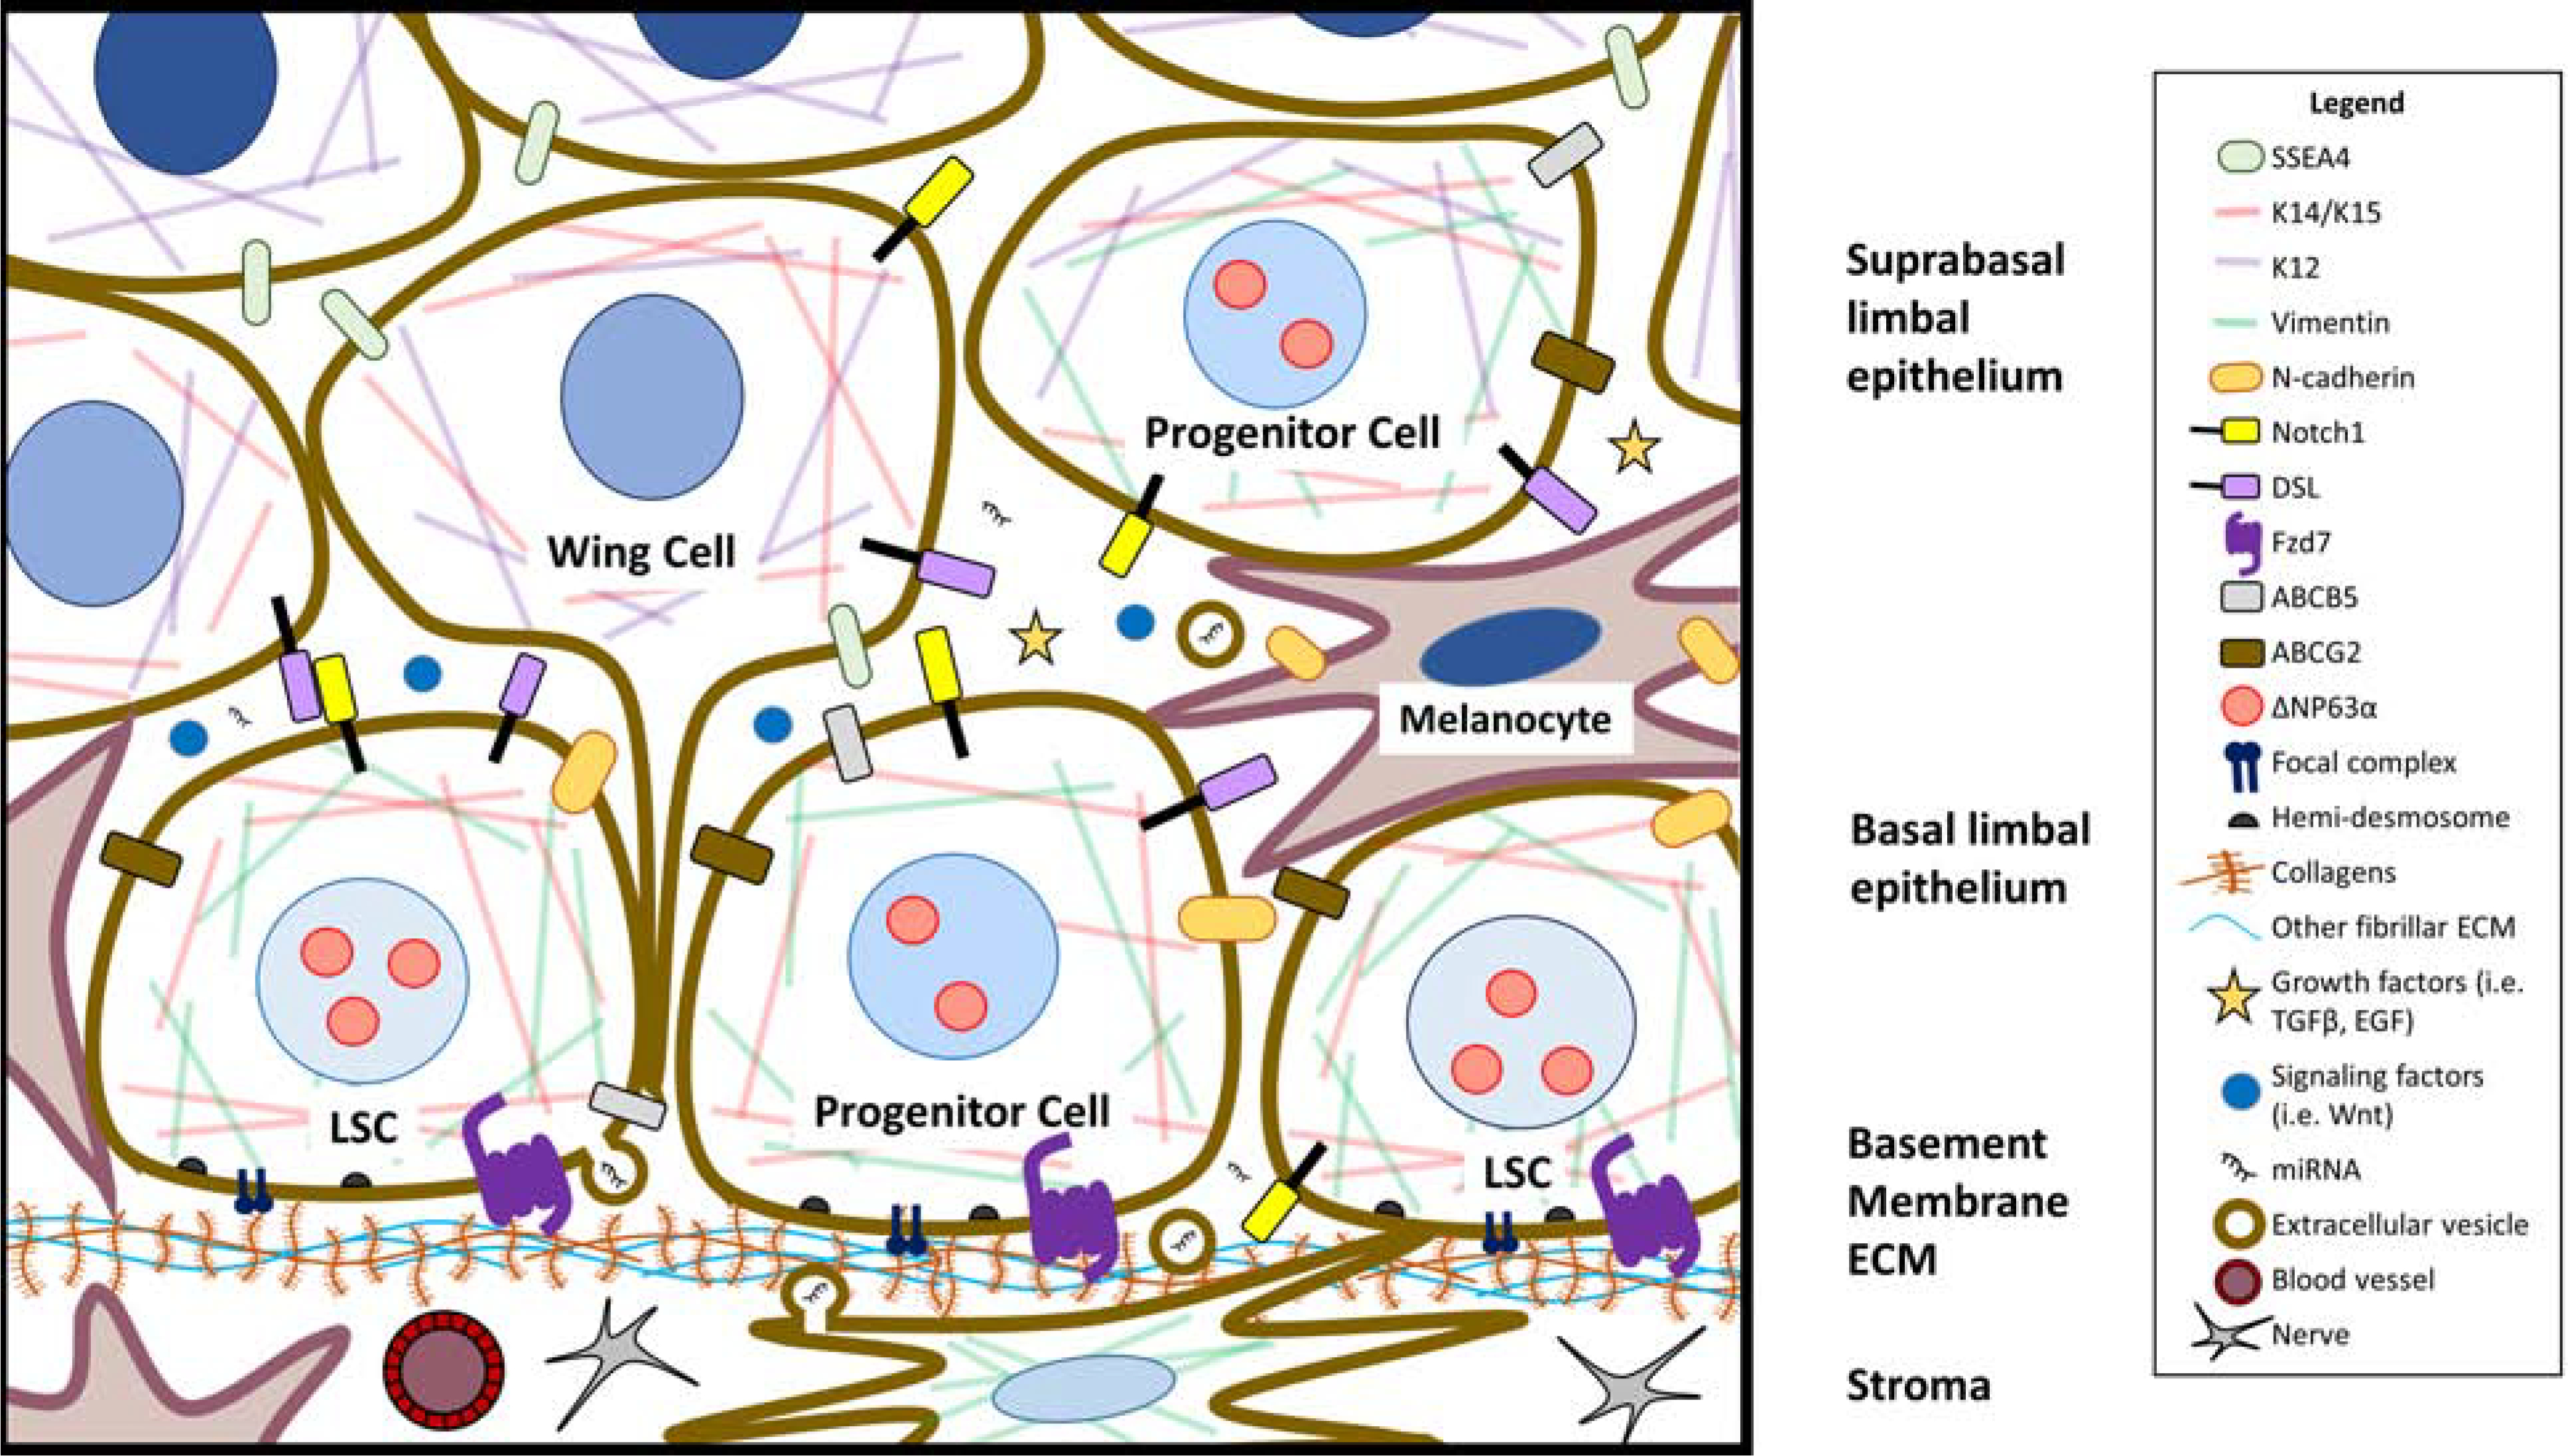
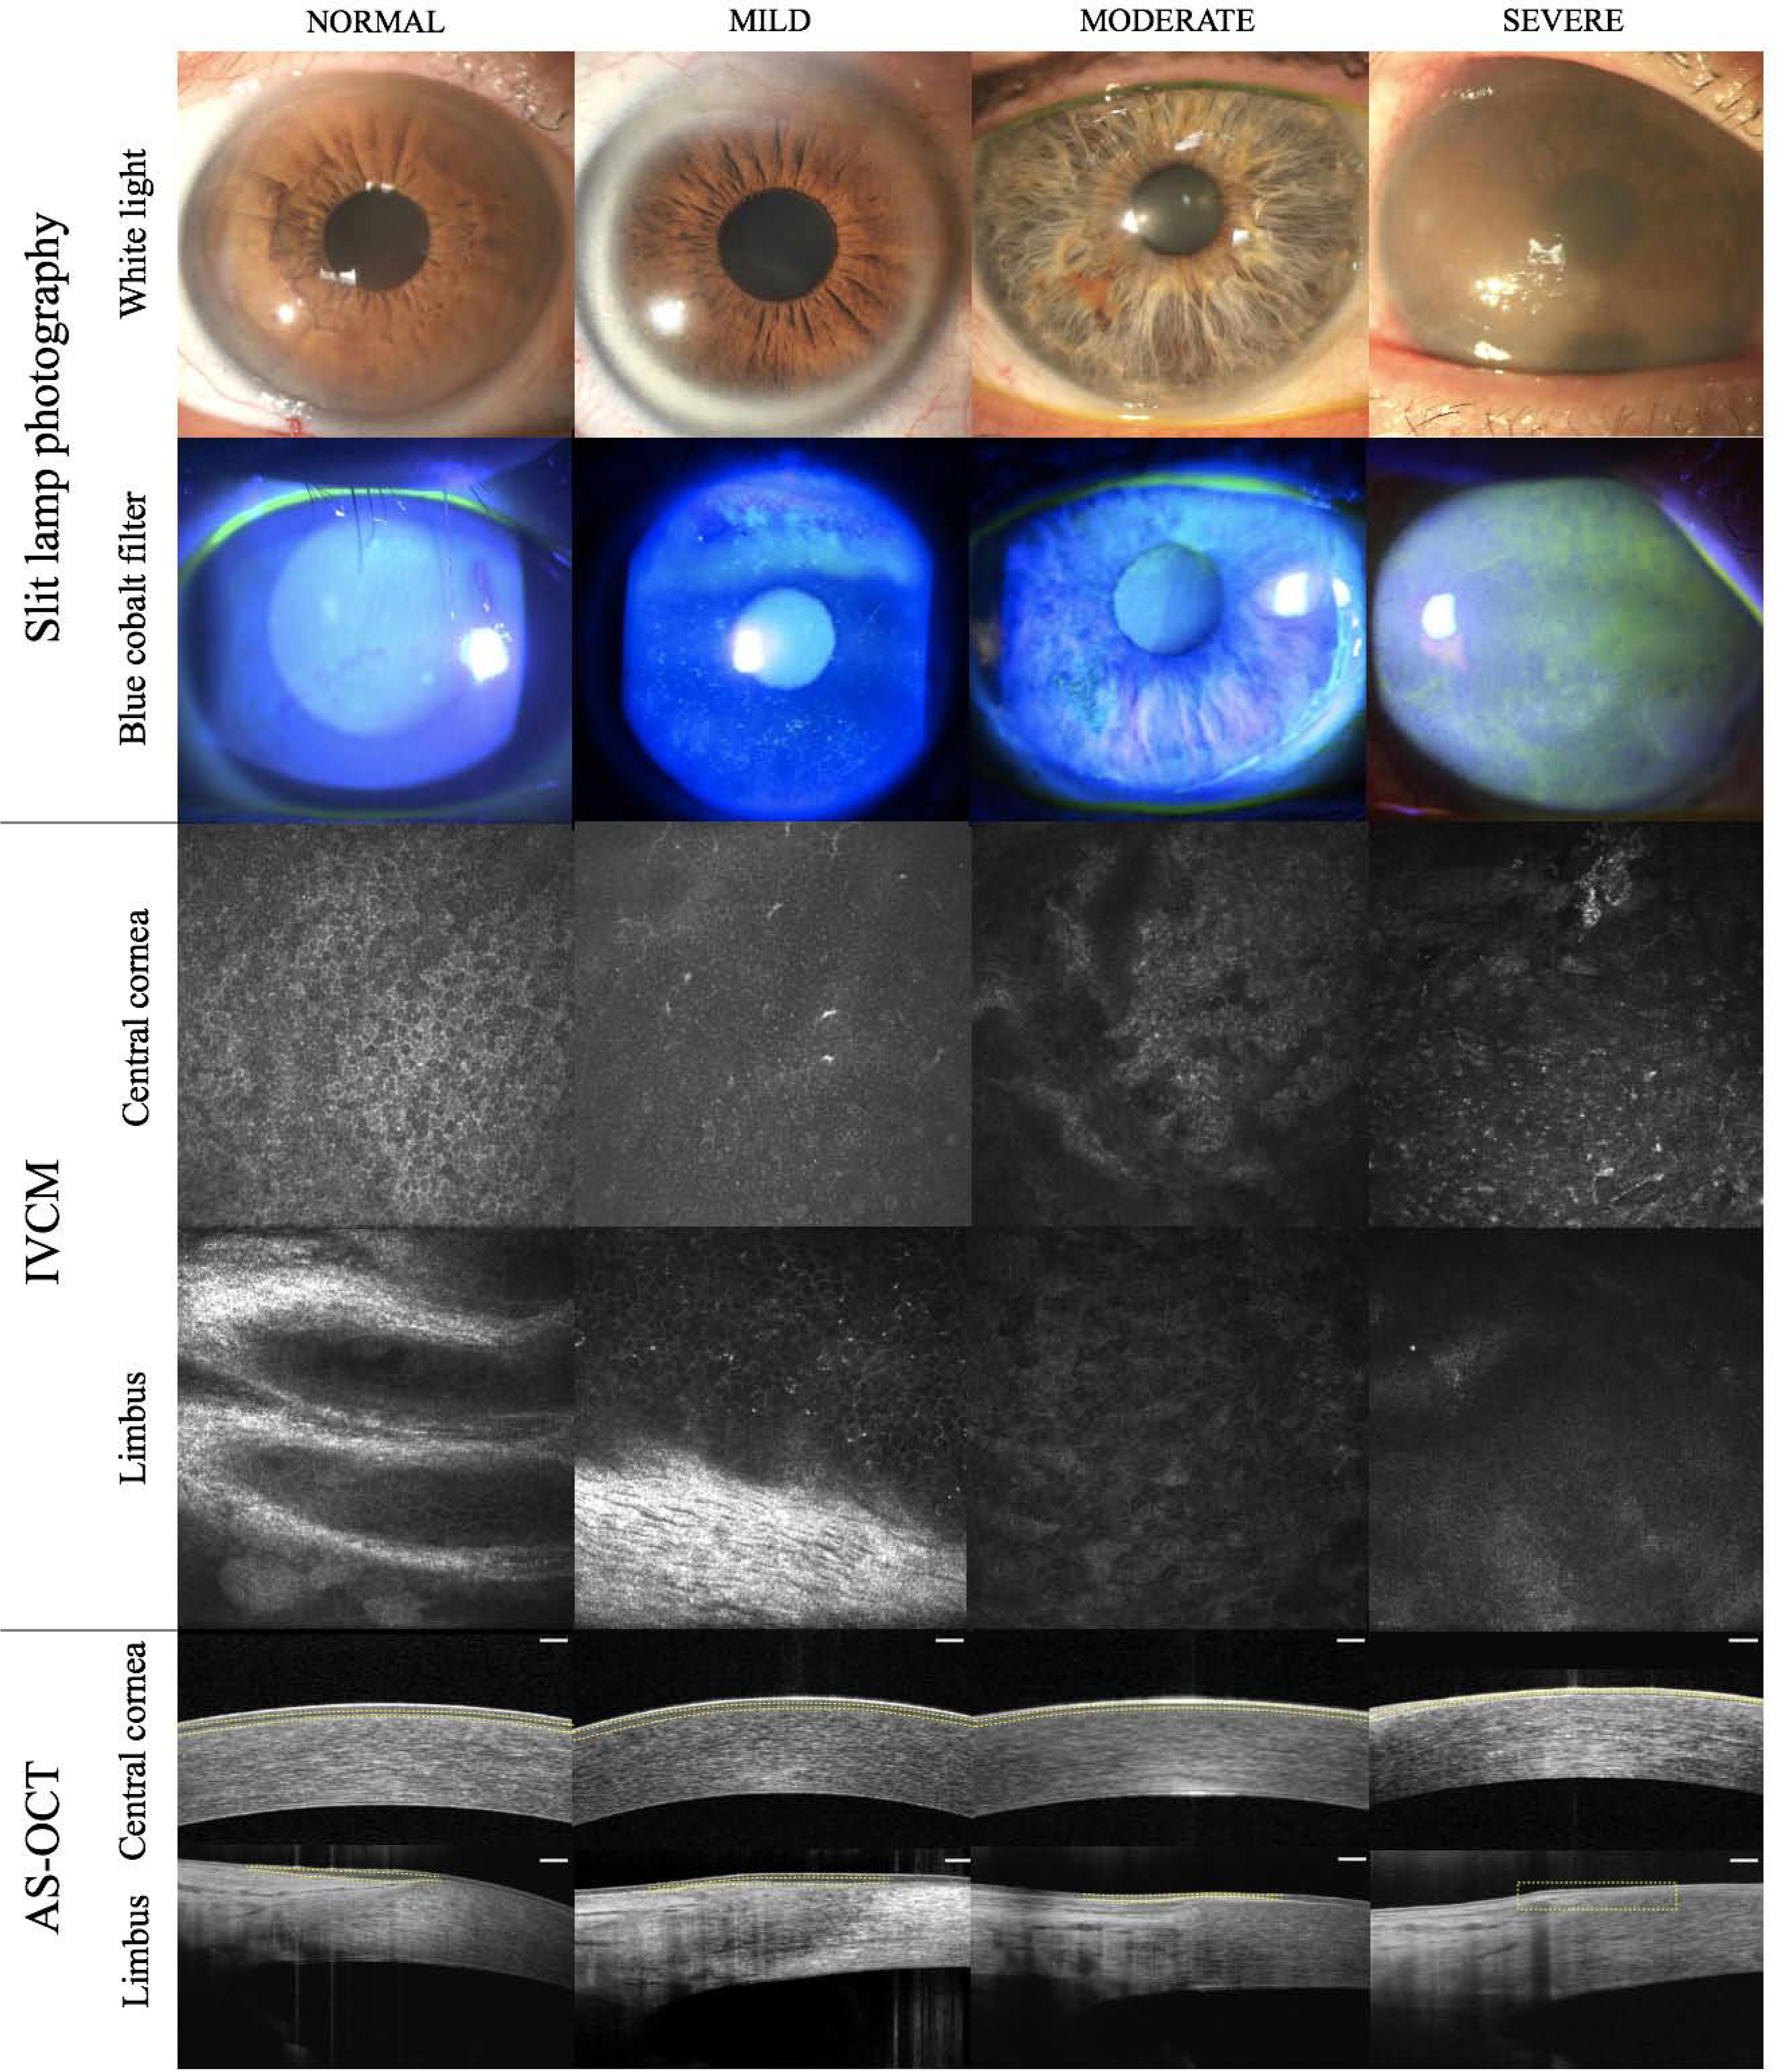
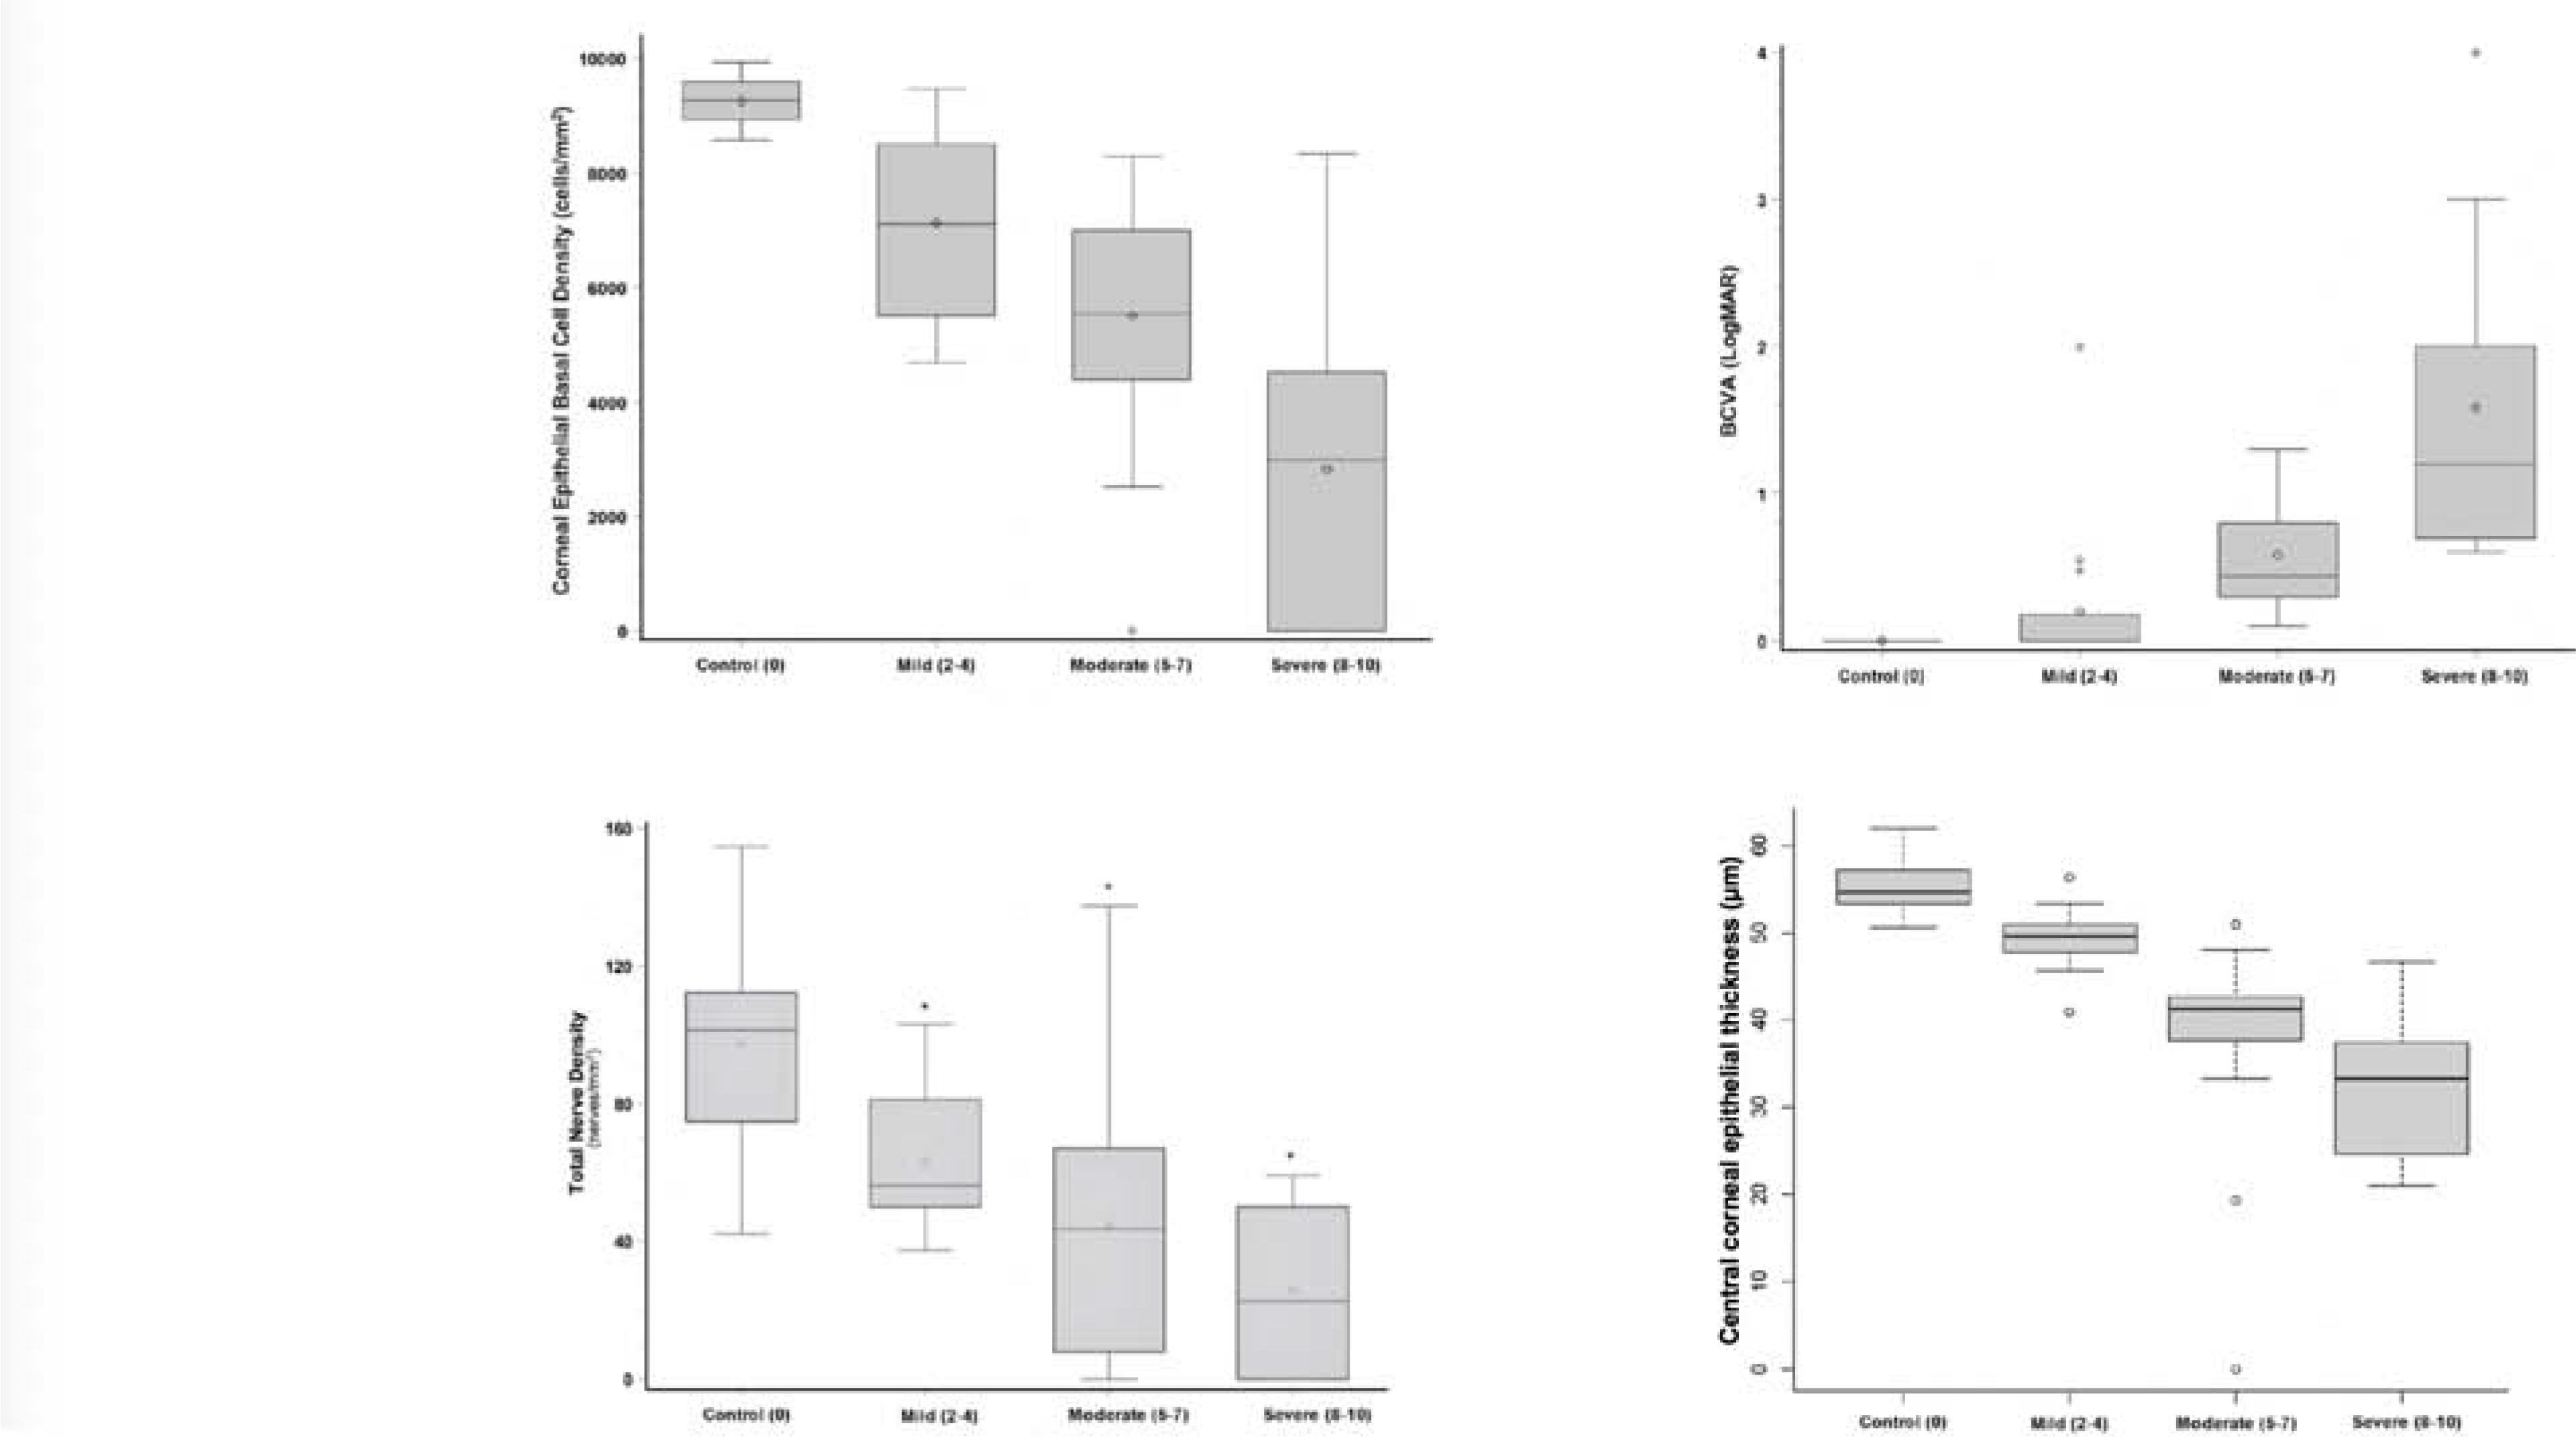
The corneal epithelium is continuously renewed by limbal stem/progenitor cells (LSCs), a cell population harbored in a highly regulated niche located at the limbus. Dysfunction and/or loss of LSCs and their niche cause limbal stem cell deficiency (LSCD), a disease that is marked by invasion of conjunctival epithelium into the cornea and results in failure of epithelial wound healing. Corneal opacity, pain, loss of vision, and blindness are the consequences of LSCD. Successful treatment of LSCD depends on accurate diagnosis and staging of the disease and requires restoration of functional LSCs and their niche. This review highlights the major advances in the identification of potential LSC biomarkers and components of the LSC niche, understanding of LSC regulation, methods and regulatory standards in bioengineering of LSCs, and diagnosis and staging of LSCD. Overall, this review presents key points for researchers and clinicians alike to consider in deepening the understanding of LSC biology and improving LSCD therapies.

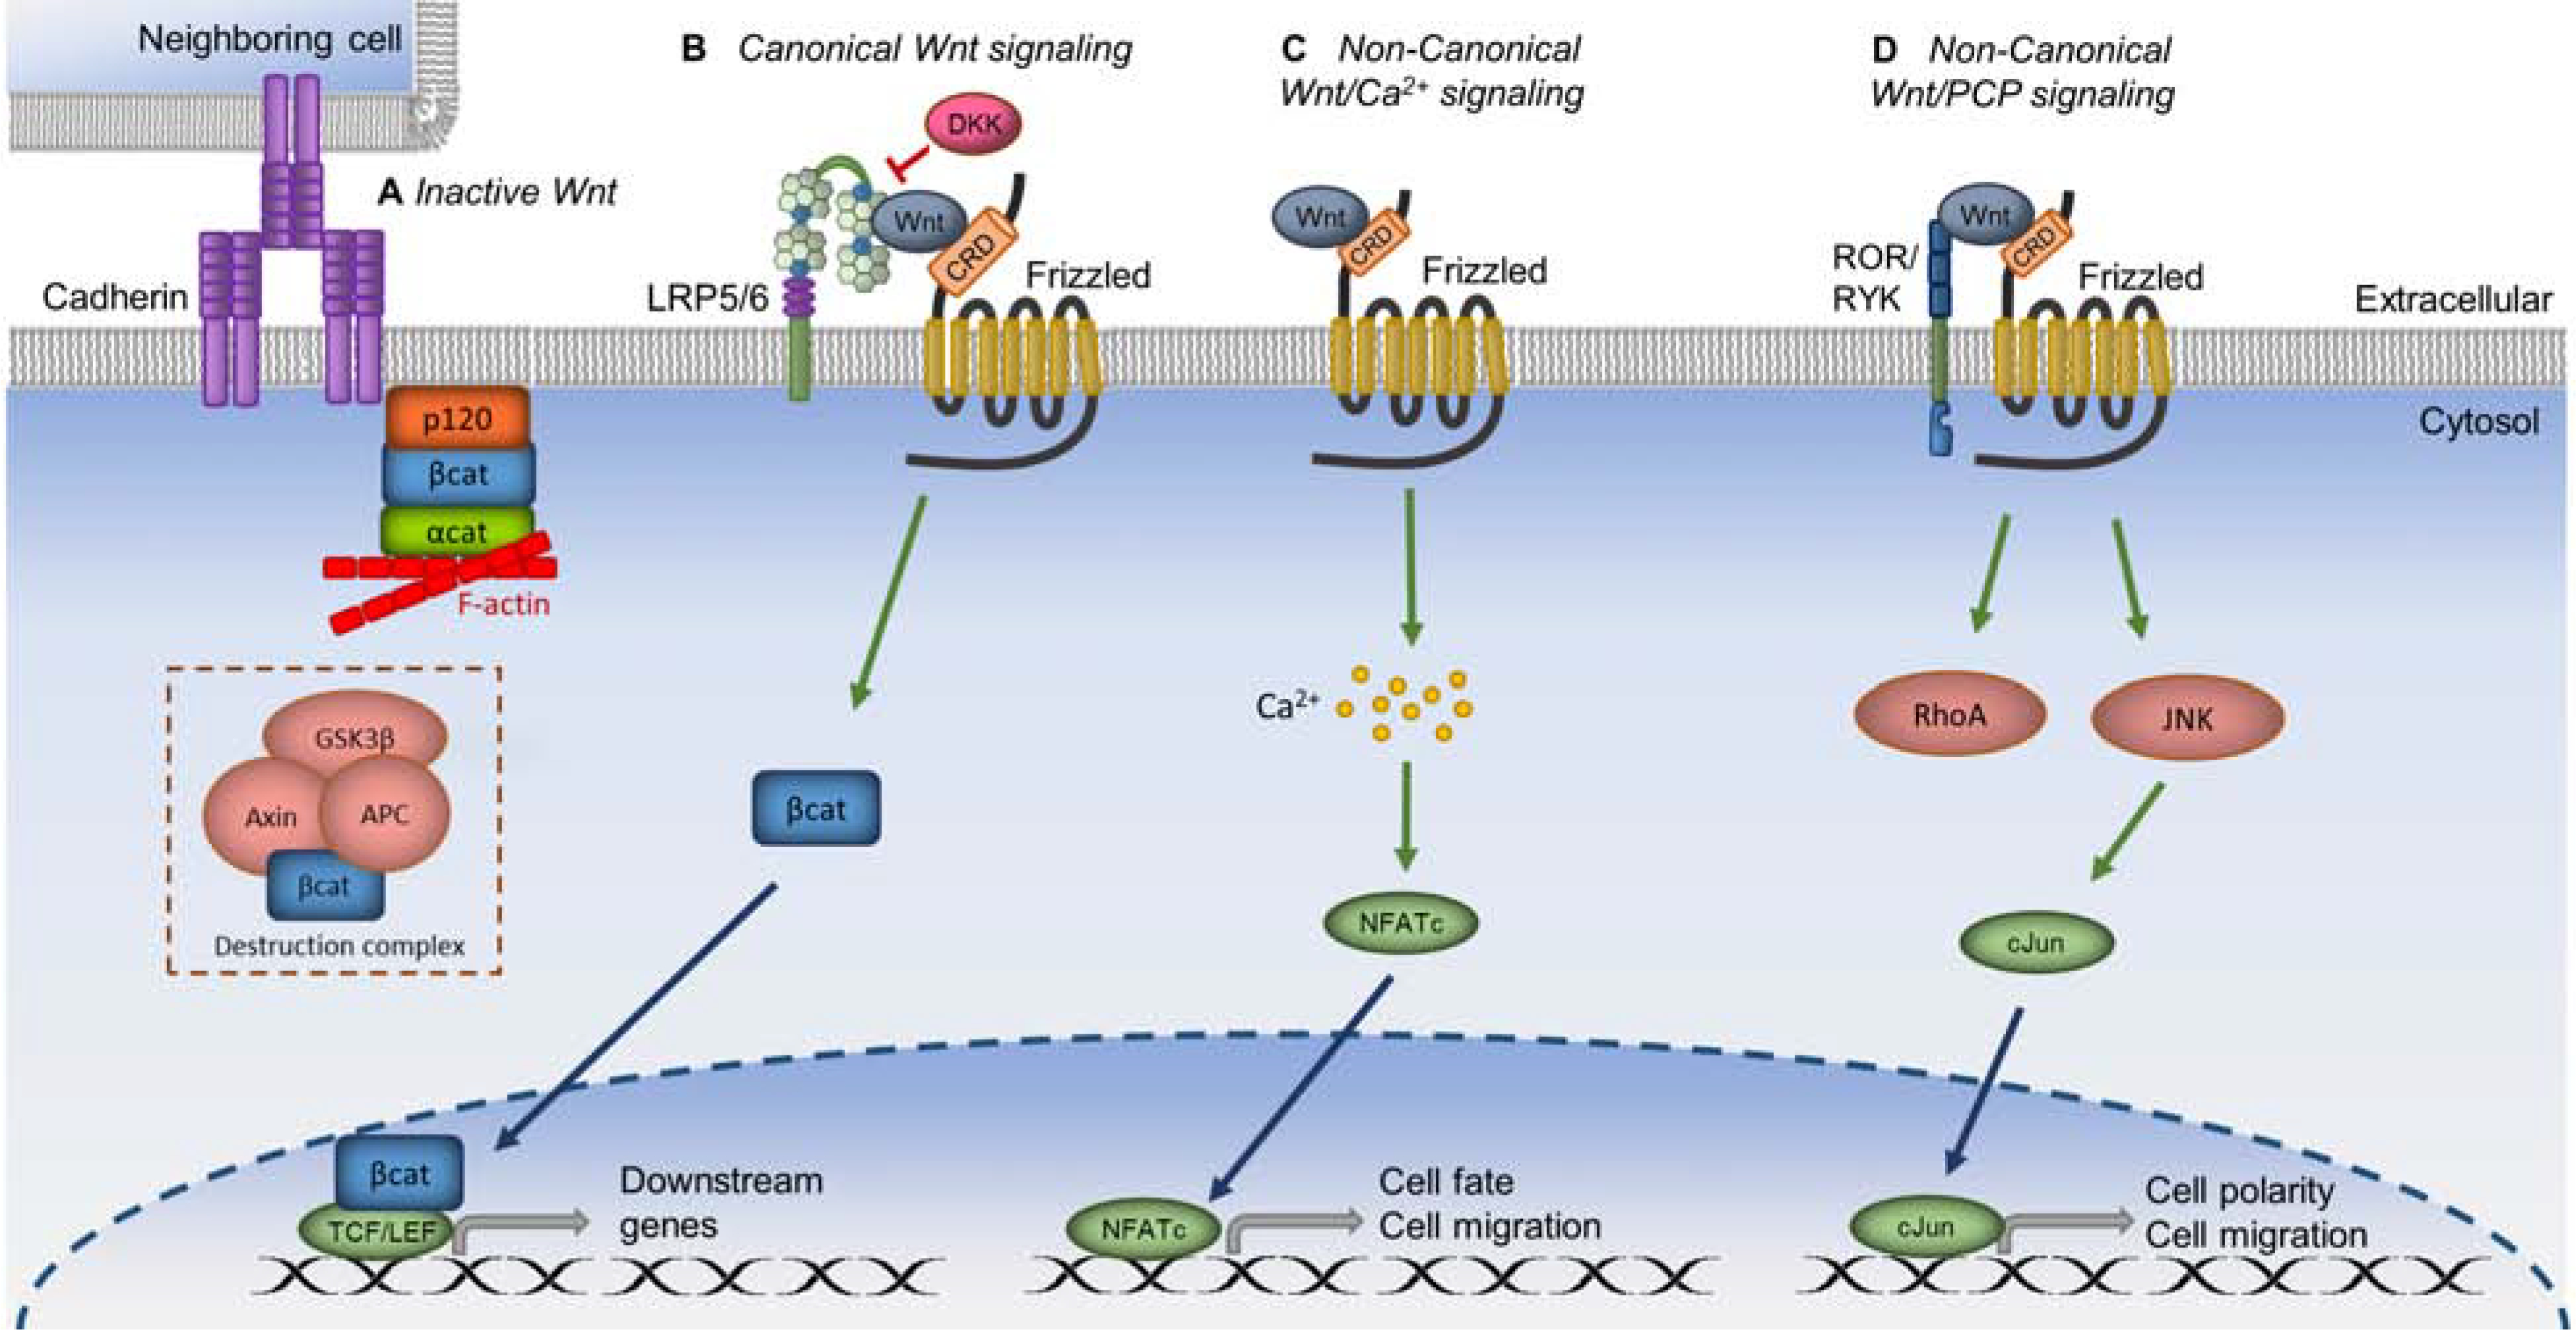
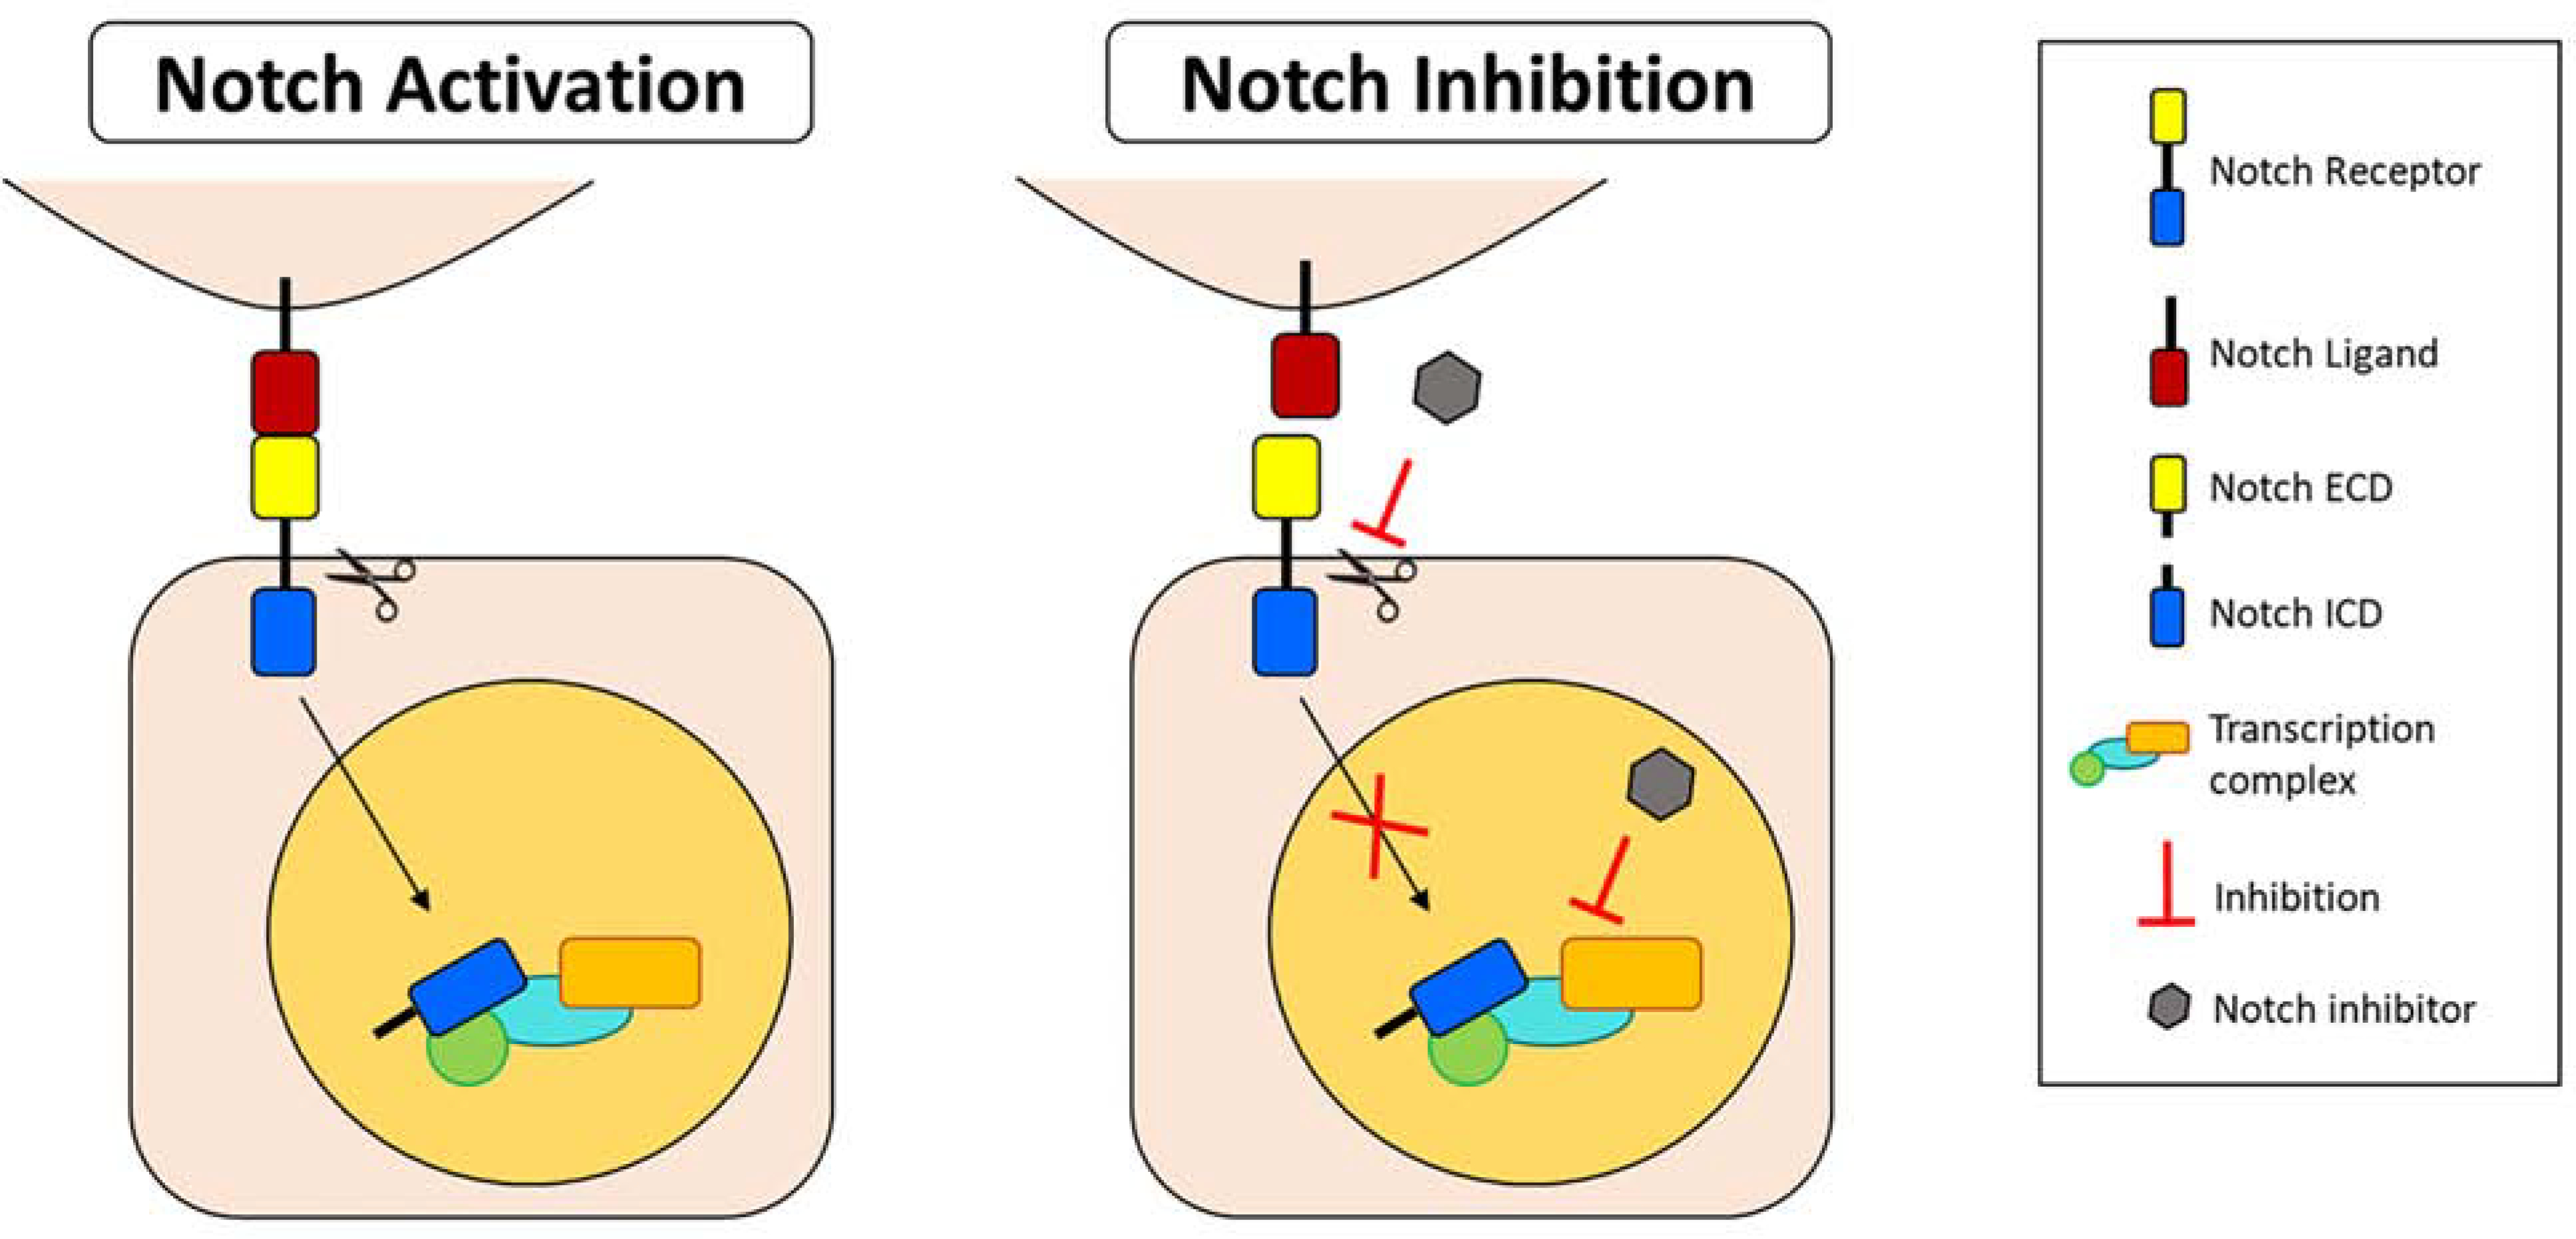
Keywords: Anterior segment coherence tomography; Cell therapy; In vivo laser scanning confocal microscopy; Limbal stem cell; Limbal stem cell deficiency; Notch signaling pathway; Small molecules; Wnt signaling pathway.


Figures

Figure 1.
Figure 1.. Schematic of limbal epithelial stem cell niche
This schematic of the limbal niche highlights currently known markers of limbal stem/progenitor cells (LSCs), the molecular signaling factors that regulate LSC maintenance, and the different niche cells that support LSC function. Lighter blue nuclei represent less differentiated epithelial LSCs and progenitor cells, while the darker nuclei cells in the suprabasal epithelium are more differentiated. Wing cells of the suprabasal epithelium are so named because of their wing-like protrusions. The basal cell layer harbors LSCs, melanocytes, and other basal cells. Structural factors such as cell-to-cell adhesion, signaling through the components of the extracellular matrix, and interaction between basal epithelial cells and niche cells, as well as soluble factors coordinate to regulate LSCs. Limbal stromal cells and epithelial cells produce exosomes that can regulate limbal homeostasis through their cargo, which includes miRNA. The limbus is also highly innervated and vascularized, which are crucial for the support of the limbal niche.
Figure 2.
Figure 2.. Wnt signaling regulation in human limbal stem/progenitor cells.
A. In inactive Wnt signaling, β-catenin (βcat) is associated either with cadherin at the membrane or with its destruction complex, which targets βcat for proteosomal degradation. B. When canonical Wnt signaling is activated, Wnt ligand binds with LRP5/6 and Frizzled coreceptors; βcat is released from the membrane or destruction complex and translocated into the nucleus to activate transcription of downstream genes. DKK inhibits canonical Wnt signaling by preventing Wnt binding to LRP5/6. C. In the noncanonical Wnt/Ca2+ pathway, Wnt activation leads to calcium influx into the cell. This action leads to the transcription of downstream genes involved in cell fate and cell migration. D. In the noncanonical Wnt/PCP pathway, binding of Wnt ligand to ROR or RYK with Frizzled causes downstream signaling that leads to cell polarity and cell migration. Green arrows represent activation, whereas red connectors represent inhibition.
Figure 3.
Figure 3.. Preferential expression of Frizzled receptors in human cornea and limbus.
A. The mRNA expression levels of Frizzled (Fz), Fz1, 4, 7, 8 and 10 in the limbus and cornea through qRT-PCR. Fz1, 4, 7 and 10 had significantly higher mRNA level in the limbus than in the cornea whereas Fz8 had a higher expression in the cornea. Error bar represents S.E.M. *: p<0.05. B. Protein expression patterns of Fz1, 4 and 7 in human cornea and limbus by immunohistochemistry. Only Fz7 (green) was preferentially expressed at the basal limbal epithelium. The nuclei were co-stained with Hoechst (blue). Scale bar represents 50 μm. This figure has been adapted from a Stem Cells article (Mei et al., 2014a).
Figure 4.
Figure 4.. Frizzled 7 expression localization correlates with putative LSC markers.
A. Micrographs of human sclerolimbal tissue immunostained for Frizzled 7 (Fzd7), p63α, N-cad, K14, and K12. White arrowheads mark cells that show high Fzd7 expression but low levels of other cell markers. Conversely, yellow arrowheads mark cells that express high putative LSC markers but low Fzd expression. White arrows mark basal epithelial cells that highly express both Fzd7 and putative LSC markers. Data indicates that majority of the cells expressing high Fzd7 colocalized with p63α, N-cadherin (N-cad), and K14. Scale bar = 50 μm. B. mRNA expressions of putative LSC markers and proliferation marker, Ki67, were decreased in Fzd7-deficient LSCs; determined by qRT-PCR. C. Fzd-deficient LSCs displayed a reduced colony forming efficiency. P1 indicates colonies were analyzed at passage 1 after transfection with Fzd7 shRNA. P2 indicates the transfected cells were passaged twice before colony analysis. *p<0.05 Error bar ±SEM. This figure has been adapted with permission from a Stem Cells article (Mei et al., 2014a).
Figure 5.
Figure 5.. Activation of canonical Wnt/β-catenin signaling improves progenitor cell phenotype, while inhibition of canonical Wnt/β-catenin signaling causes loss of the stem/progenitor cell population in cultivated LSCs.
A. and B. β-catenin (green) immunofluorescent staining and Hoescht (blue) nuclear staining of LiCl-treated LSC colonies compared to control. In the LiCl-treated LSC colonies, nuclear β-catenin was observed (white arrows) that was not present in the control colonies. C. Quantification of CFE of LSC colonies as a ratio of LiCl-treated LSC cultures relative to their donor-matched control. D. Quantitative real-time PCR measure analysis of the progenitor cell markers ABCG2 and ΔNP63α, and the differentiated cell marker K12. White bars: control cultivated LSCs. Black bars: LiCl-treated cultivated LSCs. Data are represented as mean ± SEM, where *p < 0.05 was considered significant. This figure has been adapted with permission from an IOVS article (Nakatsu et al., 2011).
Figure 6.
Figure 6.. Mechanism of action of small-molecule Wnt modulators.
IIIC3 acts as a canonical Wnt/β-catenin signaling agonist by preventing the binding of Wnt inhibitor DKK to LRP5/6. ND and IC15 both inhibit canonical Wnt/β-catenin signaling by inhibiting the Wnt binding to LRP5/6. MFH inhibits all Wnt signaling by inhibiting the Wnt binding site, or CRD domain, of Frizzled. When MFH and ND are linked together, the resulting molecule MFH-ND acts as a Wnt mimic that activates canonical Wnt/β-catenin signaling by biding to the LRP5/6 and Frizzed co-receptors. Green arrows represent activation, whereas red connectors represent inhibition.
Figure 7.
Figure 7.. Canonical Wnt signaling modulation affects stem/progenitor cell phenotype.
A. Quantification CFE of LSC colonies as a percentage of the number of cells seeded. Black bars: cultivated LSCs treated with IIIC3, a DKK inhibitor. White bars: cultivated LSCs treated with IC15, an LRP5/6 inhibitor. B. Quantification of the percentage of p63αbright cells, a measure of progenitor cells, in cultivated LSCs after treatment with IIIC3 (black bars) or IC15 (white bars). C. Quantification of the percentage of small cells (< 12 μm), which is a quality of LSCs. D. Quantification of the percentage of cells positive for K12 protein expression, a marker of differentiated cells, in cultivated LSCs after treatment with IIIC3 (black bars) or IC15 (white bars). Data are represented as mean ± SEM, where *p < 0.05 was considered significant. This figure has been adapted from an IOVS article under a Creative Commons License. http://creativecommons.org/licenses/by/4.0/. Three figures have been combined from the original article.
Figure 8.
Figure 8.. The canonical Wnt mimic MFH-ND improves stem/progenitor cell properties of expanded LSCs in vitro.
A. Rhodamine B staining of cultivated LSC colonies measures CFE. B. Quantification of the percentage of p63αbright cells, a measure of progenitor cells. C. Quantification of the percentage of cells expressing K14 protein, a marker of undifferentiated cells. D. Quantification of the percentage K12+ cells. Data are represented as mean ± SEM, where *p < 0.05 was considered significant. This figure has been adapted from an iScience article under a Creative Commons License. http://creativecommons.org/licenses/by/4.0/. Two figures have been combined from the original article.
Figure 9.
Figure 9.. Notch signaling cascade.
Upon binding of the Notch ligand to the receptor, the Notch intracellular domain (ICD) is cleaved from the extracellular domain (ECD) and translocates to the nucleus where it binds to the downstream transcription complex and activates target gene expression. Notch activation induces differentiation of limbal stem/progenitor cells (LSCs) and decreases proliferation and stratification. Notch signaling inhibition in LSCs by small molecule inhibitors maintains LSC phenotype and induces proliferation and stratification. Abbreviations: ECD: Extracellular domain; ICD: Intracellular domain.
Figure 10.
Figure 10.. Inhibition of Notch signaling by DAPT and SAHM1 preserves the LSC phenotype.
A. Cell population doubling with DAPT/SAHM1. B. CFE quantification on the Rhodamine B-stained plates. C. Quantification of p63αbright cells at the protein level. D. Quantification of K14+ cells at the protein level. E. Percentage of small (≤12 μm) LSC-like cells. F. Quantification of K12+ cells at the protein level. Data are represented as mean ± SEM. *p < 0.05 were considered significant. Data are statistically analyzed by using the pairwise t-test and represented as mean ± SEM. Abbreviations: CFE: Colony Forming Efficiency; K12: cytokeratin 12; K14: cytokeratin 14; LSCs: limbal stem/progenitor cells. This figure has been adapted from a Scientific Reports article (Gonzalez et al., 2019) under a Creative Commons License. http://creativecommons.org/licenses/by/4.0/. Two figures were combined from the original article.
Figure 11.
Figure 11.. Jagl-mediated Notch activation reduced stratification and promoted differentiation of LECs.
A. Stratification of the cultivated LECs in the presence of Jag1 was reduced before and after air-lifting induction. Differentiation was maintained after air-lifting in the Jag1 group at the superficial layer(s). B. The number of layers and number of cells per μm at the basal layer were reduced in the Jag1 cultures; the K12+ area in the presence of Jag1 was increased compared to the control. C. Expression of p63α and Ki67 was reduced at the basal layer of the cultivated LECs with Jag1. D. Quantification of the percentage of cells positive for p63α and Ki67 showed a significant reduction in the cultivated LECs with Jagl. The dotted line in A and C panels delineates the BM. In panels B and D, *p < 0.05 were considered significant. Data were statistically analyzed by using the Student’s t-test and represented as mean ± SEM. Abbreviations: BM: basement membrane; H&E: hematoxylin and eosin; Jagl: Jagged 1; K12: cytokeratin 12; K14: cytokeratin 14; PET: Polyethylene Terephthalate. This figure has been adapted from a Cells article (Gonzalez et al., 2020) under a Creative Commons License. http://creativecommons.org/licenses/by/4.0/.
Figure 12.
Figure 12.. Jag1 decreased asymmetric divisions in basal limbal epithelial cells.
A. Pericentrin stained both poles of the mitotic spindle in cells undergoing mitosis before and after a combined treatment of nocodazole and pyrimydine-7. Arrows indicate pericentrin staining. Arrowhead indicates cleavage furrow and contractile ring stained with F-actin. B. The percentage of dividing cells was significantly reduced in the presence of Jag1. C. Both in the presence and absence of Jag1, pericentrin was identified in the daughter cells of symmetric and asymmetric divisions, and together with F-actin helped identify the orientation of the mitotic spindle. In control cultures without Jag1, Par3 was expressed at the apical-lateral membrane of cells; in the Jag1 cultures, the expression of Jag1 was more delocalized and scattered in the cells. In control cultures, N1IC was expressed in the nucleus of basal cells dividing asymmetrically; cells dividing symmetrically had mostly cytoplasmic expression of N1IC; in Jag1 cultures, cells dividing symmetrically expressed nuclear N1IC. D. The plane of asymmetric and symmetric divisions (represented by the white line) is shown in the presence and absence of Jag1 in cross-sections of cultivated LECs. A decrease in the number of asymmetric divisions was observed in LECs cultivated with Jag1. E. The percentage of asymmetric divisions was reduced in the presence of Jag1. In panels C and D, the BM is delineated by the dotted line. *p < 0.05 were considered significant. Data were statistically analyzed by using the Student’s t-test and represented as mean ± SEM. Abbreviations: BM: Basement membrane; Jag1: Jagged 1; Nocod: Nocodazole; NotchllC: Notch 1 intracellular domain. Par3: Partitioning defective protein 3; Pyr: Pyrimidyn-7. This figure has been adapted from a Cells article (Gonzalez et al., 2020) under a Creative Commons License. http://creativecommons.org/licenses/by/4.0/.
Figure 13.
Figure 13.. Proposed model of stratification-differentiation of the human limbal epithelium.
A. In the absence of Jagl (control), basal stem cells expressing p63 retain the capacity to divide asymmetrically generating two daughter cells, a new stem cell and a suprabasal more differentiated cell. The orientation of the mitotic spindle is controlled by the polarity proteins such as Par3 that are distributed on the apical-lateral membrane of polarized basal cells. Differentiated K12+ cells are present at the superficial layer(s). In the presence of Jagl, basal cells in direct contact with Jag1 have a scattered Par3 distribution, p63 expression is low, and there is a decrease in the proportion of asymmetric divisions. As a consequence, the stratification of the epithelium is reduced. Differentiated K12+ cells are still present at the superficial layer(s). B. Schematic diagram showing that upon Jag1-mediated Notch activation, the expression of p63 is downregulated. P63 is the main driver of epithelial stratification. High levels of p63 promote asymmetric divisions, which in turns increases the stratification of the epithelium. Also, Notch signaling directly affects the expression of Par3. Overexpression of Notch signaling dysregulates Par3 expression and decreases asymmetric divisions. This figure has been adapted from a Cells article (Gonzalez et al., 2020) under a Creative Commons License. http://creativecommons.org/licenses/by/4.0/.
Figure 14.
Figure 14.. The 3-dimensional limbal stem/progenitor cell cultivation method resembles the in vivo environment.
A. Diagram of the standard 2-dimensional (2D) and sandwich 3-dimensional (3D) culture methods. In the 2D method, LSCs are cultured directly on feeder cells. In 3D method, LSCs and feeder cells are cultured on the opposite sites of the PET membrane. B. Morphology of the LSC sheet in the 2D and 3D methods with 3T3-J2 feeder cells. C. Cell population doubling of LSCs in the 2D and 3D methods with 3T3-J2 feeder cells. D. Cell population doubling of LSCs in the 2D and 3D methods with BMs as feeder cells. E. Percentage of p63αbright cells in the 2D and 3D methods with BMs as feeder cells. F. Percentage of K14+ cells in the 2D and 3D methods with BMs as feeder cells. G. Percentage of K12+ cells in the 2D and 3D methods with BMs as feeder cells. H, I, J. Structure of the LEC sheet and BMs on both sides of the PET membrane in the 3D method. Possible cell-to-cell contact between LSCs and BMs (arrow) in the 3D method. In panels H, I and J, scale bar represents a distance of 10 μm. K. Quantitation of PET membrane pores with and without possible cell contact. *p < 0.05 were considered significant. Data were statistically analyzed by using the Student’s t-test and represented as mean ± SEM. Abbreviations: BM: Bone Marrow-Derived Mesenchymal Stem Cells; 2D-SC: single LSCs in the standard or 2D method; 2D-CC: LSC clusters in the standard or 2D method; 3D-CC: LSC clusters in the sandwich or 3D method; K12: cytokeratin 12; K14: cytokeratin 14; Epi: epithelium; PET: polyethylene terephthalate. This figure has been adapted from a Tissue Engineering Part C: Methods article (Mei et al., 2013) and a Stem Cell Research article (Gonzalez et al., 2016) under a Creative Commons License. http://creativecommons.org/licenses/by/4.0/. Four figures were combined from the original articles.
Figure 15.
Figure 15.. Clinical presentation and in vivo images of eyes with different stages of limbal stem cell deficiency.
Slit-lamp photography under white light (first row) and blue cobalt light (second row) show a clear cornea in normal eye (left column) and abnormal fluorescein staining pattern in eyes with different severity of limbal stem cell deficiency (LSCD, right 3 columns). Images obtained from in vivo confocal microscopy (IVCM) of basal central corneal epithelial cells (third row) and limbus (fourth row) show palisade of Vogt in normal eye (left image) and different morphologic changes in the LSCD (right 3 images). Images from anterior segment optical coherence tomography (AS-OCT, bottom row) show normal epithelial thickness in normal eye (left image) and progressive epithelial thinning in LSCD (right 3 images).
Figure 16.
Figure 16.. Clinical grading of limbal stem cell deficiency.
Limbus involvement in clock hours (top panel), corneal surface area (middle panel), and visual axis involvement (bottom panel) criteria are shown. Slit-lamp photograph of an eye with a total score of 6 points, classified as the moderate stage of LSCD (far right panel). Reprinted from Aravena et al. (Aravena et al., 2019) with permission from Wolters Kluwer Health, Inc.
Figure 17.
Figure 17.. Correlation between clinical score, in vivo parameters in patients with limbal stem cell deficiency.
Box and whisker plots of the central corneal basal cell density (top left panel), sub-basal nerve density (bottom left panel), best corrected distance visual acuity (BCVA, top right panel) and central corneal epithelial thickness measured by AS-OCT (bottom right panel) in control groups and in patients with mild, moderate and severe limbal stem cell deficiency. The clinical score positively correlated with the degree of reduction in visual acuity and all in vivo parameters. Statistical analyses were performed with Kruskall-Wallis test and Pearson correlation coefficient. Reprinted from Chan et al. (Chan et al., 2015b), Aravena et al. (Aravena et al., 2019) with permission from Wolters Kluwer Health, Inc., Chuephanich et al. (Chuephanich et al., 2017), Liang et al. (Liang et al., 2020).

References

    1. Ahadome SD, Zhang C, Tannous E, Shen J, Zheng JJ, 2017. Small-molecule inhibition of Wnt signaling abrogates dexamethasone-induced phenotype of primary human trabecular meshwork cells. Exp Cell Res 357, 116–123. - PMC - PubMed
    1. Alok A, Lei Z, Jagannathan NS, Kaur S, Harmston N, Rozen SG, Tucker-Kellogg L, Virshup DM, 2017. Wnt proteins synergize to activate beta-catenin signaling. J Cell Sci 130, 1532–1544. - PubMed
    1. Andersson ER, Sandberg R, Lendahl U, 2011. Notch signaling: simplicity in design, versatility in function. Development 138, 3593–3612. - PubMed
    1. Ang LP, Sotozono C, Koizumi N, Suzuki T, Inatomi T, Kinoshita S, 2007. A comparison between cultivated and conventional limbal stem cell transplantation for Stevens-Johnson syndrome. Am J Ophthalmol 143, 178–180. - PubMed
    1. Aravena C, Bozkurt K, Chuephanich P, Supiyaphun C, Yu F, Deng SX, 2019. Classification of Limbal Stem Cell Deficiency Using Clinical and Confocal Grading. Cornea 38, 1–7. - PMC - PubMed

Publication types