. 2021 Mar 6;22(1):249.
doi: 10.1186/s12891-021-04109-8.

Major ceRNA regulation and key metabolic signature analysis of intervertebral disc degeneration

Affiliations

Major ceRNA regulation and key metabolic signature analysis of intervertebral disc degeneration

Shuai Cao et al. BMC Musculoskelet Disord. .

Abstract

Background and objective: Intervertebral disc degeneration (IDD) is a complex multifactorial and irreversible pathological process. In IDD, multiple competing endogenous RNAs (ceRNA, including mRNA, lncRNA, and pseudogenes) can compete to bind with miRNAs. However, the potential metabolic signatures in nucleus pulposus (NP) cells remain poorly understood. This study investigated key metabolic genes and the ceRNA regulatory mechanisms in the pathogenesis of IDD based on microarray datasets.

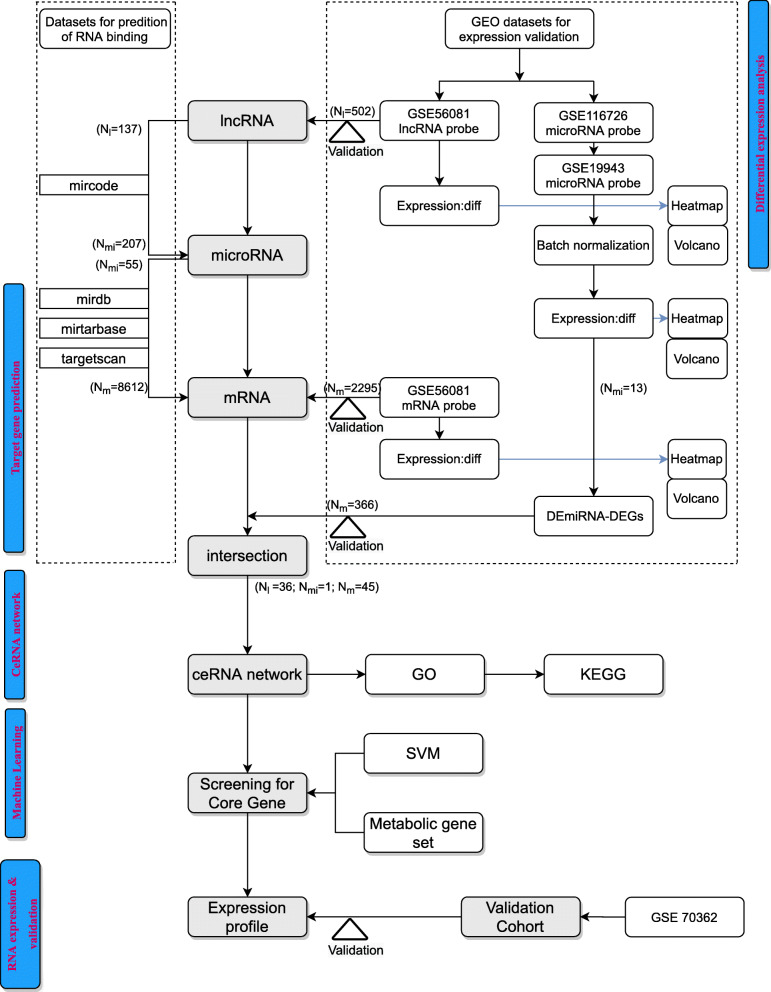
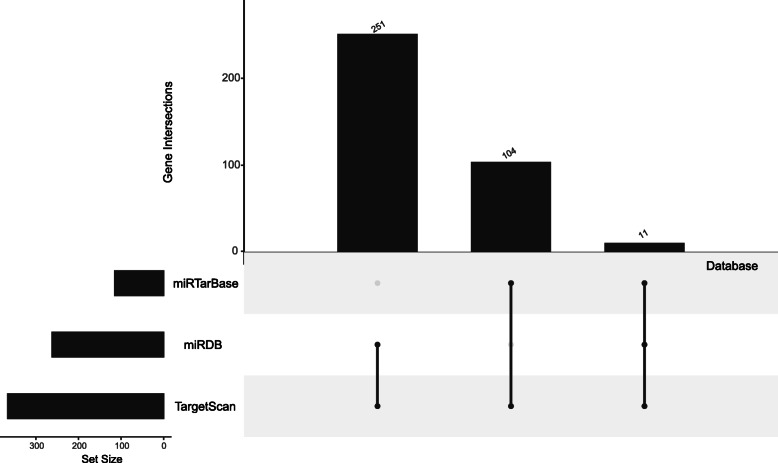
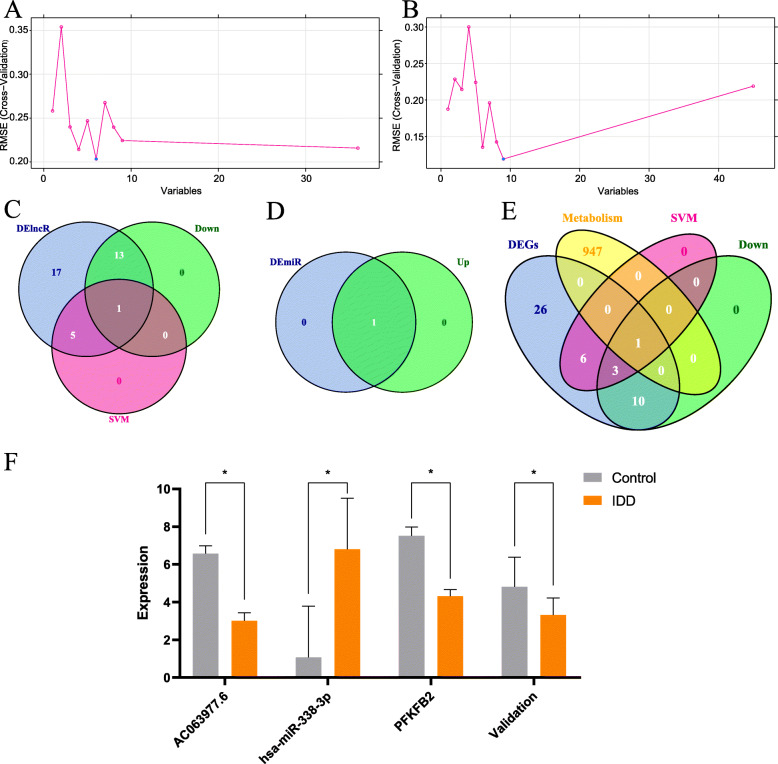
Methods: We retrieved and downloaded four independent IDD microarray datasets from the Gene Expression Omnibus. Combining the predicted interactions from online databases (miRcode, miRDB, miRTarBase, and TargetScan), differentially expressed lncRNAs (DElncRNAs), miRNAs (DEmiRNAs), and mRNAs (DEmRNAs) were identified. A ceRNA network was constructed and annotated using GO and KEGG pathway enrichment analyses. Moreover, we searched the online metabolic gene set and used support vector machine (SVM) to find the critical metabolic DEmRNA(s) and other DERNAs. Differential gene expression was validated with a merged dataset.

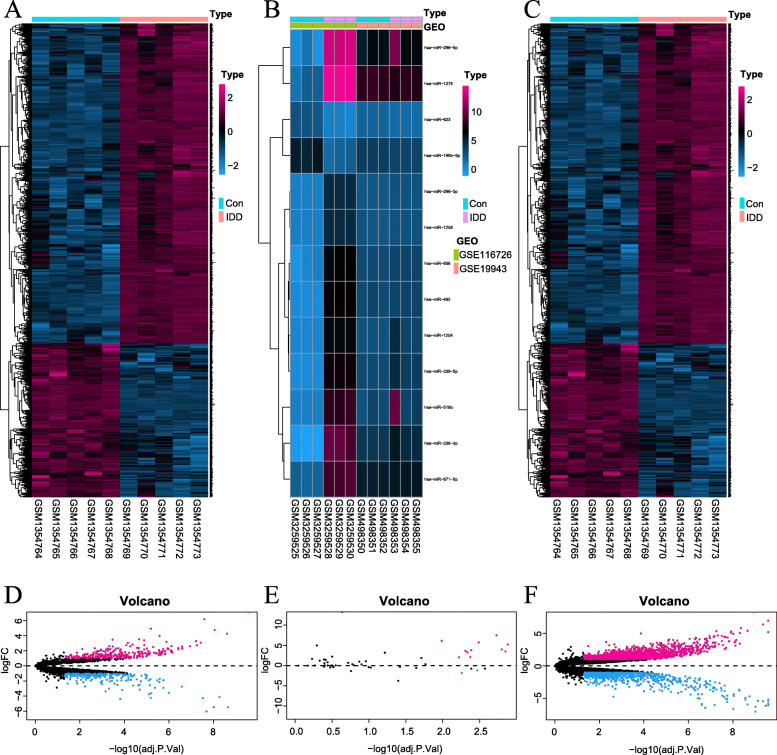
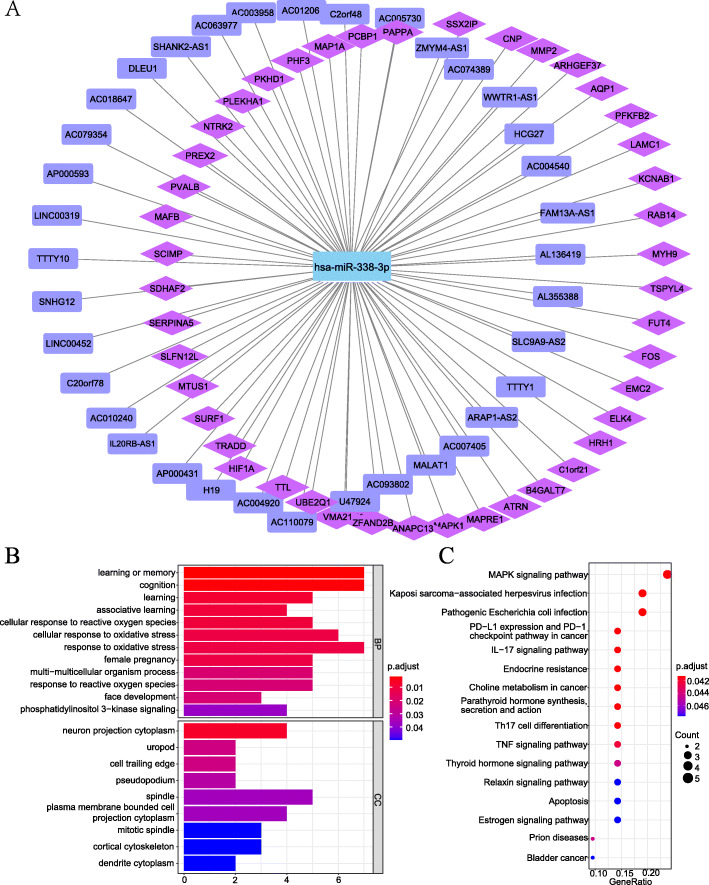
Results: A total of 45 DEmRNAs, 36 DElncRNAs, and only one DEmiRNA (miR-338-3p) were identified in the IDD microarray datasets. GO and KEGG pathway enrichment analyses revealed that the DEmRNAs were predominantly enriched in the PI3K-Akt signaling pathway, MAPK signaling pathway, IL-17 signaling pathway, apoptosis, and cellular response to oxidative stress. Based on SVM screening, 6-phosphofructo-2-kinase/fructose-2,6-bisphosphatase (PFK/FBPase) 2 is the critical metabolic gene with lower expression in IDD, and AC063977.6 is the key lncRNA with lower expression in IDD. The ceRNA hypothesis suggests that AC063977.6, miR-338-3p (high expression), and PFKFB2 are dysregulated as an axis in IDD.

Conclusions: The results suggest that lncRNA AC063977.6 correlate with PFKFB2, the vital metabolic signature gene, via targeting miR-338-3p during IDD pathogenesis. The current study may shed light on unraveling the pathogenesis of IDD.

Keywords: Competing endogenous RNA; Intervertebral disc degeneration; Long noncoding RNA; Metabolism; MicroRNA.


Conflict of interest statement

The authors declare that they do not have anything to disclose regarding conflict of interest with respect to this manuscript.

Figures

Fig. 1
Fig. 1
Flowchart of our bioinformatic analysis. The logical steps: 1. Differential expression analysis; 2. Target gene prediction; 3. ceRNA network construction; 4. Machine learning (for screening core gene); 5. RNA expression and validation. Intersection means the set of common gene IDs in different gene sets
Fig. 2
Fig. 2
The method for genes scan of miRNAs. Targets of DEmiRNAs were predicted by three experimentally independent databases, including miRDB (http://mirdb.org/), miRTarBase (http://mirtarbase.mbc.nctu.edu.tw/php/index.php) and TargetScan (http://www.targetscan.org/vert_72/). The target gene is the one at least overlapping by two of three binding prediction databases. Intersection means that the number of overlapping genes in different databases (2 or 3)
Fig. 3
Fig. 3
Difference analysis. a-c The differentially expressed heat-maps of lncRNA, microRNA, and mRNA. The lncRNA heat-map of GSE56081 dataset (a); The merged microRNA heat-maps of GSE116726 and GSE19943 datasets (b); The mRNA heat-map of GSE56081 dataset. d-f The volcano plot (c). The lncRNA dataset of GSE56081 (d); The merged microRNA datasets of GSE116726 and GSE19943 (e); The mRNA dataset of GSE56081 (f). The screening condition: absolute values of log (fold change) > 1.0 and adjusted p-Value < 0.05. In the plots, the rose red and blue dots represent high and low RNA expressions with statistical significance between the IDD NPs and the normal NPs, respectively. And, the black dots represent no statistical significance between them
Fig. 4
Fig. 4
The ceRNA network and its enrichment analysis by GO annotation and pathways identified by KEGG for Differentially expressed genes. The ceRNA network created by Cytoscape 3.8.3 (a). The connections DElncRNA (purple rectangle), DEmicroRNA (blue), and target genes (purple pink rhombus) were represented as nodes, and their interactions were denoted by lines. The top terms of enriched GO analysis (b). The top terms of enriched KEGG pathway [–30] (c). Abbreviation: GO, the gene ontology; KEGG, the Kyoto encyclopedia of genes and genomes; BP, the biological process; CC, the cellular component. The details for actual gene IDs and GO descriptions were shown in Supplementary Table 5. The details for actual gene IDs per KEGG pathway were shown in Supplementary Table 6. We are grateful to Kanehisa Laboratories
Fig. 5
Fig. 5
Screening for key metabolic gene and associated ceRNAs. SVM for screening core DElncRNA (a). SVM for screening core DEGs (b). A 3 set Venn diagram (c). The pink circle represents for results of SVM with DElncRNAs, the blue circle represents for DElncRNAs, and the green circle represents for genes with low expression. A 2 set Venn diagram (d): the blue circle represents for batch normalized DEmiRNAs, and the green circle represents for genes with high expression. A 3 set Venn diagram (e): the pink circle represents for results of SVM with DEGs, the blue circle represents for DEGs, the yellow circle represents for dataset of metabolic genes, and the green circle represents for genes with low expression. The expression profile of metabolic gene and associated ceRNAs in cotrol cohort and IDD cohort (AC063977.6, miR-338-3p, PFKFB2,). Expressional values are means ± SD; *, p < 0.05 (f). The expression profile also numerically shown in supplementary Table 7. Validation represents the PFKFB2 expression profile in validation dataset (GSE70362 merging GSE56081)

References

    1. Risbud MV, Shapiro IM. Role of cytokines in intervertebral disc degeneration: pain and disc content. Nat Rev Rheumatol. 2014;10(1):44–56. doi: 10.1038/nrrheum.2013.160. - DOI - PMC - PubMed
    1. Capoor MN, Ruzicka F, Machackova T, Jancalek R, Smrcka M, Schmitz JE, Hermanova M, Sana J, Michu E, Baird JC, et al. Prevalence of Propionibacterium acnes in intervertebral discs of patients undergoing lumbar microdiscectomy: a prospective cross-sectional study. PLoS One. 2016;11(8):e0161676. doi: 10.1371/journal.pone.0161676. - DOI - PMC - PubMed
    1. Zhao K, Zhang Y, Yuan H, Zhao M, Zhao D. Long noncoding RNA LINC00958 accelerates the proliferation and matrix degradation of the nucleus pulposus by regulating miR-203/SMAD3. Aging. 2019;11(23):10814–10825. doi: 10.18632/aging.102436. - DOI - PMC - PubMed
    1. Jensen M, Röthlisberger U, Rovira C. Hydroxide and proton migration in aquaporins. Biophys J. 2005;89(3):1744–1759. doi: 10.1529/biophysj.104.058206. - DOI - PMC - PubMed
    1. Leveillard T, Philp NJ, Sennlaub F. Is Retinal Metabolic Dysfunction at the Center of the Pathogenesis of Age-related Macular Degeneration? Int J Mol Sci. 2019;20(3). - PMC - PubMed

LinkOut - more resources