. 2021 Mar 6;12(1):165.
doi: 10.1186/s13287-021-02227-7.

Effect of fibronectin, FGF-2, and BMP4 in the stemness maintenance of BMSCs and the metabolic and proteomic cues involved

Affiliations

Effect of fibronectin, FGF-2, and BMP4 in the stemness maintenance of BMSCs and the metabolic and proteomic cues involved

Lingling Chen et al. Stem Cell Res Ther. .

Abstract

Background: Growing evidence suggests that the pluripotent state of mesenchymal stem cells (MSCs) relies on specific local microenvironmental cues such as adhesion molecules and growth factors. Fibronectin (FN), fibroblast growth factor 2 (FGF2), and bone morphogenetic protein 4 (BMP4) are the key players in the regulation of stemness and lineage commitment of MSCs. Therefore, this study was designed to investigate the pluripotency and multilineage differentiation of bone marrow-derived MSCs (BMSCs) with the introduction of FN, FGF-2, and BMP4 and to identify the metabolic and proteomic cues involved in stemness maintenance.

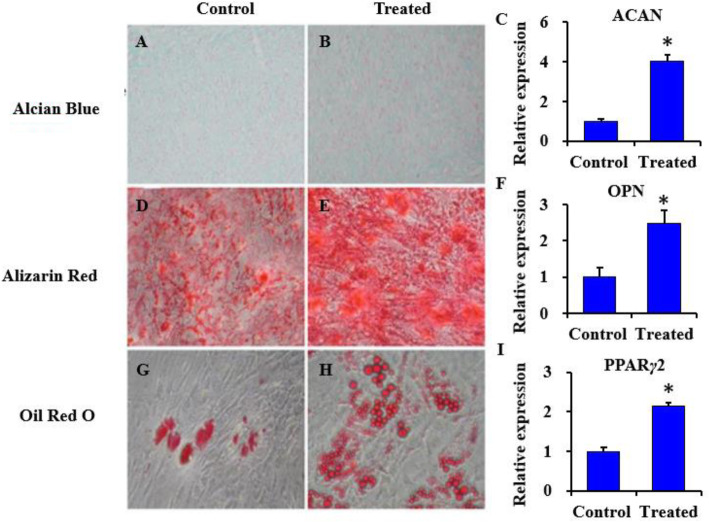
Methods: To elucidate the stemness of BMSCs when treated with FN, FGF-2, and BMP4, the pluripotency markers of OCT4, SOX2, and c-MYC in BMSCs were monitored by real-time PCR and/or western blot. The nuclear translocation of OCT4, SOX2, and c-MYC was investigated by immunofluorescence staining. Multilineage differentiation of the treated BMSCs was determined by relevant differentiation markers. To identify the molecular signatures of BMSC stemness, gas chromatography-mass spectrometry (GC-MS), liquid chromatography-tandem mass spectrometry (LC-MS/MS), and bioinformatics analysis were utilized to determine the metabolite and protein profiles associated with stem cell maintenance.

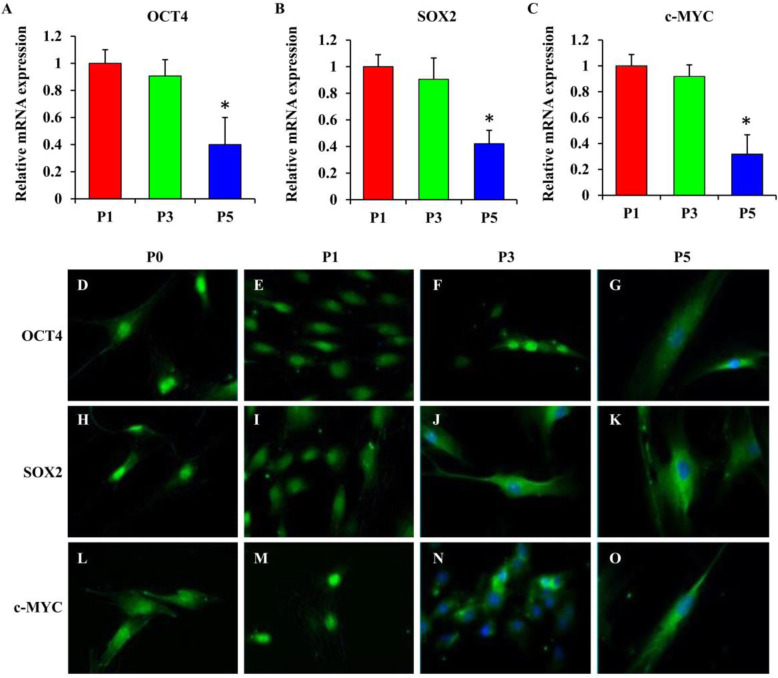
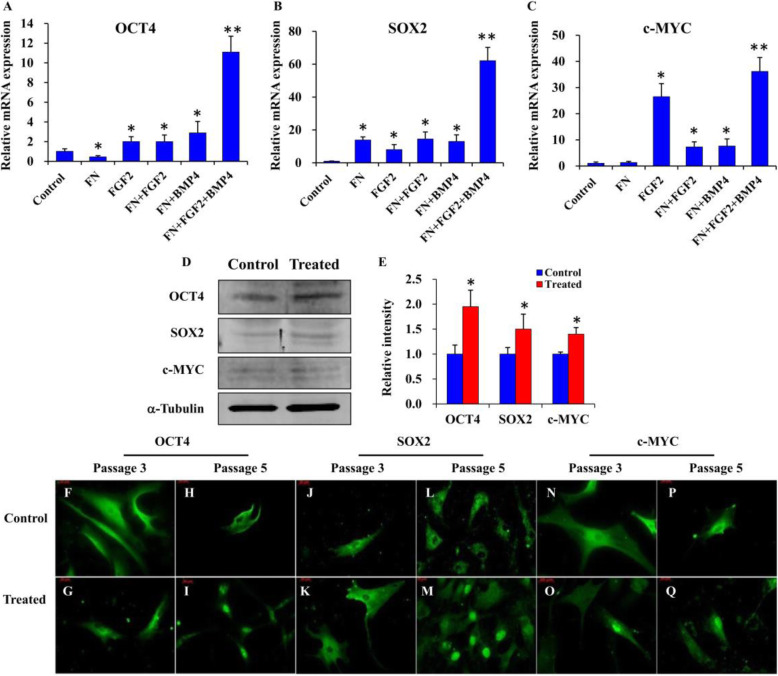
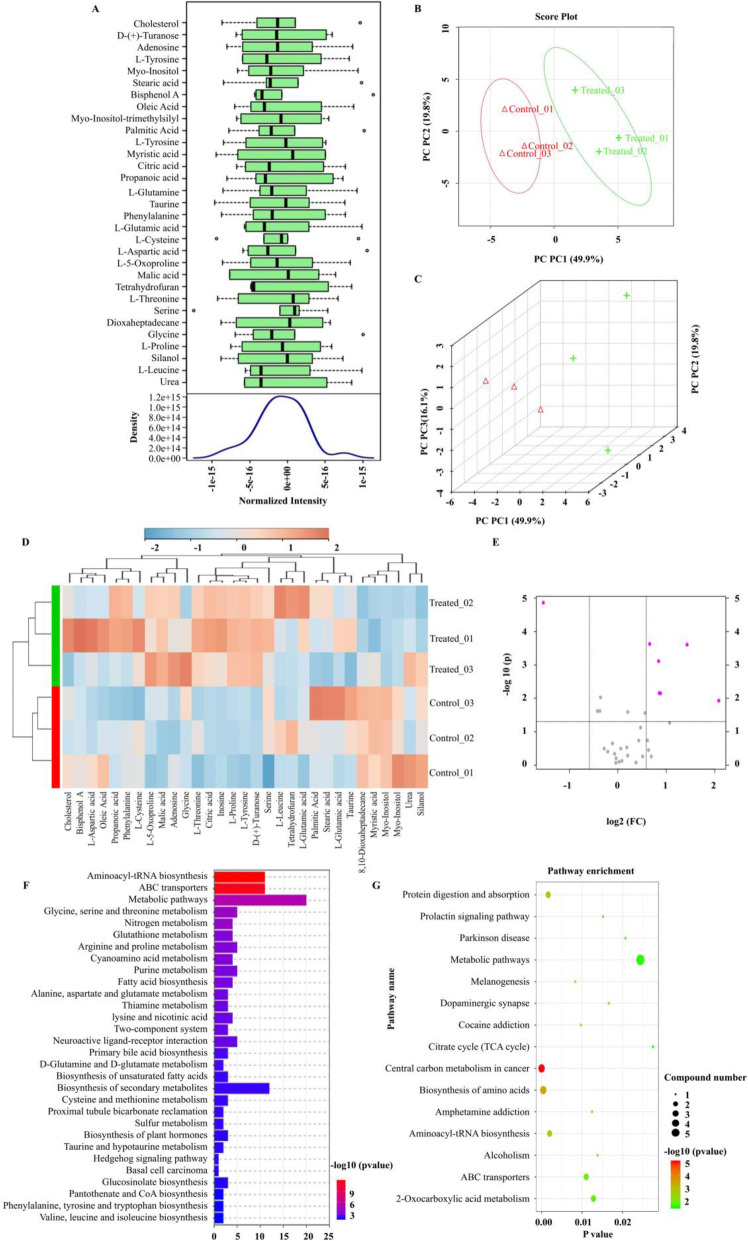
Results: Our results demonstrated that the expression of stemness markers decreased with BMSC passaging, and the manipulation of the microenvironment with fibronectin and growth factors (FGF2 and BMP4) can significantly improve BMSC stemness. Of note, we revealed 7 differentially expressed metabolites, the target genes of these metabolites may have important implications in the maintenance of BMSCs through their effects on metabolic activity, energy production, and potentially protein production. We also identified 21 differentially abundant proteins, which involved in multiple pathways, including metabolic, autophagy-related, and signaling pathways regulating the pluripotency of stem cells. Additionally, bioinformatics analysis comfirned the correlation between metabolic and proteomic profiling, suggesting that the importance of metabolism and proteome networks and their reciprocal communication in the preservation of stemness.

Conclusions: These results indicate that the culture environment supplemented with the culture cocktail (FN, FGF2, and BMP4) plays an essential role in shaping the pluripotent state of BMSCs. Both the metabolism and proteome networks are involved in this process and the modulation of cell-fate decision making. All these findings may contribute to the application of MSCs for regenerative medicine.

Keywords: Growth factor; Mesenchymal stem cells (MSCs); Metabolite; Proteome; Regenerative medicine; Stemness maintenance.


Conflict of interest statement

The authors declare that they have no competing interests.

Figures

Fig. 1
Fig. 1
Expression of OCT4, SOX2, and c-MYC in BMSCs at various passages. ac The mRNA expressions of OCT4, SOX2, and c-MYC were downregulated in BMSC cultures at passage 5 compared to those at passages 1 and 3. The primary antibody of each target protein OCT4 (dg), SOX2 (hk), and c-MYC (lo) was detected with Alexa Fluor 488 (green stain) at various passages. Statistical significance was accepted at *p < 0.05
Fig. 2
Fig. 2
The expression and translocation pattern of OCT4, SOX2, and c-MYC with the stimulation of FN + FGF2 + BMP4. ac All treatments transiently induced the expressions of OCT4, SOX2, and c-MYC, and the induction effect of FN + FGF2 + BMP4 was most obvious. d, e Treated cells with FN + FGF2 + BMP4 enhanced the protein expression of OCT4, SOX2, and c-MYC. The primary antibody of each target protein OCT4 (fi), SOX2 (jm), and c-MYC c (nq) was detected with Alexa Fluor 488 (green stain). Nuclear translocation of the target transcription factors was observed in all treated samples (FN + FGF2 + BMP4) at passage 5. Statistical significance was accepted at *p < 0.05 or **p < 0.001
Fig. 3
Fig. 3
The differentiation potential of control and treated BMSCs. Treated (FN + FGF2 + BMP4) and control BMSCs at passage 5 were induced in chondrogenic, osteogenic, and adipogenic medium for 21 days, followed by staining and qRT-PCR analysis (ah). Strong staining for all three lineages was observed in treated BMSCs. The qRT-PCR analysis for c ACAN, f OPN, and i PPARγ2 revealed higher expression of lineage-specific markers in treated BMSCs. Statistical significance was accepted at *p < 0.05
Fig. 4
Fig. 4
GC-MS analysis of treated BMSCs compared to untreated BMSCs. a Box plots and kernel density plots after normalization. b, c 2 and 3D score plot between all samples. The explained variances were shown in brackets. d Heatmap showed 31 metabolites identified by GC-MS. e Volcano plots demonstrated differential abundance between two groups. The vertical lines corresponded to a 1.5-fold increase and decrease in abundance and the horizontal line represents a p value of 0.05. The colored dots in the plot represent the metabolites that exhibited statistically significant differential abundance compared to controls. f KEGG pathway annotation of the analytes where the horizontal axis represents the number of metabolite pathway associated genes. g KEGG pathway annotation of the differentially abundant analytes. The horizontal axis indicated p value and vertical ordinates were the terms of the pathways. The size of the node indicates the number of metabolite pathway-associated genes matched in the pathways. The degree of color represents −log10 (p value): Logarithmic conversion of Fisher’s exact test p value, indicating the significance of pathway correlations
Fig. 5
Fig. 5
Proteomic characterization of treated BMSCs compared to untreated BMSCs. a Box plots to visualize the distributions of a dataset. The box plots in the same figure indicated that the distribution of the intensities among all samples was nearly the same. b 3D score plot for all samples. The explained variances were shown in brackets. c Hierarchical clustering was performed with the h.clust function in a statistical package, and the clustering result was shown in the form of a heatmap. d Correlation analysis could be used to visualize the overall correlations between different samples. e Volcano plots were used to demonstrate differential abundance between two groups. The vertical lines corresponded to 1.5-fold up and down and the horizontal line represented a p value of 0.05. The colored dots in the plot represented the differentially abundant proteins with statistical significance. f Heatmap showed 21 differentially abundant proteins among samples (high relative abundance in red, and low relative abundance in green or black). g Gene ontology (GO) analysis of differentially abundant proteins. The vertical axis represented the gene ratio (the ratio of the gene count in GO terms to the total differentially expressed genes count) and the horizontal axis described the enrichment components. BP biological process, CC cellular component, MF molecular function. h KEGG significant enrichment analysis for the differentially abundant proteins. The horizontal axis indicated p value and vertical ordinates were the terms of the pathways. The size of the node indicated the number of genes matched in the pathways. The degree of color represented −log10 (p value): Logarithmic conversion of Fisher’s exact test p value, indicating the significance of pathway correlations

Similar articles

Cited by

References

    1. Zhou Y, Fan W, Prasadam I, Crawford R, Xiao Y. Implantation of osteogenic differentiated donor mesenchymal stem cells causes recruitment of host cells. J Tissue Eng Regen Med. 2015;9:118–126. - PubMed
    1. Zakrzewski W, Dobrzyński M, Szymonowicz M, Rybak Z. Stem cells: past, present, and future. Stem Cell Res Ther. 2019;10:68. - PMC - PubMed
    1. Xiang Y, Wu C, Wu J, Quan W, Cheng C, Zhou J, et al. In vitro expansion affects the response of human bone marrow stromal cells to irradiation. Stem Cell Res Ther. 2019;10:82. - PMC - PubMed
    1. Liu Z, Li T, Zhu F, Deng S, Li X, He Y. Regulatory roles of Mir-22/Redd1-mediated mitochondrial Ros and cellular autophagy in ionizing radiation-induced Bmsc injury. Cell Death Dis. 2019;10:227. - PMC - PubMed
    1. Liesveld JL, Sharma N, Aljitawi OS. Stem cell homing: from physiology to therapeutics. Stem Cells. 2020;38:1241-53. - PubMed

Publication types

LinkOut - more resources