Medical imaging and nuclear medicine: a Lancet Oncology Commission
- PMID: 33676609
- PMCID: PMC8444235
- DOI: 10.1016/S1470-2045(20)30751-8
Medical imaging and nuclear medicine: a Lancet Oncology Commission
Abstract
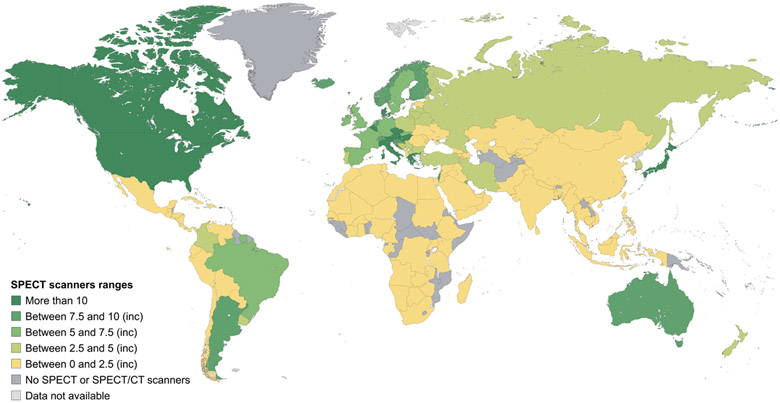
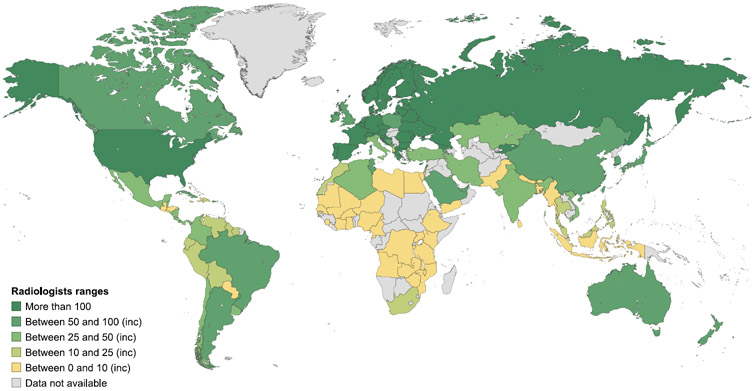
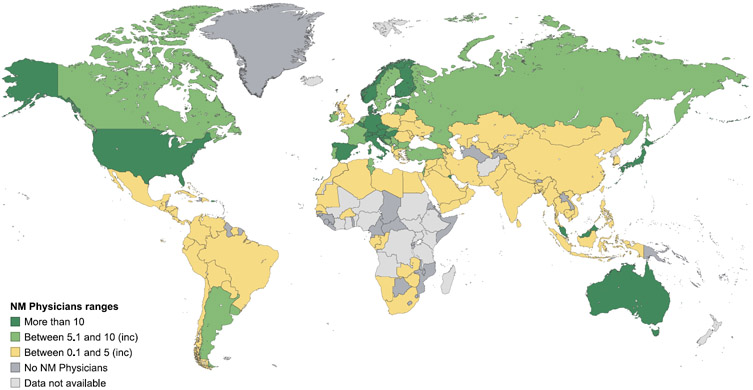
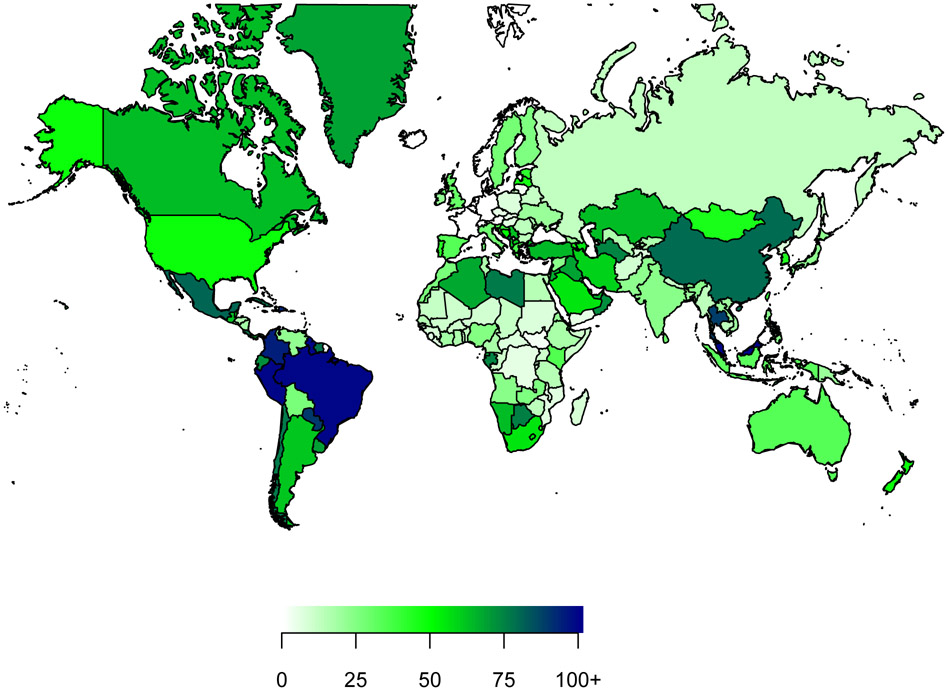
The diagnosis and treatment of patients with cancer requires access to imaging to ensure accurate management decisions and optimal outcomes. Our global assessment of imaging and nuclear medicine resources identified substantial shortages in equipment and workforce, particularly in low-income and middle-income countries (LMICs). A microsimulation model of 11 cancers showed that the scale-up of imaging would avert 3·2% (2·46 million) of all 76·0 million deaths caused by the modelled cancers worldwide between 2020 and 2030, saving 54·92 million life-years. A comprehensive scale-up of imaging, treatment, and care quality would avert 9·55 million (12·5%) of all cancer deaths caused by the modelled cancers worldwide, saving 232·30 million life-years. Scale-up of imaging would cost US$6·84 billion in 2020-30 but yield lifetime productivity gains of $1·23 trillion worldwide, a net return of $179·19 per $1 invested. Combining the scale-up of imaging, treatment, and quality of care would provide a net benefit of $2·66 trillion and a net return of $12·43 per $1 invested. With the use of a conservative approach regarding human capital, the scale-up of imaging alone would provide a net benefit of $209·46 billion and net return of $31·61 per $1 invested. With comprehensive scale-up, the worldwide net benefit using the human capital approach is $340·42 billion and the return per dollar invested is $2·46. These improved health and economic outcomes hold true across all geographical regions. We propose actions and investments that would enhance access to imaging equipment, workforce capacity, digital technology, radiopharmaceuticals, and research and training programmes in LMICs, to produce massive health and economic benefits and reduce the burden of cancer globally.
Copyright © 2021 Elsevier Ltd. All rights reserved.
Conflict of interest statement
Figures

Comment in
-
A southeast Asia perspective on medical imaging and nuclear medicine.Lancet Oncol. 2021 Apr;22(4):426-427. doi: 10.1016/S1470-2045(21)00069-3. Epub 2021 Mar 4. Lancet Oncol. 2021. PMID: 33676602 No abstract available.
-
Improving the view: the need for global action on universal access to cancer imaging.Lancet Oncol. 2021 Apr;22(4):422-423. doi: 10.1016/S1470-2045(21)00093-0. Epub 2021 Mar 4. Lancet Oncol. 2021. PMID: 33676603 No abstract available.
-
The benefits of integrating medical imaging and nuclear medicine.Lancet Oncol. 2021 Apr;22(4):427-429. doi: 10.1016/S1470-2045(21)00089-9. Epub 2021 Mar 4. Lancet Oncol. 2021. PMID: 33676604 No abstract available.
-
Global access to medical imaging and nuclear medicine.Lancet Oncol. 2021 Apr;22(4):425-426. doi: 10.1016/S1470-2045(21)00070-X. Epub 2021 Mar 4. Lancet Oncol. 2021. PMID: 33676606 No abstract available.
-
Imaging: towards a global solution to overcome the cancer pandemic.Lancet Oncol. 2021 Apr;22(4):430-432. doi: 10.1016/S1470-2045(21)00078-4. Epub 2021 Mar 4. Lancet Oncol. 2021. PMID: 33676607 No abstract available.
-
The importance of medical imaging and nuclear medicine in universal health coverage.Lancet Oncol. 2021 Apr;22(4):423-424. doi: 10.1016/S1470-2045(21)00092-9. Epub 2021 Mar 4. Lancet Oncol. 2021. PMID: 33676608 No abstract available.
-
How can we achieve equitable global access to cancer imaging and care?Lancet Oncol. 2021 Apr;22(4):429-430. doi: 10.1016/S1470-2045(21)00068-1. Epub 2021 Mar 4. Lancet Oncol. 2021. PMID: 33676610 No abstract available.
-
Medical imaging and nuclear medicine: points to note.Lancet Oncol. 2021 Jun;22(6):e225. doi: 10.1016/S1470-2045(21)00184-4. Lancet Oncol. 2021. PMID: 34087135 No abstract available.
-
Medical imaging and nuclear medicine: points to note.Lancet Oncol. 2021 Jun;22(6):e226. doi: 10.1016/S1470-2045(21)00292-8. Lancet Oncol. 2021. PMID: 34087136 No abstract available.
References
-
- Bray F, Ferlay J, Soerjomataram I, Siegel RL, Torre LA, Jemal A. Global cancer statistics 2018: GLOBOCAN estimates of incidence and mortality worldwide for 36 cancers in 185 countries. CA Cancer J Clin 2018; 68(6): 394–424 - PubMed
-
- Ferlay J, Soerjomataram I, Dikshit R, et al. Cancer incidence and mortality worldwide: sources, methods and major patterns in GLOBOCAN 2012. Int J Cancer 2015; 136: E359–86. - PubMed
-
- Bray F, Jemal A, Grey N, Ferlay J, Forman D. Global cancer transitions according to the Human Development Index (2008-2030): a population-based study. Lancet Oncol 2012; 13(8): 790–801. - PubMed
-
- Stewart BW, Wild CP, eds. World Cancer Report, 2014. International Agency for Research on Cancer. Lyon, 2014. Available at: https://publications.iarc.fr/Non-Series-Publications/World-Cancer-Report.... .
-
- Farmer P, Frenk J, Knaul FM, et al. Expansion of cancer care and control in countries of low and middle income: a call to action. Lancet 2010; 376(9747): 1186–93. - PubMed
Publication types
MeSH terms
Grants and funding
LinkOut - more resources
Full Text Sources
Other Literature Sources
Medical