. 2021:20:100063.
doi: 10.1016/j.mcpro.2021.100063. Epub 2021 Mar 5.

Quantitative Proteomics and Phosphoproteomics Support a Role for Mut9-Like Kinases in Multiple Metabolic and Signaling Pathways in Arabidopsis

Affiliations

Quantitative Proteomics and Phosphoproteomics Support a Role for Mut9-Like Kinases in Multiple Metabolic and Signaling Pathways in Arabidopsis

Margaret E Wilson et al. Mol Cell Proteomics. 2021.

Abstract

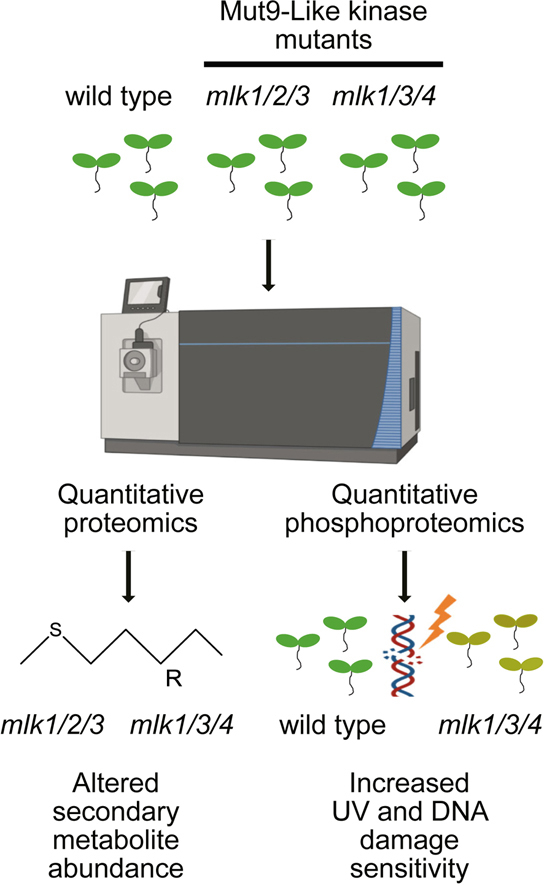
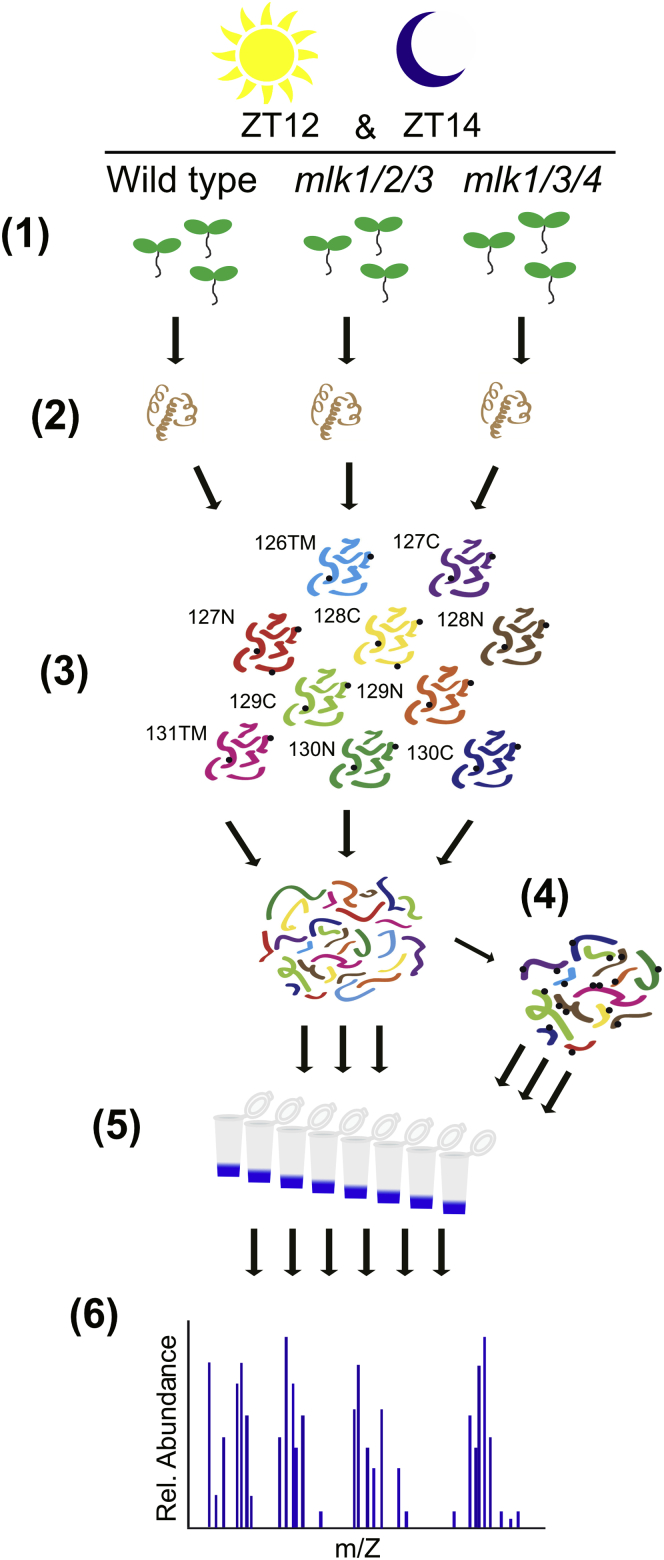
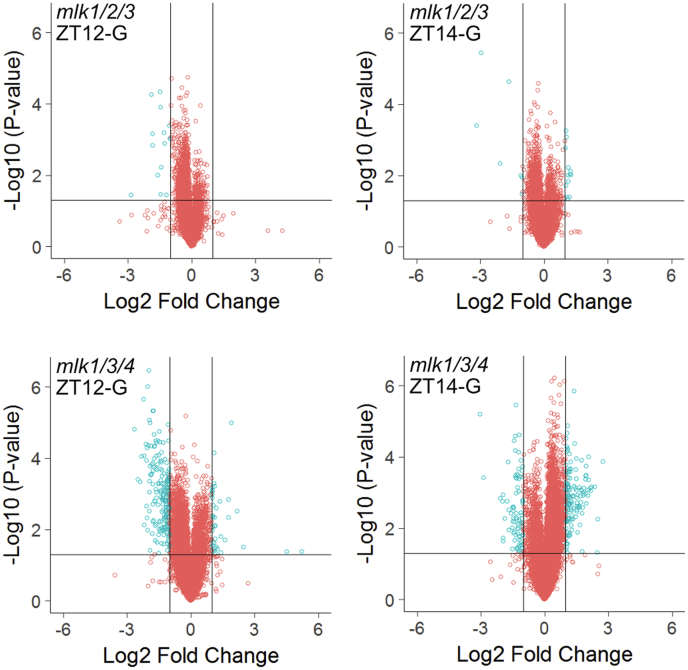
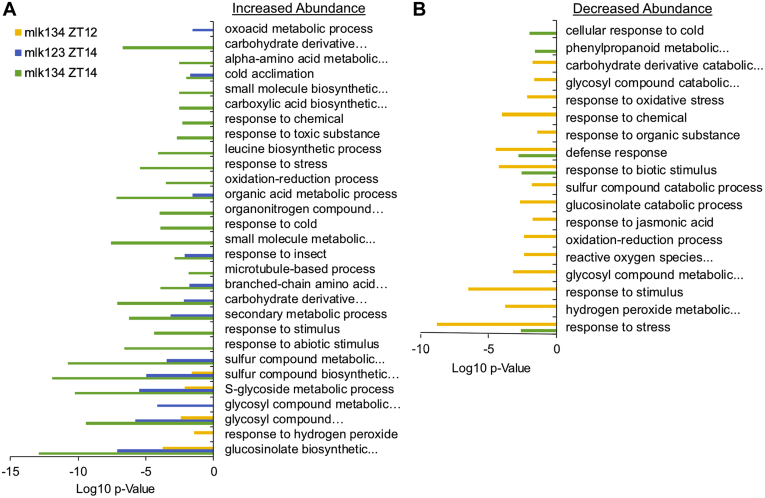
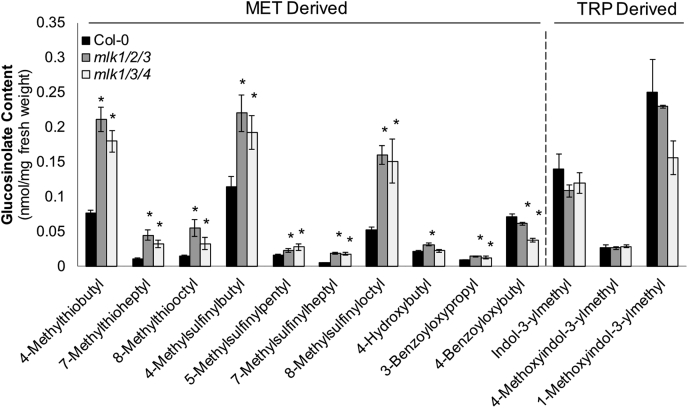
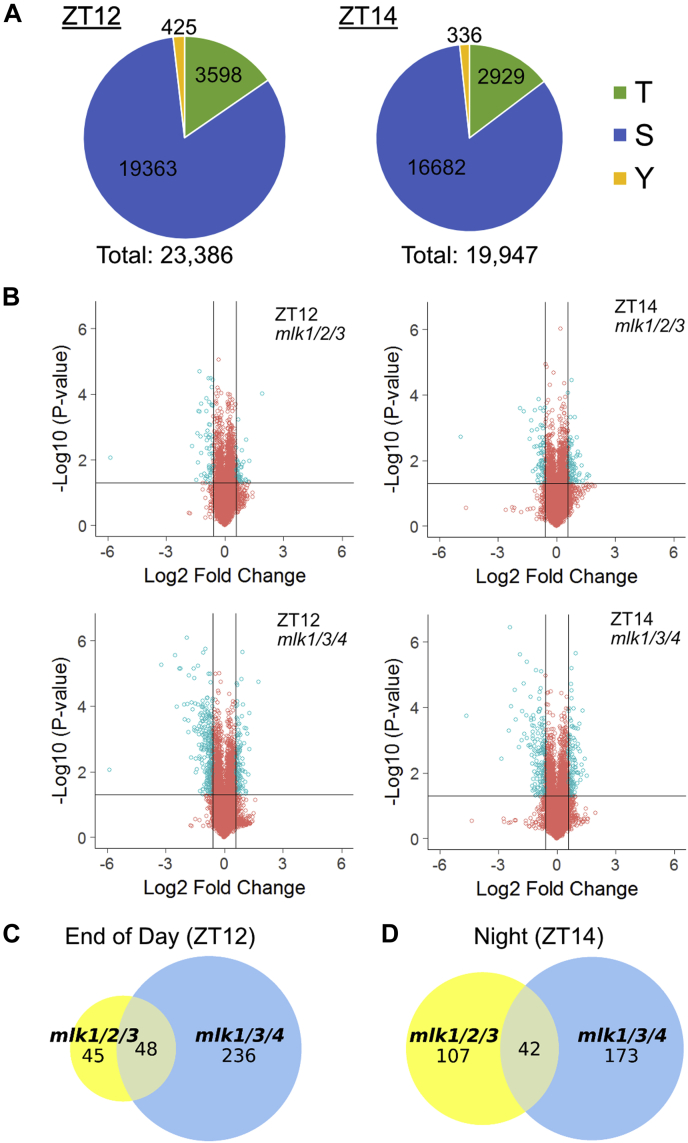
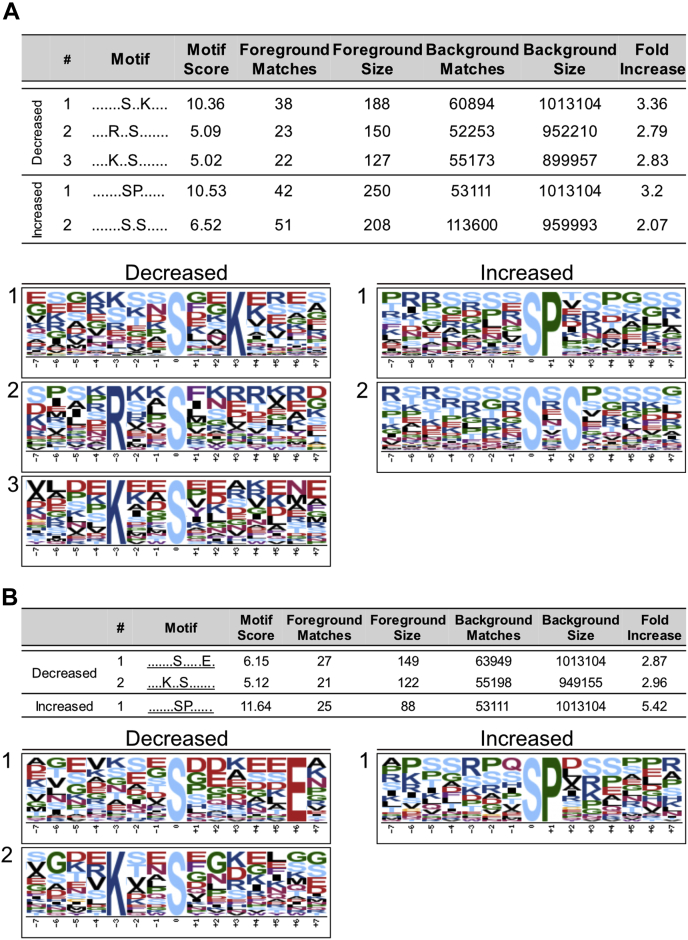
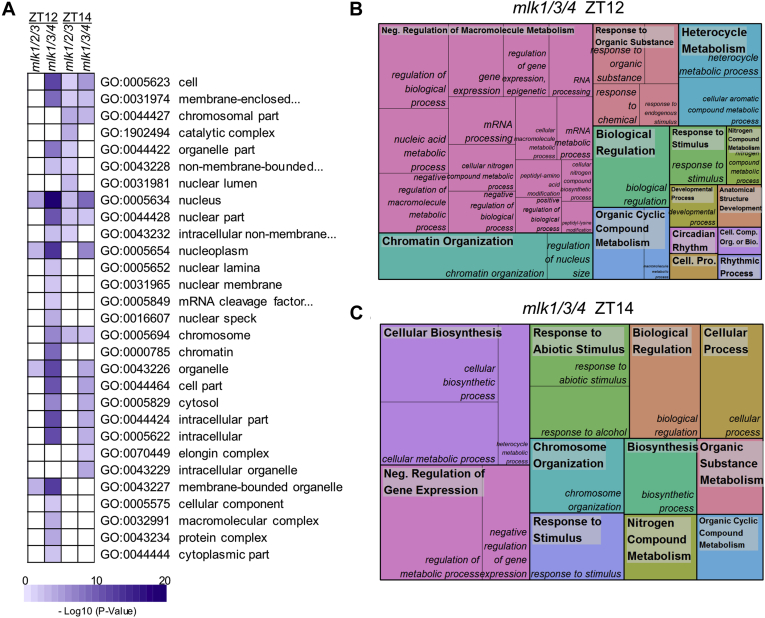
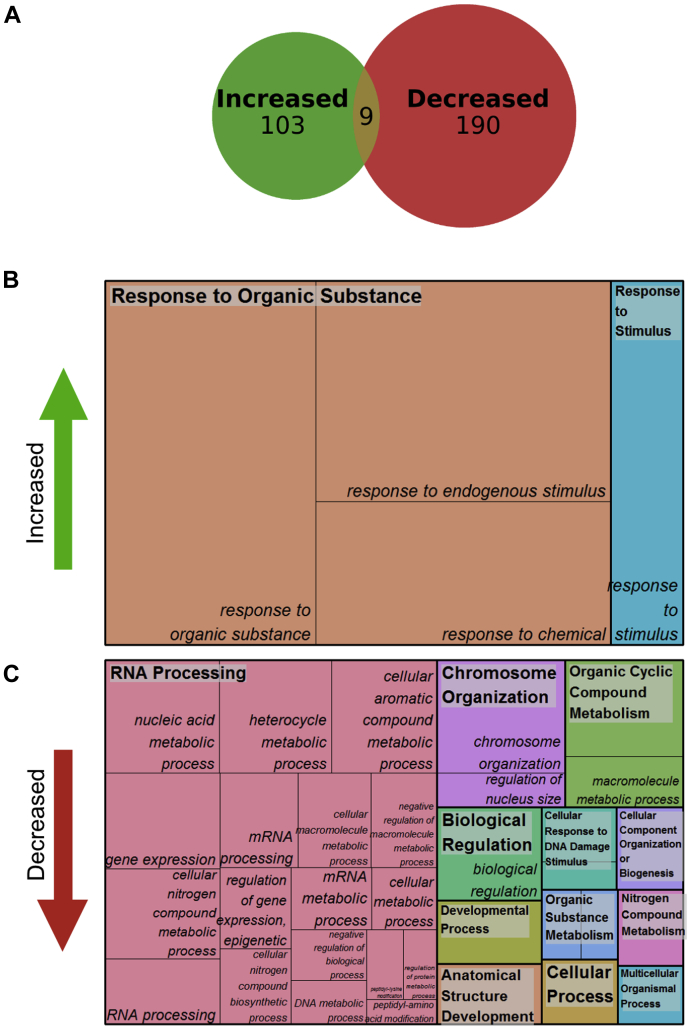
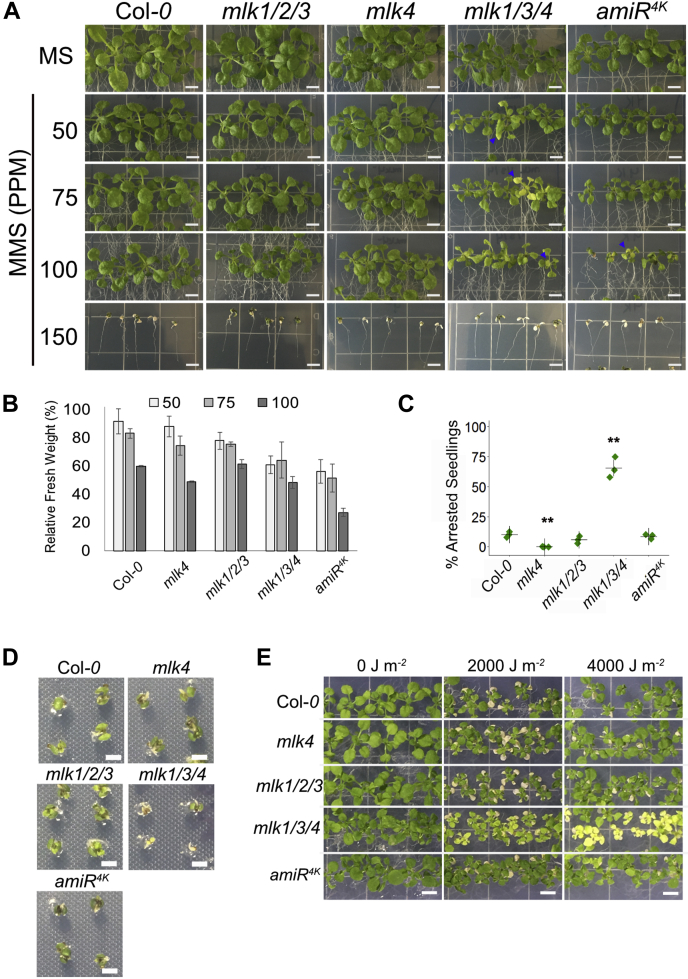
Protein phosphorylation is one of the most prevalent posttranslational modifications found in eukaryotic systems. It serves as a key molecular mechanism that regulates protein function in response to environmental stimuli. The Mut9-like kinases (MLKs) are a plant-specific family of Ser/Thr kinases linked to light, circadian, and abiotic stress signaling. Here we use quantitative phosphoproteomics in conjunction with global proteomic analysis to explore the role of the MLKs in daily protein dynamics. Proteins involved in light, circadian, and hormone signaling, as well as several chromatin-modifying enzymes and DNA damage response factors, were found to have altered phosphorylation profiles in the absence of MLK family kinases. In addition to altered phosphorylation levels, mlk mutant seedlings have an increase in glucosinolate metabolism enzymes. Subsequently, we show that a functional consequence of the changes to the proteome and phosphoproteome in mlk mutant plants is elevated glucosinolate accumulation and increased sensitivity to DNA damaging agents. Combined with previous reports, this work supports the involvement of MLKs in a diverse set of stress responses and developmental processes, suggesting that the MLKs serve as key regulators linking environmental inputs to developmental outputs.

Keywords: DNA damage; arabidopsis; circadian; kinase; plants; quantitative phosphoproteomics; quantitative proteomics.


Conflict of interest statement

Conflict of interest The authors declare no competing interests.

Figures

None
Graphical abstract
Fig. 1
Fig. 1
Schematic representation of the quantitative proteomics workflow. Tissue samples were collected at ZT12 and ZT14 from WT and mutant seedlings entrained with a 12L:12D light/dark cycle (1). Total protein was extracted and digested (2). Following TMT10plex isobaric labeling (3), samples were subjected to high pH reversed phase prefractionation (5). Phosphopeptides were enriched using a TiO2-based method (4). Both phosphopeptide-enriched and global samples were analyzed by LC-MS/MS (6). ZT 12, Zeitgeber 12; ZT 14, Zeitgeber 14.
Fig. 2
Fig. 2
Global proteomic analysis of mlk mutant seedlings. Volcano plots of peptides identified in mutant and WT seedlings at ZT12 and ZT14. The x-axis specifies the log2 fold-change (FC) of mutant/WT, and the y-axis specifies the negative logarithm to the base 10 of the t test p-values. Open circles represent individual peptides, with blue circles specifying those considered statistically significant. Black vertical and horizontal lines reflect the filtering criteria (log2 FC = ±1 and p-value = 0.05) for significance. ZT 12, Zeitgeber 12; ZT 14, Zeitgeber 14.
Fig. 3
Fig. 3
Gene ontology (GO) enrichment analysis. GO enrichment analysis of proteins identified as having increased (A) or decreased (B) abundance in mlk mutant seedlings at indicated ZTs when compared with WT. Cluster representative GO terms identified with REVIGO (semantic similarity threshold <0.7) in the category of Biological Process are shown. ZT, Zeitgeber.
Fig. 4
Fig. 4
mlk mutant seedlings contain elevated levels of Met-derived glucosinolates. Glucosinolate (GLS) content of 10-day-old mutant and WT seedlings at ZT12 was quantified using HPLC. GLS identity determined using UV spectra and confirmed by LC-MS/MS. The average of four biological replicates is presented. Error bars indicate standard deviation. ∗p < 0.01, compared with WT seedlings (Student’s t test). ZT 12, Zeitgeber 12.
Fig. 5
Fig. 5
Analysis of quantitative phosphoproteomics of mlk mutant seedlings. A, the distribution of threonine (T), serine (S), and tyrosine (Y) phosphorylation sites identified at ZT12 and ZT14. B, volcano plot of phosphopeptides identified in mutant and WT seedlings at ZT12 and ZT14. The x-axis specifies the log2 fold-change (FC) of mutant/WT, and the y-axis specifies the negative logarithm to the base 10 of the t test p-values. Open circles represent individual peptides, with blue circles specifying those considered statistically significant. Black vertical and horizontal lines reflect the filtering criteria (log2 FC = ±0.585 and p-value = 0.05) for significance. C and D, size-proportional Venn diagrams of differentially regulated phosphoproteins in mlk1/2/3 and mlk1/3/4 mutants at ZT12 (C) and ZT14 (D). Numbers indicate unique phosphoproteins. ZT 12, Zeitgeber 12; ZT 14, Zeitgeber 14.
Fig. 6
Fig. 6
Motif analysis of differentially phosphorylated peptides. Phosphopeptides with altered abundance in mlk1/3/4 mutants at ZT12 (A) and ZT14 (B) where extended (http://schwartzlab.uconn.edu/pepextend) and centered. Motif-X analysis was then preformed with the probability threshold set to p-value ≤ 10−6, the occurrence threshold was set to 20, and the default IPI Arabidopsis Proteome dataset was used as the background dataset. ZT 12, Zeitgeber 12; ZT 14, Zeitgeber 14.
Fig. 7
Fig. 7
Gene ontology (GO) enrichment analysis of differentially phosphorylated proteins. A, heat map showing the p-value significance of enriched cellular component GO categories of proteins with altered abundance in mlk mutant seedlings at ZT12 and ZT14. B and C, treemap representation of biological process GO categories enriched in mlk1/3/4 mutant seedlings at ZT12 (B) and ZT14 (C). The box size correlates to the −log10 p-value of the GO-term enrichment. Boxes with the same color indicate related GO-terms and correspond to the representative GO-term which is found in the upper-left of each box. REVIGO was used to eliminate redundant GO-terms with a dispensability value ≥0.7 (A) or ≥0.5 (B and C). ZT 12, Zeitgeber 12; ZT 14, Zeitgeber 14.
Fig. 8
Fig. 8
Analysis of differentially phosphorylated peptides in mlk1/3/4 mutants at ZT12. A, size-proportional Venn diagram of proteins which show increased, decreased, or both increased and decreased abundance of identified phosphosites in mlk1/3/4 mutant seedlings at ZT12. Numbers indicate unique phosphoproteins. Analysis of phosphoproteins that show increased (B) or decreased (C) in abundance in the mlk1/3/4 mutant seedlings background at ZT12. Treemap representations of biological process GO category enrichment are shown. The box size correlates to the −log10 p-value of the GO-term enrichment. Boxes with the same color indicate related GO-terms and correspond to the representative GO-term which is found in the upper-left of each box. REVIGO was used to eliminate redundant GO-terms with a dispensability value ≥0.5. ZT 12, Zeitgeber 12; ZT 14, Zeitgeber 14.
Fig. 9
Fig. 9
mlk1/3/4 mutants have increased sensitivity to MMS treatment. A, representative images of mutant and WT seedlings 15 days after transfer to solid media containing the indicated concentration of MMS. Chlorotic tissue is denoted with a blue arrowhead. Scale bar = 5 mm. B, fresh weight of 21-day-old WT and mutant seedlings grown in the presence of MMS relative to mock treated samples. The average of three biological replicates of ≥10 seedlings each is presented. C, percent of seedlings exhibiting postgermination developmental arrest after 12 days of growth in the presence of 150 ppm MMS. The average of three biological replicates of ≥30 seedlings is presented. B and C, error bars indicate standard deviation. ∗p < 0.05, ∗∗p < 0.01 compared with WT seedlings (Student’s t test). D, representative images of mutant and WT seedlings germinated in the presence of 150 ppm MMS. E, representative images of mutant and WT seedlings irradiated with indicated levels of UV-C. Scale bar = 2 mm. MMS, methyl methane sulfonate.

References

    1. Wang Y., Liu Z., Cheng H., Gao T., Pan Z., Yang Q., Guo A., Xue Y. EKPD: A hierarchical database of eukaryotic protein kinases and protein phosphatases. Nucleic Acids Res. 2014;42:D496–D502. - PMC - PubMed
    1. Mergner J., Frejno M., List M., Papacek M., Chen X., Chaudhary A., Samaras P., Richter S., Shikata H., Messerer M., Lang D., Altmann S., Cyprys P., Zolg D.P., Mathieson T. Mass-spectrometry-based draft of the Arabidopsis proteome. Nature. 2020;579:409–414. - PubMed
    1. Silva-Sanchez C., Li H., Chen S. Recent advances and challenges in plant phosphoproteomics. Proteomics. 2015;15:1127–1141. - PubMed
    1. Vlastaridis P., Kyriakidou P., Chaliotis A., Van de Peer Y., Oliver S.G., Amoutzias G.D. Estimating the total number of phosphoproteins and phosphorylation sites in eukaryotic proteomes. Gigascience. 2017;6:1–11. - PMC - PubMed
    1. Ni W., Xu S.L., González-Grandío E., Chalkley R.J., Huhmer A.F.R., Burlingame A.L., Wang Z.Y., Quail P.H. PPKs mediate direct signal transfer from phytochrome photoreceptors to transcription factor PIF3. Nat. Commun. 2017;8:15236. - PMC - PubMed

Publication types

MeSH terms