Meta-Analysis
. 2021:30:102584.
doi: 10.1016/j.nicl.2021.102584. Epub 2021 Feb 10.

Deep learning applications for the classification of psychiatric disorders using neuroimaging data: Systematic review and meta-analysis

Affiliations
Meta-Analysis

Deep learning applications for the classification of psychiatric disorders using neuroimaging data: Systematic review and meta-analysis

Mirjam Quaak et al. Neuroimage Clin. 2021.

Abstract

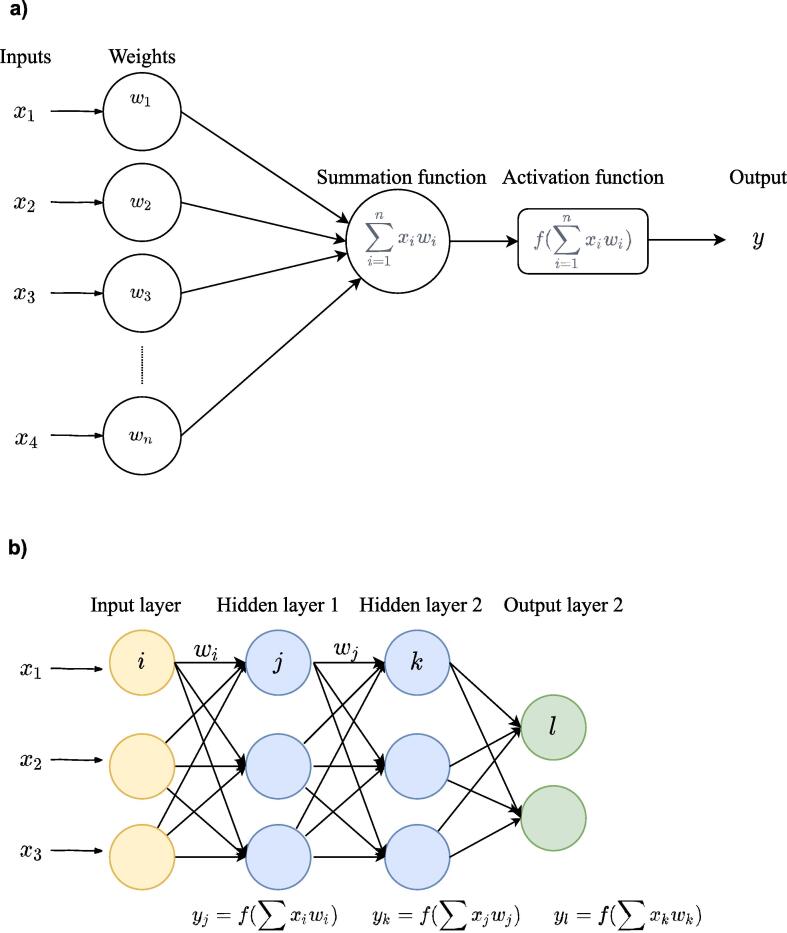
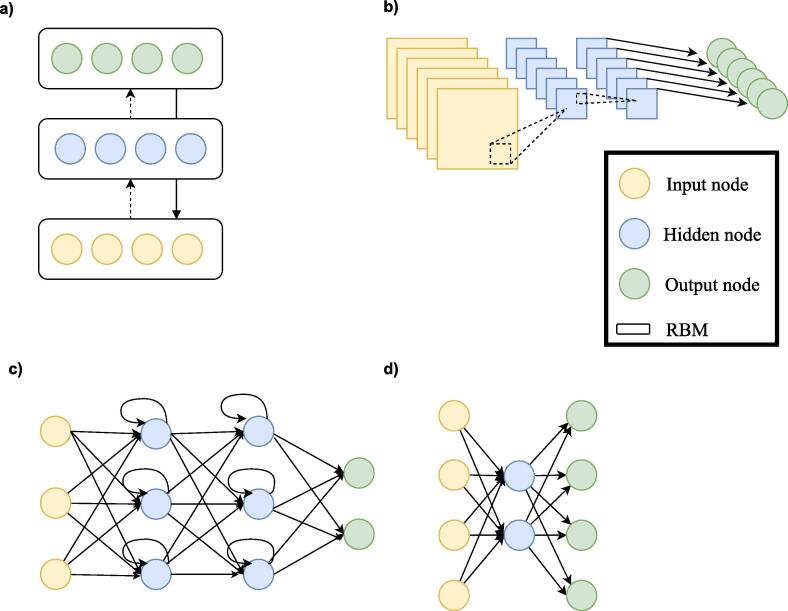
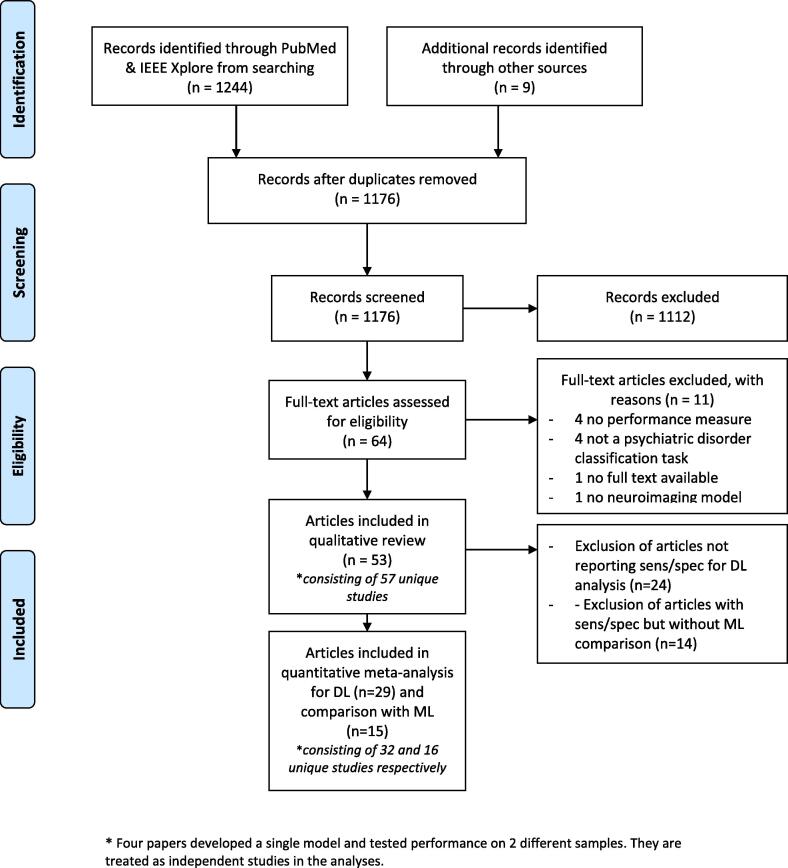
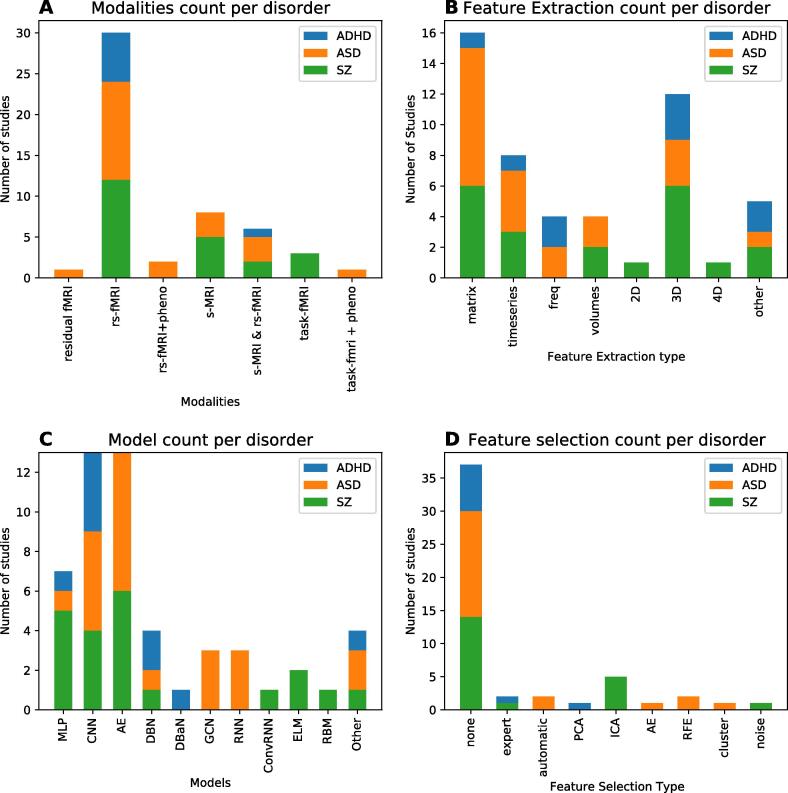
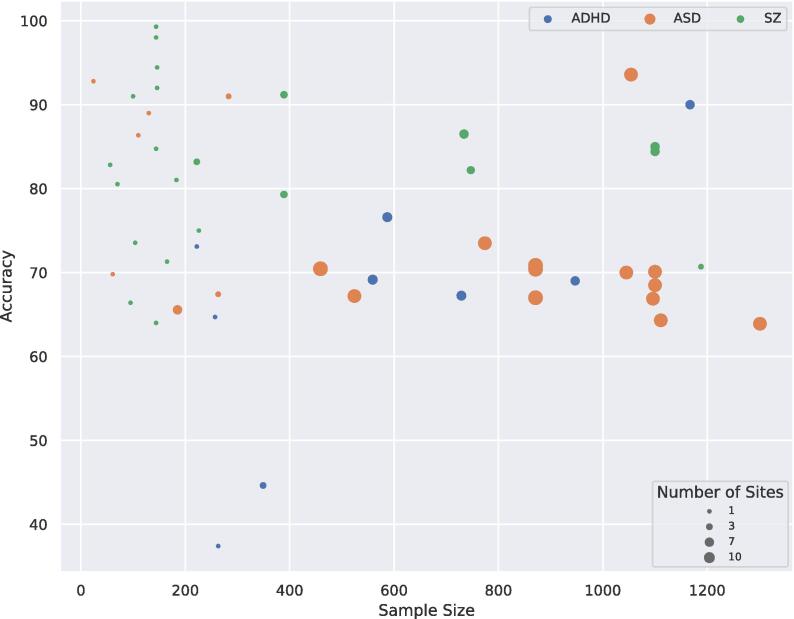
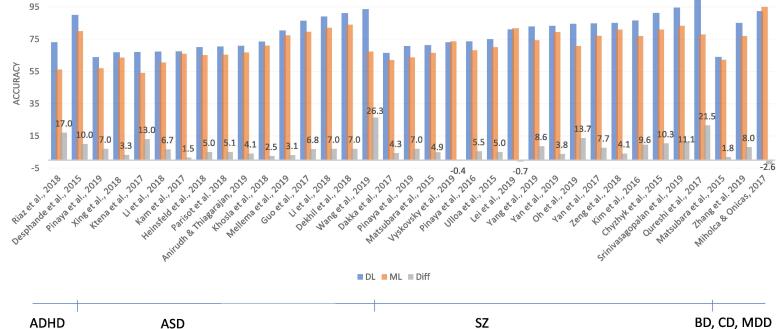
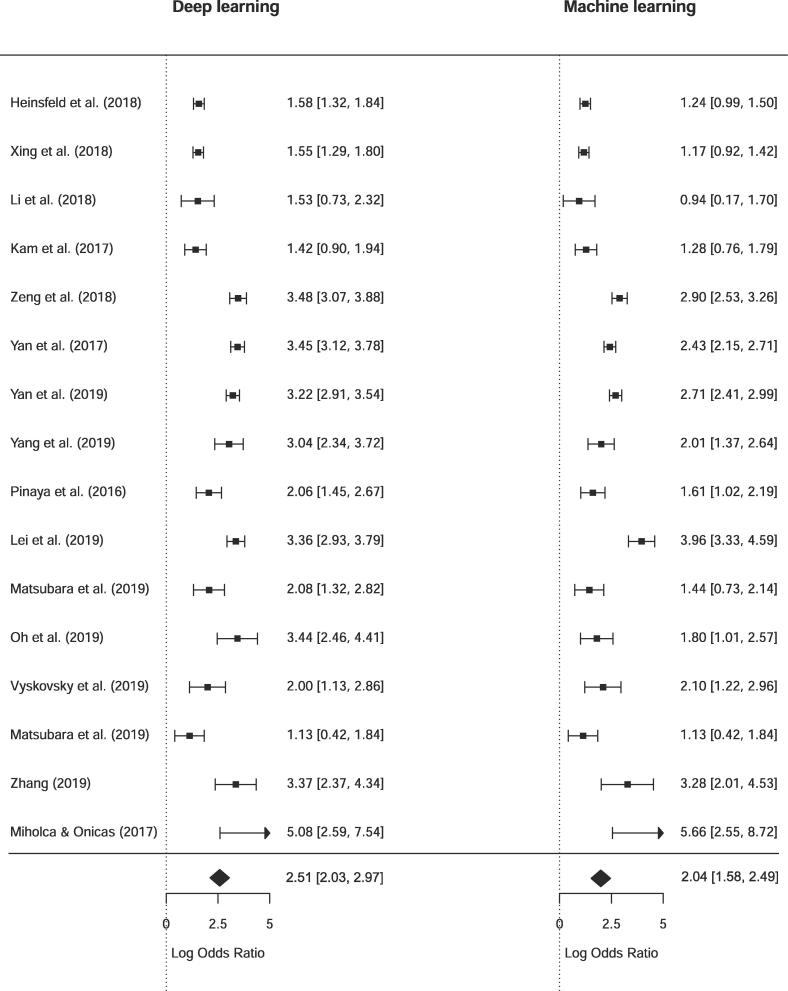
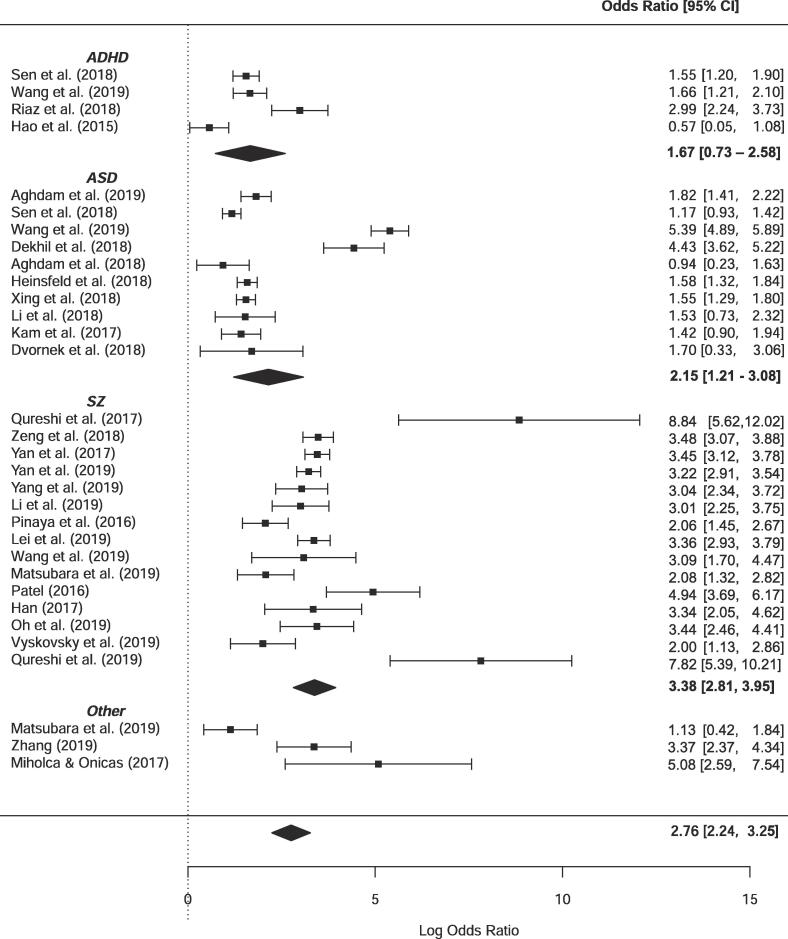
Deep learning (DL) methods have been increasingly applied to neuroimaging data to identify patients with psychiatric and neurological disorders. This review provides an overview of the different DL applications within psychiatry and compares DL model accuracy to standard machine learning (SML). Fifty-three articles were included for qualitative analysis, primarily investigating autism spectrum disorder (ASD; n = 22), schizophrenia (SZ; n = 22) and attention-deficit/hyperactivity disorder (ADHD; n = 9). Thirty-two of the thirty-five studies that directly compared DL to SML reported a higher accuracy for DL. Only sixteen studies could be included in a meta-regression to quantitatively compare DL and SML performance. This showed a higher odds ratio for DL models, though the comparison attained significance only for ASD. Our results suggest that deep learning of neuroimaging data is a promising tool for the classification of individual psychiatric patients. However, it is not yet used to its full potential: most studies use pre-engineered features, whereas one of the main advantages of DL is its ability to learn representations of minimally processed data. Our current evaluation is limited by minimal reporting of performance measures to enable quantitative comparisons, and the restriction to ADHD, SZ and ASD as current research focusses on large publicly available datasets. To truly uncover the added value of DL, we need carefully designed comparisons of SML and DL models which are yet rarely performed.

Keywords: Artificial Intelligence; Deep learning; Machine learning; Neuroimaging; Psychiatry.


Figures

Fig. 1
Fig. 1
a). An artificial neuron or node. Each input × is associated with a weight w. The sum of all weighted inputs is passed onto a nonlinear activation function f that leads to an output y. b) An example of a multilayer perceptron. It shows input layer, two hidden layers and an output layer. For each neuron in the first hidden layer, a nonlinear function is applied to the weighted sum of its inputs. The result of this transformation is the input for the consecutive layer.
Fig. 2
Fig. 2
Architectural structures in deep learning. A. Deep Belief Network (DBN). B. Convolutional neural network (CNN). C. Recurrent neural network (RNN). D. Auto Encoder (AE).
Fig. 3
Fig. 3
PRISMA flowchart describing the processes of literature search, study screening and selection (Moher et al., 2009).
Fig. 4
Fig. 4
Visual summary of articles reviewed grouped by the three most investigated disorders ADHD, ASD and SZ. A) Number of articles on different modalities; B) Number of articles of different feature extraction, C) number of articles on different DL models, D) Number of articles on different feature selection procedures.
Fig. 5
Fig. 5
Scatterplot of accuracy for different sample sizes, the size of the dots indicates the number of scanning sites included in the sample.
Fig. 6
Fig. 6
Results of studies comparing DL and conventional ML models. The graph shows the accuracies (or other reported performance scores: AUC, balanced Acc, F score) for DL models in blue and ML models in orange. The difference between the two groups is depicted in grey. (For interpretation of the references to colour in this figure legend, the reader is referred to the web version of this article.)
Fig. 7
Fig. 7
Forest plot of diagnostic odds ratio for deep learning and machine learning comparison.
Fig. 8
Fig. 8
Univariate random-effect forest plots of log diagnostic odds ratio’s grouped per disorder.

References

    1. Abrol A., Fu Z., Salman M., Silva R., Du Y., Plis S., Calhoun V. Hype versus hope: Deep learning encodes more predictive and robust brain imaging representations than standard machine learning. bioRxiv. 2020
    1. Aghdam M.A., Sharifi A., Pedram M.M. Diagnosis of Autism Spectrum Disorders in Young Children Based on Resting-State Functional Magnetic Resonance Imaging Data Using Convolutional Neural Networks. J Digit Imaging. 2019;32(6):899–918. doi: 10.1007/s10278-019-00196-1. - DOI - PMC - PubMed
    1. Akhavan Aghdam M., Sharifi A., Pedram M.M. Combination of rs-fMRI and sMRI Data to Discriminate Autism Spectrum Disorders in Young Children Using Deep Belief Network. J. Digit. Imaging. 2018;31:895–903. - PMC - PubMed
    1. Anirudh, R., Thiagarajan, J.J., 2017. Bootstrapping Graph Convolutional Neural Networks for Autism Spectrum Disorder Classification. doi:arXiv:1704.07487v2.
    1. Arbabshirani M.R., Plis S., Sui J., Calhoun V.D. Single subject prediction of brain disorders in neuroimaging: Promises and pitfalls. NeuroImage. 2017;145:137–165. doi: 10.1016/j.neuroimage.2016.02.079. - DOI - PMC - PubMed

MeSH terms