. 2021 Apr;100(4):101021.
doi: 10.1016/j.psj.2021.101021. Epub 2021 Jan 28.

An altered gut microbiota in duck-origin parvovirus infection on cherry valley ducklings is associated with mucosal barrier dysfunction

Affiliations

An altered gut microbiota in duck-origin parvovirus infection on cherry valley ducklings is associated with mucosal barrier dysfunction

Qihui Luo et al. Poult Sci. 2021 Apr.

Abstract

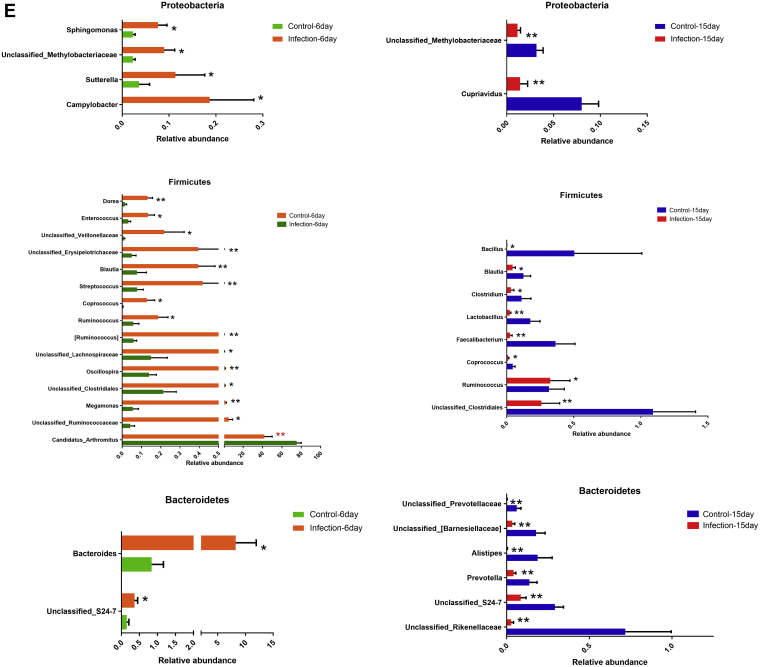
Duck-origin parvovirus disease is an epidemic disease mainly caused by duck-origin goose parvovirus (D-GPV), which is characterized by beak atrophy and dwarfism syndrome. Its main symptoms are persistent diarrhea, skeletal dysplasia, and growth retardation. However, the pathogenesis of Cherry Valley ducks infected by D-GPV has not been studied thoroughly. To perceive the distribution of D-GPV in the intestinal tract, intestinal morphological development, intestinal permeability, inflammatory cytokines in Cherry Valley ducks, and expression of tight junction protein, the D-GPV infection was given intramuscularly. Illumina MiSeq sequencing technology was used to analyze the diversity and structure of ileum flora and content of short-chain fatty acids of its metabolites. To investigate the relationship between intestinal flora changes and intestinal barrier function after D-GPV infection on Cherry Valley ducks is of great theoretical and practical significance for further understanding the pathogenesis of D-GPV and the structure of intestinal flora in ducks. The results showed that D-GPV infection was accompanied by intestinal inflammation and barrier dysfunction. At this time, the decrease of a large number of beneficial bacteria and the content of short-chain fatty acids in intestinal flora led to the weakening of colonization resistance of the intestinal flora and the accumulation of potentially pathogenic bacteria, which would aggravate the negative effect of D-GPV damage to the intestinal tract. Furthermore, a significant increase in Unclassified_S24-7 and decrease in Streptococcus was observed in D-GPV persistent, indicating the disruption in the structure of gut microbiota. Notably, the shift of microbiota was associated with the transcription of tight-junction protein and immune-associated cytokines. These results indicate that altered ileum microbiota, intestinal barrier, and immune dysfunction are associated with D-GPV infection. Therefore, there is a relationship between the intestinal barrier dysfunction and dysbiosis caused by D-GPV, but the specific mechanism needs to be further explored.

Keywords: D-GPV; gut microbiome; immune dysfunction; intestinal barrier dysfunction.


Figures

Figure 1
Figure 1
The location and histopathological changes of D-GPV antigen in ileum. (A) Daily weight growth rate and diarrhea score after D-GPV infection in Cherry Valley ducklings. (B) Hematoxylin and eosin staining show the histological features in the D-GPV infection group (i) and control group (c) at 6 dpi and 15 dpi. The red arrows indicate necrosis and abscission of mucous epithelial cells. The black arrows indicate proliferation of lymphocytes in lamina propria. (C) After infection, the ileum crypt depth increased obviously, and the villi height and villi height and crypt depth were significantly decreased. (D) Detection of virus load in ileum. (E) Positive virus signals were detected on the surface of epithelium cells and glandular epithelial cells at 6 d after infection (dpi). Positive virus signals were mainly detected in basal and basement membrane of cells at 15 dpi. (F) Glycogen staining and statistical analysis of goblet cells in ileum (∗P < 0.05 and ∗∗P < 0.01). The black arrows indicate goblet cells. (G) Index of Immune organs.
Figure 1
Figure 1
The location and histopathological changes of D-GPV antigen in ileum. (A) Daily weight growth rate and diarrhea score after D-GPV infection in Cherry Valley ducklings. (B) Hematoxylin and eosin staining show the histological features in the D-GPV infection group (i) and control group (c) at 6 dpi and 15 dpi. The red arrows indicate necrosis and abscission of mucous epithelial cells. The black arrows indicate proliferation of lymphocytes in lamina propria. (C) After infection, the ileum crypt depth increased obviously, and the villi height and villi height and crypt depth were significantly decreased. (D) Detection of virus load in ileum. (E) Positive virus signals were detected on the surface of epithelium cells and glandular epithelial cells at 6 d after infection (dpi). Positive virus signals were mainly detected in basal and basement membrane of cells at 15 dpi. (F) Glycogen staining and statistical analysis of goblet cells in ileum (∗P < 0.05 and ∗∗P < 0.01). The black arrows indicate goblet cells. (G) Index of Immune organs.
Figure 2
Figure 2
D-GPV Infection damages intestinal tight junction and increases intestinal permeability. (A) The tight junction gene expression of ZO-1, occludin, and claudin-3 at 6 dpi and 15 dpi. (B) The plasma levels of D (-)-lactate at 6 dpi and 15 dpi. (C) The plasma levels of LPS at 6 dpi and 15 dpi. (D) The plasma levels of TNF-α at 6 dpi and 15 dpi. (E) The plasma levels of IL-6 at 6 dpi and 15 dpi. (F) The plasma levels of IL-1β at 6 dpi and 15 dpi. (G) The expression of inflammatory cytokines at 6 dpi. (H) The expression of inflammatory cytokines at 15 dpi. ∗P < 0.05, ∗∗P < 0.01, and ∗∗∗P < 0.001.
Figure 3
Figure 3
D-GPV infection decreased the diversity of ileum microflora and changed its structure. (A) Abundance and diversity of microorganisms in ileum of uninfected and D-GPV–infected ducks. Values are displayed in minimum to maximum, and the mean value of each group is calculated. ∗Statistical tests were performed using Mann-Whitney U-test, and ns indicated no significant differences. (B) The correlation between α diversity and viral load. (C) Principal coordinate analysis of unweighted UniFrac distances. Throughout the growth process, samples are colored by different groups—Orange, control-6 d; Green, D-GPV infected-6 d; Blue, control-15 d; Red, D-GPV infected-15 d. The axes are scaled according to the percentage change in the interpretation of each principal coordinate. (D) The first 20 dominant bacterial groups. (E) Dominant bacterial groups associated with viral load. (F) Cluster analysis based on unweighted UniFrac distance UPGMA. ∗∗P < 0.01 and ∗∗∗P < 0.001.
Figure 3
Figure 3
D-GPV infection decreased the diversity of ileum microflora and changed its structure. (A) Abundance and diversity of microorganisms in ileum of uninfected and D-GPV–infected ducks. Values are displayed in minimum to maximum, and the mean value of each group is calculated. ∗Statistical tests were performed using Mann-Whitney U-test, and ns indicated no significant differences. (B) The correlation between α diversity and viral load. (C) Principal coordinate analysis of unweighted UniFrac distances. Throughout the growth process, samples are colored by different groups—Orange, control-6 d; Green, D-GPV infected-6 d; Blue, control-15 d; Red, D-GPV infected-15 d. The axes are scaled according to the percentage change in the interpretation of each principal coordinate. (D) The first 20 dominant bacterial groups. (E) Dominant bacterial groups associated with viral load. (F) Cluster analysis based on unweighted UniFrac distance UPGMA. ∗∗P < 0.01 and ∗∗∗P < 0.001.
Figure 4
Figure 4
D-GPV infection alters the composition of intestinal microbiota. (A) Stacked bars represent the average relative abundance of the top 10 most abundant phyla within ileum. ‘‘Others’’ refers to bacteria that have not been identified to belong to any known phylum. The Adonis function of Vegan Community Ecology R package was used for statistical analysis, and there was no significant difference existed at the phylum level between control and D-GPV infection groups. (B) Comparison of the relative abundance of the Firmicutes, Proteobacteria, Bacteroidetes, and Actinobacteria phyla within control and D-GPV–infected ducks. Values are displayed as a fraction of the total bacteria detected within each sample. Lines represent the median value. The Mann-Whitney U-test was used for statistical analysis. (C) The average relative abundance of the first 20 families in ileum of the control group and D-GPV–infected group was indicated by the stacked bars. The mean relative abundance of the 2 groups was statistically different. ∗P < 0.05, ∗∗P < 0.01. (D) Figure of the Mann-Whitney U-test assessment showing a statistically significant difference in the relative abundance of individuals of different genera between the control group and D-GPV–infected ducks. Values are shown as a fraction of the total bacteria detected within each individual. Lines represent the median value. (E) Comparison of relative abundance of different genera in Firmicutes, Proteobacteria, and Bacteroidetes between control group and D-GPV infection group.
Figure 4
Figure 4
D-GPV infection alters the composition of intestinal microbiota. (A) Stacked bars represent the average relative abundance of the top 10 most abundant phyla within ileum. ‘‘Others’’ refers to bacteria that have not been identified to belong to any known phylum. The Adonis function of Vegan Community Ecology R package was used for statistical analysis, and there was no significant difference existed at the phylum level between control and D-GPV infection groups. (B) Comparison of the relative abundance of the Firmicutes, Proteobacteria, Bacteroidetes, and Actinobacteria phyla within control and D-GPV–infected ducks. Values are displayed as a fraction of the total bacteria detected within each sample. Lines represent the median value. The Mann-Whitney U-test was used for statistical analysis. (C) The average relative abundance of the first 20 families in ileum of the control group and D-GPV–infected group was indicated by the stacked bars. The mean relative abundance of the 2 groups was statistically different. ∗P < 0.05, ∗∗P < 0.01. (D) Figure of the Mann-Whitney U-test assessment showing a statistically significant difference in the relative abundance of individuals of different genera between the control group and D-GPV–infected ducks. Values are shown as a fraction of the total bacteria detected within each individual. Lines represent the median value. (E) Comparison of relative abundance of different genera in Firmicutes, Proteobacteria, and Bacteroidetes between control group and D-GPV infection group.
Figure 5
Figure 5
Correlation analyses between the top 29 most abundant genera, the levels of tight junction protein, cytokines expression, and plasma LPS levels. According to the Pearson correlation coefficient, tight-junction protein expression was positively (shaded in blue) and negatively (shaded in red) correlated with immune-related cytokines and plasma LPS levels in heatmap. ∗P < 0.05, ∗∗P < 0.01. Clustering was performed based on genera associations with the tight-junction protein, immune-related cytokines, and LPS. Genera are color-coded based on their respective phylum. Genera that were altered in D-GPV–infected ducks relative to uninfected ducks are underlined.
Figure 6
Figure 6
Effect of D-GPV infection on SCFA content in ileum. Significant differences at ∗P < 0.05 and ∗∗P < 0.01. SCFA, short-chain fatty acids.

References

    1. Adegunloye D.V. Microorganisms associated with poultry faeces. J. Food Agric. Environ. 2006;4:41–42.
    1. Aijaz S., Balda M.S., Matter K. Tight junctions: molecular architecture and function. Int. Rev. Cytol. 2006;248:261–298. - PubMed
    1. Applegate T.J., Karcher D.M., Lilburn M.S. Comparative development of the small intestine in the Turkey poult and Pekin duckling. Poult. Sci. 2005;84:426. - PubMed
    1. Applegate T.J., Ladwig E., Weissert L., Lilburn M.S. Effect of hen age on intestinal development and glucose tolerance of the Pekin duckling. Poult. Sci. 1999;78:1485–1492. - PubMed
    1. Artis D. Epithelial-cell recognition of commensal bacteria and maintenance of immune homeostasis in the gut. Nat. Rev. Immunol. 2008;8:411–420. - PubMed

Supplementary concepts