. 2021 Jun 10;31(7):3462-3474.
doi: 10.1093/cercor/bhab025.

Diminished Cortical Excitation and Elevated Inhibition During Perceptual Impairments in a Mouse Model of Autism

Affiliations

Diminished Cortical Excitation and Elevated Inhibition During Perceptual Impairments in a Mouse Model of Autism

Joseph Del Rosario et al. Cereb Cortex. .

Abstract

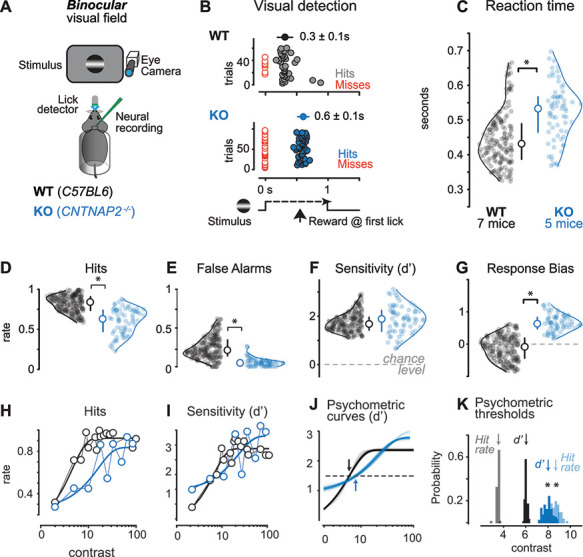
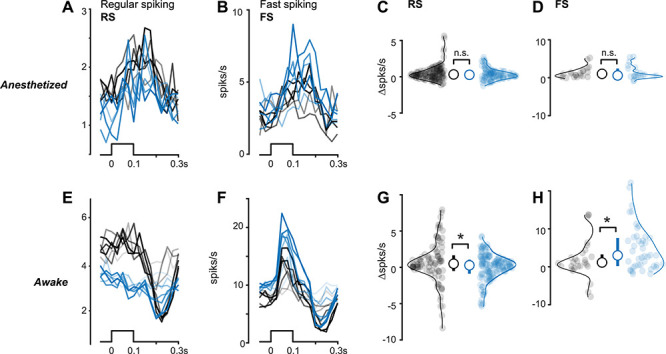
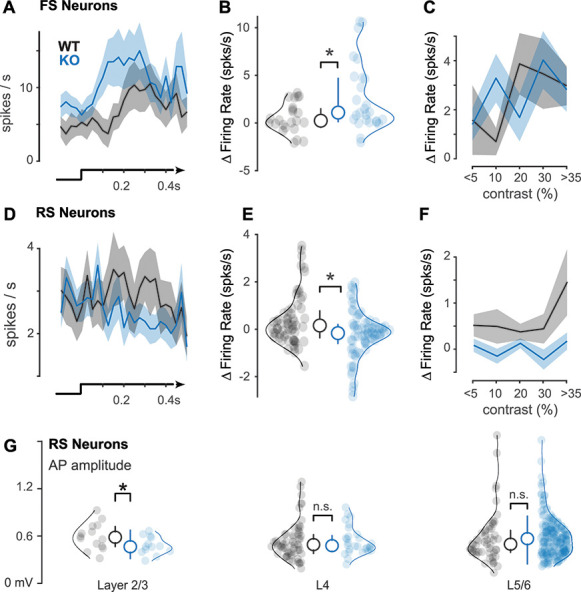
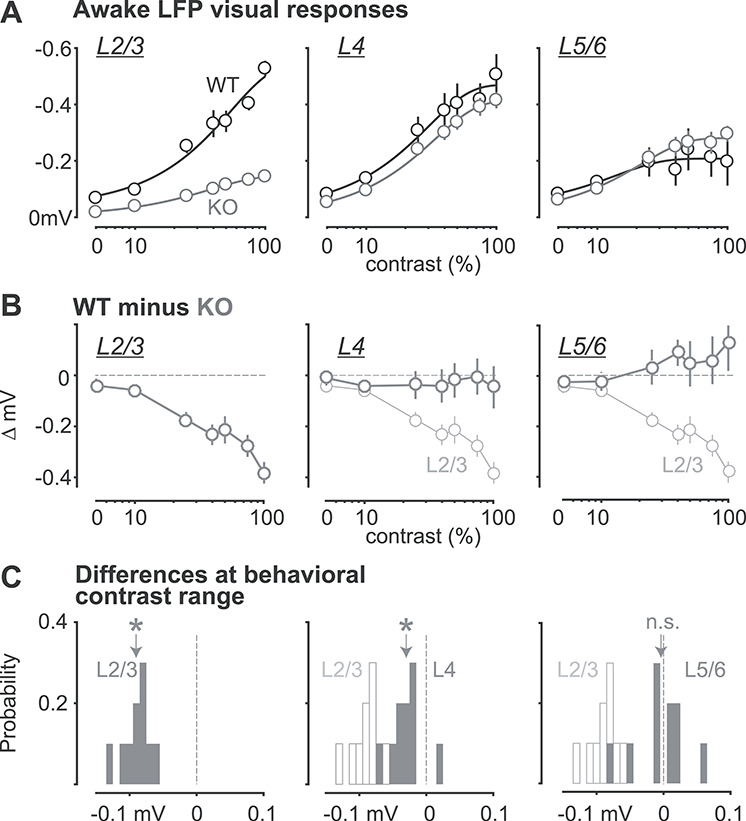
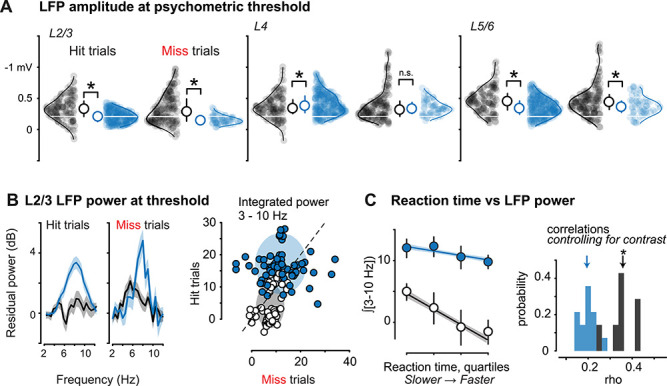
Sensory impairments are a core feature of autism spectrum disorder (ASD). These impairments affect visual perception and have been hypothesized to arise from imbalances in cortical excitatory and inhibitory activity. There is conflicting evidence for this hypothesis from several recent studies of transgenic mouse models of ASD; crucially, none have measured activity from identified excitatory and inhibitory neurons during simultaneous impairments of sensory perception. Here, we directly recorded putative excitatory and inhibitory population spiking in primary visual cortex (V1) while simultaneously measuring visual perceptual behavior in CNTNAP2-/- knockout (KO) mice. We observed quantitative impairments in the speed, accuracy, and contrast sensitivity of visual perception in KO mice. During these perceptual impairments, stimuli evoked more firing of inhibitory neurons and less firing of excitatory neurons, with reduced neural sensitivity to contrast. In addition, pervasive 3-10 Hz oscillations in superficial cortical layers 2/3 (L2/3) of KO mice degraded predictions of behavioral performance from neural activity. Our findings show that perceptual deficits relevant to ASD may be associated with elevated cortical inhibitory activity along with diminished and aberrant excitatory population activity in L2/3, a major source of feedforward projections to higher cortical regions.

Keywords: autism; excitation; inhibition; mouse; perception; visual cortex.


Figures

Figure 1
Figure 1
Visual perceptual behavior is impaired in the CNTNAP2−/− mouse model of ASD. (A) Head-fixed mice reported detection of visual stimuli in the binocular visual field by licking for water. Pupil activity, neural activity, and licking were recorded simultaneously with behavior. C57BL6J (Wildtype, WT) in black, CNTNAP2−/− (Knockout, KO) in blue throughout. (B) Example behavioral session shows detection latency (reaction time) was markedly slower for KO versus WT mice. Stimulus time course shown at bottom, with first lick times on correct trials (hits, colored circles) shown for individual consecutive trials (ordinate). Failures of detection (Misses) plotted in red. Average reaction times: WT, 0.3 ± 0.1 s; KO, 0.6 ± 0.1 s, mean ± SD reported throughout the figure. (C) KO mice detected stimuli significantly more slowly than WT mice (KO: 0.52 ± 0.08, 71 sessions, 5 mice; WT: 0.45 ± 0.08, 187 sessions, 7 mice; P < 0.01, Wilcoxon rank sum throughout the figure). Average stimulus contrast was not significantly different across KO and WT mice (WT: 23 ± 24%; KO: 23 ± 22%). Circles show reaction time average per session, smooth lines show kernel density estimates of distributions. Median ± IQR plotted inside the distributions. (D) KO mice showed significantly lower hit rates (KO: 0.6 ± 0.18; WT: 0.82 ± 0.12; P < 0.01). (E) KO mice showed significantly lower false alarm rates (KO: 0.06 ± 0.07; WT: 0.24 ± 0.15; P < 0.01). (F) Sensitivity index (d’) was not different between KO and WT mice (KO: 1.84 ± 0.71; WT: 1.74 ± 0.47; P = 0.1). (G) KO mice showed higher criterion (c), indicating increased bias to withhold from responding (WT: 0.12 ± 0.43; KO: 0.65 ± 0.29; P < 0.01). Criterion was significantly >0 for KO mice, but not for WT mice (WT: P = 0.06; KO: P < 0.01). (CG) All during same behavioral trials and same mice. (H) Hit rate as a function of contrast. Dark line is a psychometric fit (see Methods). (I) Same as H for d’. (HI) During same sessions in same mice as CG. (J) Psychometric fit reliability from data in I (see Methods). Dashed line indicates d’ threshold (1.5) and arrows indicate mean contrast values at threshold. Curves show 100 overlaid fits by resampling (see Methods). (K) Contrast thresholds for hit rate (at 50% correct) and d’ (at 1.5), both significantly elevated in KO versus WT mice (contrast at hit rate threshold: WT = 3.5 ± 0.1%, KO = 8.7 ± 0.4%, P < 0.01; contrast at d’ threshold: WT = 6.0 ± 0.1%, KO = 8.0 ± 0.4%, P < 0.01). Arrows indicate means of resampled psychometric curve threshold distributions (see Methods).
Figure 2
Figure 2
Reduced excitatory and elevated inhibitory neuron activity in KO mice depends upon brain state. (A) Regular spiking (RS) putative excitatory neuron firing to black or white bars (bottom) presented from 5 to 100% contrast during anesthesia. Stimulus contrast level indicated by line transparency. Spikes binned at 25 ms. (B) Same as A for fast spiking (FS) putative inhibitory neurons. (C) No significant difference between stimulus-evoked activity in RS neurons during anesthesia (WT: 0.51 ± 0.12 spikes/s, n = 129 neurons; mean ± SEM throughout figure; KO: 0.32 ± 0.09, n = 96 neurons, P = 0.27, one-tail Wilcoxon rank sum test throughout the figure). (D) Same as C for FS neurons (WT: 1.44 ± 0.44 spikes/s, n = 23 neurons; KO: 1.43 ± 0.45, n = 22 neurons, P = 0.49). Median ± IQR plotted inside distributions. (E) Same as A, during wakefulness. (F) Same as B, during wakefulness. (G) Same as C, during wakefulness. RS neuron responses are significantly reduced in KO mice during wakefulness (WT: 0.49 ± 0.37, n = 95 neurons; KO: 0.03 ± 0.25, n = 131 neurons, P < 0.05). (H) Same as D, during wakefulness. FS neuron responses are significantly elevated in KO mice during wakefulness (WT: 1.90 ± 1.19, n = 29 neurons; KO: 5.10 ± 1.04, n = 45 neurons, P < 0.05).
Figure 3
Figure 3
Enhanced FS and diminished RS visual responses at discrimination threshold. (A) Peristimulus time histograms of FS neurons during perceptual detection of visual stimuli (bottom) at contrasts defined by the discrimination threshold (~5% for WT mice, ~10% for KO mice, Fig. 1I–K). (B) KO mice have enhanced FS responses to visual stimuli during perceptual detection (WT: 1.58 ± 1.27 spikes/s, n = 20 neurons, mean ± SEM throughout figure; KO: 3.29 ± 1.15, n = 38 neurons, P < 0.05, one-tail Wilcoxon rank sum test; Δfiring rate calculated as difference from prestimulus baseline, see Methods) (C) FS neuron responses as a function of contrast (binned; see Methods). (D) Same as A, for RS neurons. (E) Same as B, for RS neurons. KO mice have diminished RS responses during perceptual detection (WT: 0.52 ± 0.21 spikes/s, n = 49 neurons; KO: −0.15 ± 0.18, n = 103 neurons, P < 0.01, one-tail Wilcoxon rank sum test). (F) Same as C, for RS neurons. (G) Action potential (AP) amplitudes significantly smaller in L2/3 RS neurons in KO mice (0.48 ± 0.03 mV; mean ± SEM, n = 13; 0.59 ± 0.04 mV, n = 14; P < 0.05, one-tail Wilcoxon rank sum test). No differences in L4 (KO: 0.54 ± 0.03; n = 28; WT: 0.54 ± 0.03, n = 59; P = 0.35) or L5/6 (KO: 0.59 ± 0.02; n = 178; WT: 0.58 ± 0.04, n = 53; P = 0.12). Neurons aggregated across awake recordings. Median ± IQR plotted inside distributions throughout figure.
Figure 4
Figure 4
Strong reduction of LFP responses in L2/3 of KO mice. (A) Contrast dependence of awake LFP responses, split by layers (L2/3, L4, L5/6; left to right). Ordinate reversed for visualization (greater negativity indicates stronger LFP response). Dark lines are Weibull fits (see Methods). (B) Difference between WT and KO LFP contrast responses. L2/3 (left, gray) has the greatest reduction in stimulus-evoked LFP compared with L4 (middle), and L5/6 (right). L2/3: −0.19 formula image 0.014 mV, mean ± SEM, P < 0.01; L4: −0.029 ± 0.007 mV, P = 0.23; L5/6: 0.046 formula image 0.011 mV, P < 0.01, repeated measurements ANOVA followed by multiple comparisons, significant effect of layer. (C) Probability distributions of LFP amplitude differences at contrasts matching behavioral range (2–35%; see Methods). L2/3 responses (left) in KO mice significantly reduced (−0.09 ± 0.002 mV, P < 0.01, signed rank). L4 responses slightly but significantly reduced (−0.03 ± 0.003 mV, P < 0.05). L5/6 not different (−0.004 ± 0.004 mV, P = 0.77), distributions. Open histograms replot L2/3 distribution for comparison to L4 and L5/6. Arrows indicate means.
Figure 5
Figure 5
Aberrant neural activity in L2/3 correlates with perceptual impairments in KO mice. (A) L2/3 stimulus-evoked LFP amplitudes at discrimination threshold (see Fig. 1J–K) are reduced on both correct and incorrect trials (WT Hits: −0.33 ± 0.017 mV, mean ± SEM throughout figure, n = 533 trials, seven recordings in three mice; KO Hits: −0.21 ± 0.007 mV, n = 1402 trials, 15 recordings in 3 mice, P < 0.01, Wilcoxon rank sum; WT Misses: −0.33 ± 0.020 mV, n = 211 trials; KO Misses = −0.16 ± 0.009 mV, n = 423 trials, P < 0.01). Ordinate reversed for visualization (greater negativity indicates stronger LFP response). Middle, L4 responses on Hit (WT: −0.36 ± 0.017 mV; KO = −0.41 ± 0.011, P < 0.05) and Miss trials (WT: −0.38 ± 0.020 mV; KO: −0.35 ± 0.016 mV, P = 0.52). Right, L5/6 responses on Hit (WT: −0.46 ± 0.018 mV, KO = −0.36 ± 0.010 mV, P < 0.01) and Miss trials (WT: −0.48 ± 0.021.0, KO = −0.38 ± 0.021, P < 0.05). L4 and L5/6 responses during detection are not reduced to the same magnitude as L2/3 in KO mice (L2/3 median in KO mice indicated by white horizontal line). (B) Left, significantly elevated low-frequency (3–10 Hz) LFP power in L2/3 of KO versus WT mice on both Hit trials (KO: 13.27 ± 1.55; WT: 2.45 ± 1.78; P < 0.01) and Miss trials (KO: 11.98 ± 2.51; WT: 7.03 ± 1.57; P < 0.05). Mean ± SEM of integrated power 3–10 Hz at psychometric threshold. See Methods for residual power calculation. Right, integrated 3–10 Hz residual power was greater on Misses versus Hits in WT mice (Hits: 4.01 ± 0.69; Misses: 7.56 ± 0.48, P < 0.01, sign rank), but not in KO mice (Hits: 17.22 ± 0.76; Misses: 11.95 ± 0.93, P < 0.01, sign rank). Shaded regions show 2D Gaussian fit (±1σ). Power calculated per channel recorded in L2/3 (WT: n = 58, KO: 68). (C) Left: low-frequency LFP power was significantly and negatively correlated with reaction time in WT mice (linear regression model: 48 ± 12% variance explained within mouse, P < 0.05, r2 = 0.35; P < 0.05), but not in KO mice (31 ± 8% within mouse, P = 0.22, r2 = 0.19; P = 0.08). Single trial reaction times (Hit trials) were binned into quartiles, and single trial integrated 3–10 Hz LFP power was averaged within quartile for all WT and KO trials (mean ± SEM). Shaded regions are bootstrap error of fits (see Methods). Right: correlations between low frequency LFP power and reaction time are not explained by contrast. Partial correlations between the L2/3 power and reaction time, accounting for contrast, were significant and greater in WT mice than in KO mice (WT: 0.36 ± 0.06, P < 0.01; KO: 0.19 ± 0.04, P = 0.08; see Methods).

Similar articles

Cited by

References

    1. Amarante LM, Laubach M. 2020. Rhythmic activity in the medial and orbital frontal cortices tracks reward value and the vigor of consummatory behavior. bioRxiv, 2020.09.22.308809. doi: 10.1101/2020.2009.2022.308809. - DOI - PMC - PubMed
    1. American Psychiatric Association. D-TF . 2013. Diagnostic and statistical manual of mental disorders : DSM-5. 5th ed. Washington (DC): American Psychiatric Association.
    1. Antoine MW, Langberg T, Schnepel P, Feldman DE. 2019. Increased excitation-inhibition ratio stabilizes synapse and circuit excitability in four autism mouse models. Neuron. 101:648–661.e644. - PMC - PubMed
    1. Banerjee A, Rikhye RV, Breton-Provencher V, Tang X, Li C, Li K, Runyan CA, Fu Z, Jaenisch R, Sur M. 2016. Jointly reduced inhibition and excitation underlies circuit-wide changes in cortical processing in Rett syndrome. Proc Natl Acad Sci U S A. 113:E7287–E7296. - PMC - PubMed
    1. Berditchevskaia A, Caze RD, Schultz SR. 2016. Performance in a GO/NOGO perceptual task reflects a balance between impulsive and instrumental components of behaviour. Sci Rep. 6:27389. - PMC - PubMed

Publication types