. 2021 Mar 17;13(3):61-72.
doi: 10.1093/intbio/zyab002.

Oxygenation as a driving factor in epithelial differentiation at the air-liquid interface

Affiliations

Oxygenation as a driving factor in epithelial differentiation at the air-liquid interface

Sonya Kouthouridis et al. Integr Biol (Camb). .

Abstract

Culture at the air-liquid interface is broadly accepted as necessary for differentiation of cultured epithelial cells towards an in vivo-like phenotype. However, air-liquid interface cultures are expensive, laborious and challenging to scale for increased throughput applications. Deconstructing the microenvironmental parameters that drive these differentiation processes could circumvent these limitations, and here we hypothesize that reduced oxygenation due to diffusion limitations in liquid media limits differentiation in submerged cultures; and that this phenotype can be rescued by recreating normoxic conditions at the epithelial monolayer, even under submerged conditions. Guided by computational models, hyperoxygenation of atmospheric conditions was applied to manipulate oxygenation at the monolayer surface. The impact of this rescue condition was confirmed by assessing protein expression of hypoxia-sensitive markers. Differentiation of primary human bronchial epithelial cells isolated from healthy patients was then assessed in air-liquid interface, submerged and hyperoxygenated submerged culture conditions. Markers of differentiation, including epithelial layer thickness, tight junction formation, ciliated surface area and functional capacity for mucociliary clearance, were assessed and found to improve significantly in hyperoxygenated submerged cultures, beyond standard air-liquid interface or submerged culture conditions. These results demonstrate that an air-liquid interface is not necessary to produce highly differentiated epithelial structures, and that increased availability of oxygen and nutrient media can be leveraged as important strategies to improve epithelial differentiation for applications in respiratory toxicology and therapeutic development.

Keywords: air–liquid interface; epithelium; microenvironment; oxygenation.


Figures

Figure 1
Figure 1
Schematic of bronchial epithelial cells cultured in the apical compartment of a porous, polyester Transwell® filter insert in three different experimental culture conditions. Both standard/ALI and hyperoxic/submerged cultured provide the cell monolayer with normoxic levels of oxygen, whereas the standard/submerged conditions produce a hypoxic environment for cells.
Figure 2
Figure 2
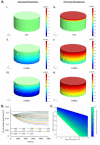
Finite element simulation of oxygen diffusion in liquid media layer. (A) Surface area plot of oxygen diffusion through apical liquid media layer during (i–iii) standard/submerged and (iv–vi) hyperoxic/submerged cultures at t = 0 s , t = 1000 s and t = 5000 s. Media layer is initially in equilibrium with 21% ambient oxygen conditions with a constant oxygen consumption rate by the cells. Green region represents normoxic conditions (0.21 mol O2/m3), red region represents hyperoxic conditions and blue represents hypoxic conditions. At equilibrium (t > 5000 s), cells in standard/submerged conditions experience hypoxic conditions; cells in hyperoxic/submerged experience normoxic conditions. (B) Dissolved oxygen at the cellular layer (mol/m3) as a function of time for different incubator oxygen concentrations. Black dotted line represents normoxic conditions of 0.21 mol O2/m3. (C) Multiparametric analysis of oxygen kinetics in submerged culture to identify optimal parameters for normoxic culture conditions. Various combination of cellular oxygen consumption rate, apical media height and dissolved oxygen at the air–liquid interface allow for normoxic oxygen concentrations at the cell layer. For example, if we assume cellular oxygen consumption rate is 7.4 × 10⁻¹² mol O2/(s-cm2) and the height of the media layer above the cells is 3 mm, then we would have to set the incubator oxygen concentration to a value that would allow for the upper media surface to be equal to 0.3 mol O2/m3. Using Henry’s law, we can determine that an incubator oxygen concentration of 30% O2 would allow for a dissolved oxygen concentration of 0.3 mol O2/m3 at the upper air-liquid surface, and thus normoxic oxygenation at the epithelial monolayer surface.
Figure 3
Figure 3
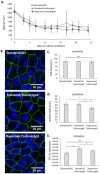
HBEC intercellular junctions and cell morphology in standard/ALI, standard/submerged and hyperoxic/submerged culture conditions. (A) TEER measurements of HBECs throughout the entire 25-day culture (n = 3 donors). Epithelial barrier integrity follows similar trends when HBECs were cultured in all three conditions. (B) ZO-1 tight junction stain (green) and nuclear stain (blue) of BD00843 cells after 25 days in culture. (C–E) Morphological and immunostaining analysis for representative BD00954 donor cells after 25 days in culture. N = 3 data points presented as mean ± SD, with *P < 0.05 by one-way ANOVA with Holm-Sidak post hoc pairwise comparisons. (C) Average cell area showed no significant difference between cell area in all three conditions indicating that cells formed equally dense epithelial layers. (D) Average nuclear area in hyperoxic/submerged conditions was statistically lower than cells cultured in standard/ALI and standard/submerged conditions. (E) Mean gray value of HIF-1α stain within the nuclei showed higher levels of hypoxia in standard/submerged conditions than in standard/ALI and hyperoxic/submerged, demonstrating that increased incubator oxygen concentration compensates for diffusion limitations in submerged cultures.
Figure 4
Figure 4
HBEC thickness analysis after 25 days in culture. (A) H&E stained cross-sectional histology slices after culture in standard/ALI and hyperoxic/submerged conditions. (B) Epithelium layer thickness from histology cross-sectional slices for three donor patient cells after 25 days in culture (n = 3, mean ± SD, one-way ANOVA with Tukey’s post hoc pairwise comparison, **P < 0.001). Hyperoxic/submerged conditions produced thicker epithelial cell layers universally across all donors, whereas the other two conditions produced results that varied between donors.
Figure 5
Figure 5
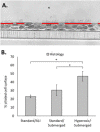
HBEC histology-based ciliation analysis after culture for 25 days. (A) Representative histological cross section of BD00843 patient cells cultured in hyperoxic/submerged conditions. The red lines represent the ciliated surface area length measured and used to quantify ciliated area. (B) Percent ciliated surface of BD00843 donor cells cultured in three conditions and measured from cross-sectional histology slices (n = 3, mean ± SD, *P < 0.05 by one-way ANOVA with Holm-Sidak post hoc pairwise comparison). Cells cultured in hyperoxic/submerged conditions produced the highest ciliation rates.
Figure 6
Figure 6
Video-based functional ciliation analysis. (A) Percent ciliated surface area of donor HBECs after 18 days (n = 3, mean ± SD, *P < 0.05 by one-way ANOVA with Tukey’s post hoc pairwise comparison, P = 0.013 between hyperoxic/submerged and standard/ALI), measured using video microscopy. (B) Percent ciliated surface of representative BD00843 donor cells cultured for 18 and 25 days (n = 3, mean ± SD, *P < 0.05 by two-way ANOVA with Holm-Sidak post hoc pairwise comparison), measured using live stream image capture and processing. (C) Average displacement speed of beads settled on ciliated surface of cells in standard/ALI, standard/submerged and hyperoxic/submerged conditions (n = 3, mean ± SD, *P < 0.05 by one-way ANOVA with Holm-Sidak post hoc pairwise comparison). Hyperoxic/submerged conditions resulted in the highest bead displacement speed. (D–G) Representative time lapse of fluorescently labeled beads on ciliated surfaces for cultures at standard/ALI conditions at t = 0 s, t = 20 ms, t = 40 ms and t = 60 ms. White dashed outlines represent the initial positions of each fluorescent bead.

References

    1. Yaghi A, Zaman A, Dolovich M. Primary human bronchial epithelial cells grown from explants. J Vis Exp 2010;1789:1–8. doi: 10.3791/1789. - DOI - PMC - PubMed
    1. Jiang D, Schaefer N, Chu HW. In: Alper S, Janssen WJ (eds.). Air-liquid interface culture of human and mouse airway epithelial cells. Lung Innate Immunity and Inflammation: Methods and Protocols. New York, Springer, 2018, 91–109. - PubMed
    1. Sears PR, Yin W-N, Ostrowski LE. Continuous mucociliary transport by primary human airway epithelial cells in vitro. Am J Phys Lung Cell Mol Phys 2015;309:L99–L108. doi: 10.1152/ajplung.00024.2015. - DOI - PMC - PubMed
    1. Bustamante-Marin XM, Ostrowski LE. Cilia and mucociliary clearance. Cold Spring Harb Perspect Biol 2017;9:a028241. doi: 10.1101/cshperspect.a028241. - DOI - PMC - PubMed
    1. de Jong PM, van Sterkenburg MA, Hesseling SC et al. Ciliogenesis in human bronchial epithelial cells cultured at the air-liquid interface. Am J Respir Cell Mol Biol 1994;10:271–7. doi: 10.1165/ajrcmb.10.3.8117445. - DOI - PubMed

Publication types

LinkOut - more resources