

Regulation of endoplasmic reticulum stress and trophectoderm lineage specification by the mevalonate pathway in the mouse preimplantation embryo
- PMID: 33677573
- PMCID: PMC7990410
- DOI: 10.1093/molehr/gaab015
Regulation of endoplasmic reticulum stress and trophectoderm lineage specification by the mevalonate pathway in the mouse preimplantation embryo
Abstract
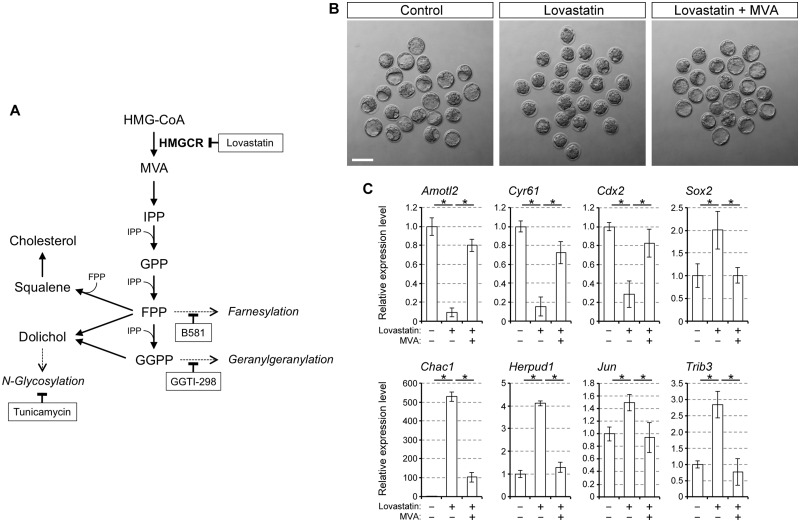
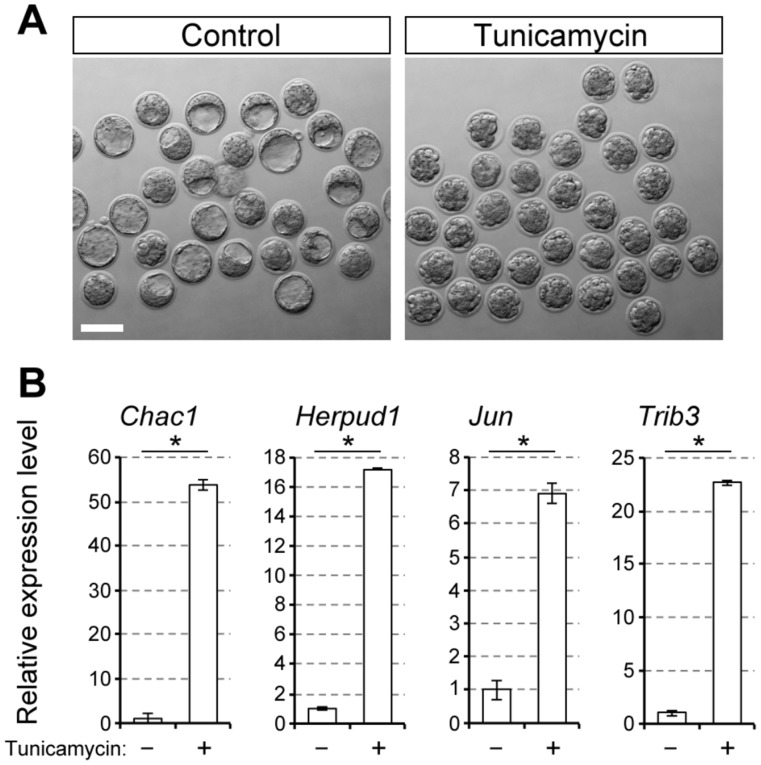
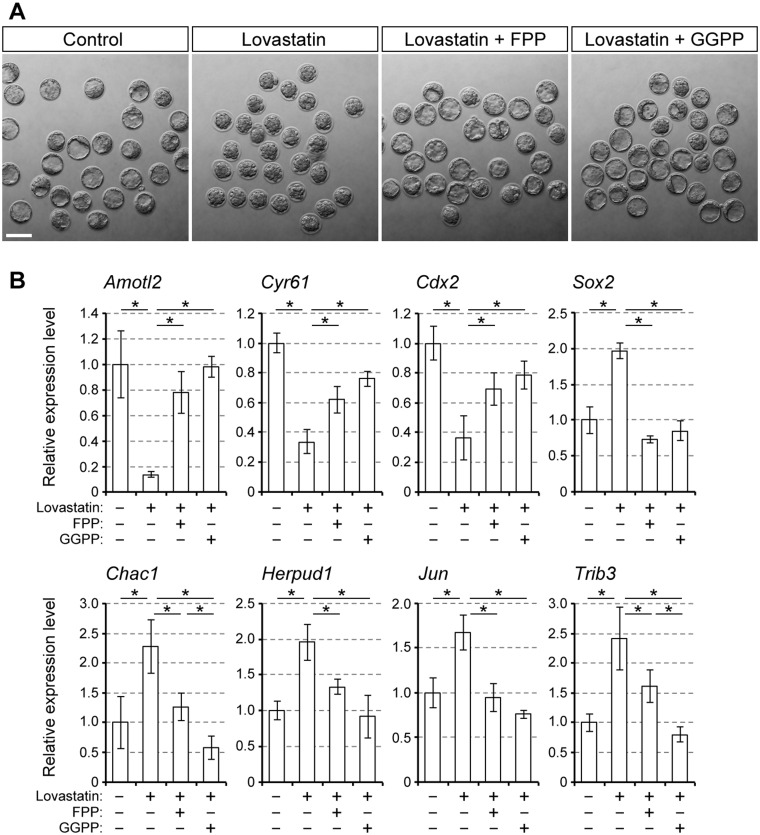
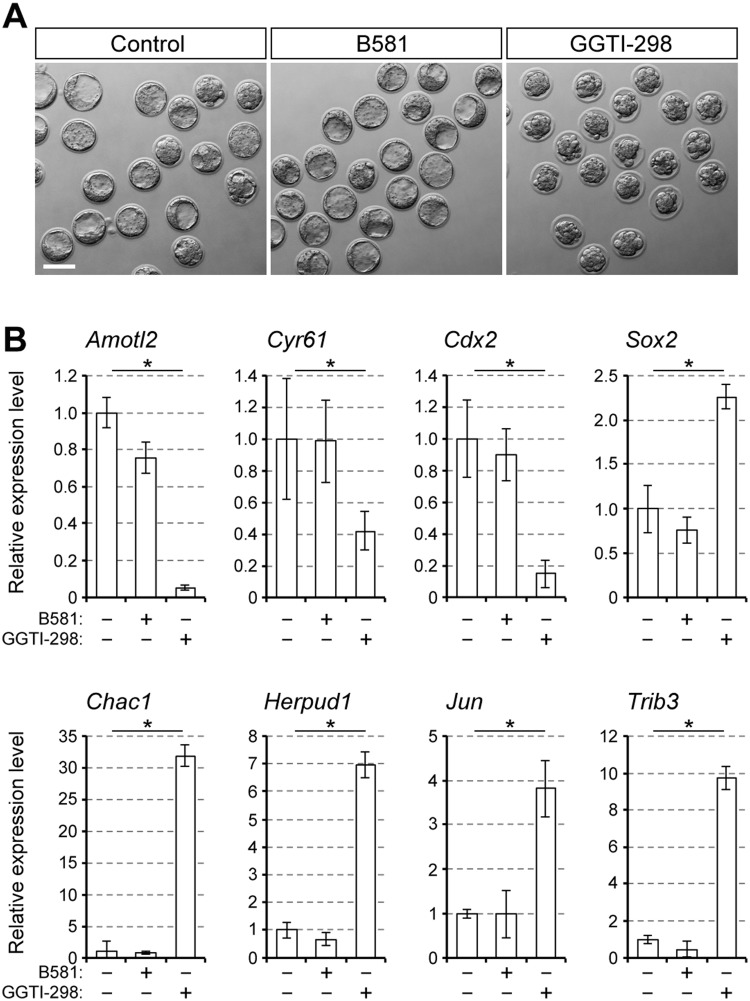
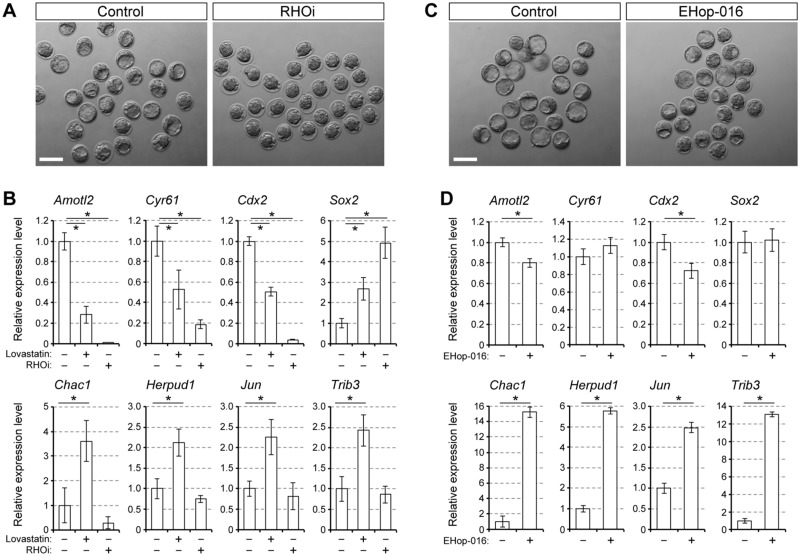
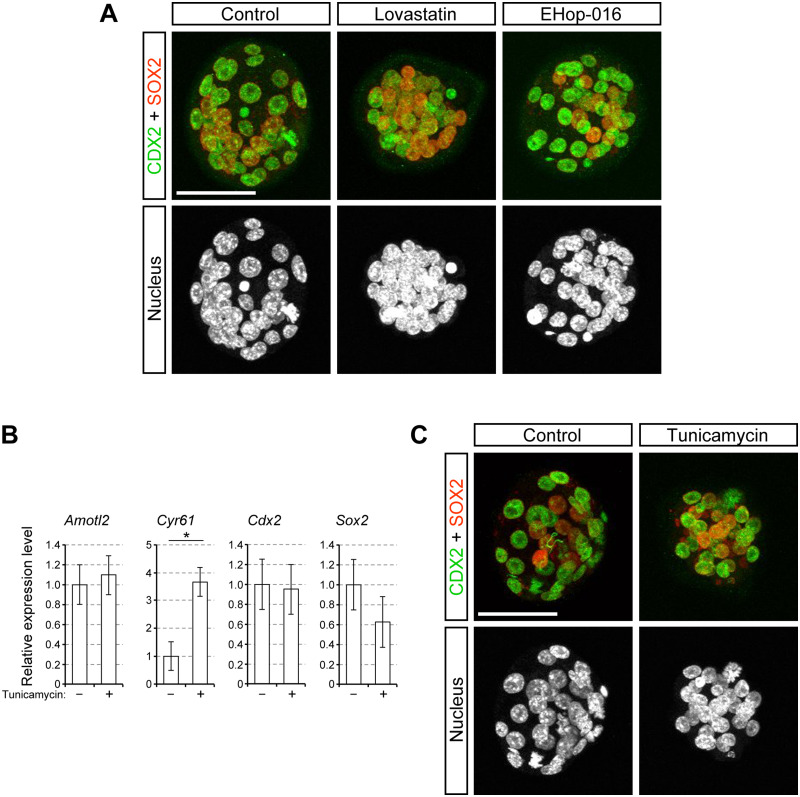
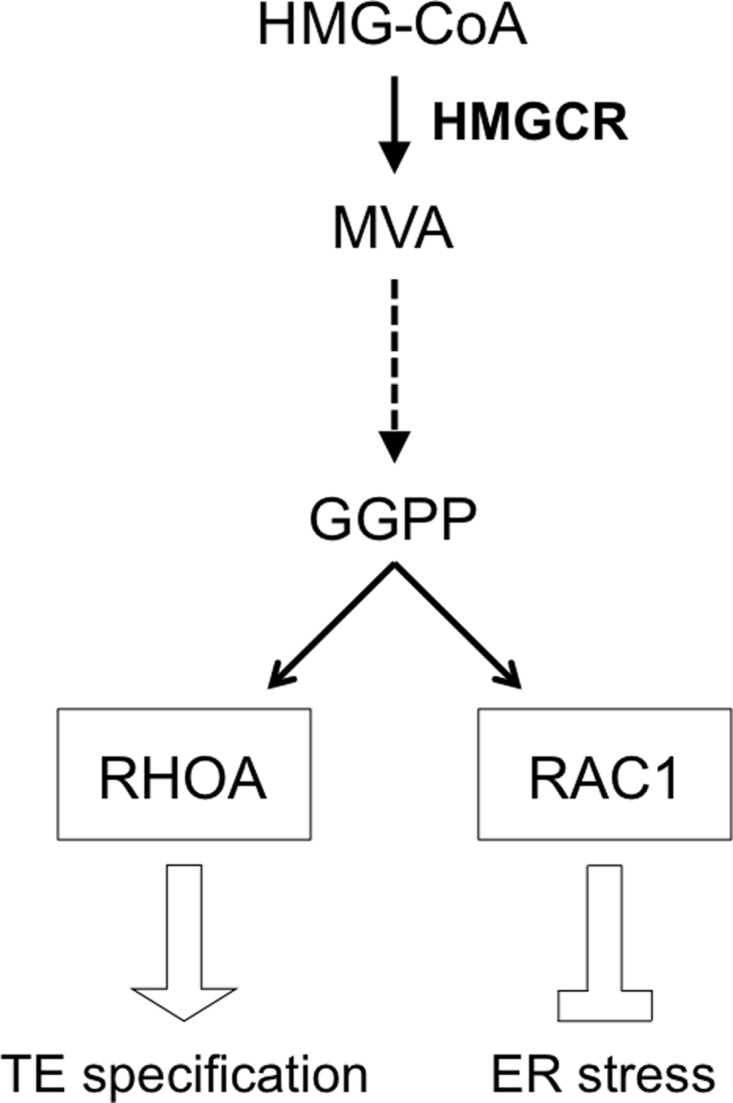
Early embryos are vulnerable to environmental insults, such as medications taken by the mother. Due to increasing prevalence of hypercholesterolemia, more women of childbearing potential are taking cholesterol-lowering medications called statins. Previously, we showed that inhibition of the mevalonate pathway by statins impaired mouse preimplantation development, by modulating HIPPO signaling, a key regulator for trophectoderm (TE) lineage specification. Here, we further evaluated molecular events that are altered by mevalonate pathway inhibition during the timeframe of morphogenesis and cell lineage specification. Whole transcriptome analysis revealed that statin treatment dysregulated gene expression underlying multiple processes, including cholesterol biosynthesis, HIPPO signaling, cell lineage specification and endoplasmic reticulum (ER) stress response. We explored mechanisms that link the mevalonate pathway to ER stress, because of its potential impact on embryonic health and development. Upregulation of ER stress-responsive genes was inhibited when statin-treated embryos were supplemented with the mevalonate pathway product, geranylgeranyl pyrophosphate (GGPP). Inhibition of geranylgeranylation was sufficient to upregulate ER stress-responsive genes. However, ER stress-responsive genes were not upregulated by inhibition of ras homolog family member A (RHOA), a geranylgeranylation target, although it interfered with TE specification and blastocyst cavity formation. In contrast, inhibition of Rac family small GTPase 1 (RAC1), another geranylgeranylation target, upregulated ER stress-responsive genes, while it did not impair TE specification or cavity formation. Thus, our study suggests that the mevalonate pathway regulates cellular homeostasis (ER stress repression) and differentiation (TE lineage specification) in preimplantation embryos through GGPP-dependent activation of two distinct small GTPases, RAC1 and RHOA, respectively. Translation of the findings to human embryos and clinical settings requires further investigations.
Keywords: blastocyst; cell lineage; geranylgeranylation; hypercholesterolemia; unfolded protein response.
© The Author(s) 2021. Published by Oxford University Press on behalf of European Society of Human Reproduction and Embryology. All rights reserved. For permissions, please email: journals.permissions@oup.com.
Figures
Similar articles
-
Statins inhibit blastocyst formation by preventing geranylgeranylation.Mol Hum Reprod. 2016 May;22(5):350-63. doi: 10.1093/molehr/gaw011. Epub 2016 Feb 7. Mol Hum Reprod. 2016. PMID: 26908642 Free PMC article.
-
RHOA activity in expanding blastocysts is essential to regulate HIPPO-YAP signaling and to maintain the trophectoderm-specific gene expression program in a ROCK/actin filament-independent manner.Mol Hum Reprod. 2019 Feb 1;25(2):43-60. doi: 10.1093/molehr/gay048. Mol Hum Reprod. 2019. PMID: 30395288 Free PMC article.
-
Regulation of trophectoderm morphogenesis by small GTPase RHOA through HIPPO signaling-dependent and -independent mechanisms in mouse preimplantation development.Differentiation. 2025 Jan-Feb;141:100835. doi: 10.1016/j.diff.2025.100835. Epub 2025 Jan 3. Differentiation. 2025. PMID: 39874642
-
Emerging Role of the Hippo Signaling Pathway in Position Sensing and Lineage Specification in Mammalian Preimplantation Embryos.Biol Reprod. 2015 Jun;92(6):143. doi: 10.1095/biolreprod.114.127803. Epub 2015 May 6. Biol Reprod. 2015. PMID: 25947059 Review.
-
A tale of two cell-fates: role of the Hippo signaling pathway and transcription factors in early lineage formation in mouse preimplantation embryos.Mol Hum Reprod. 2020 Sep 1;26(9):653-664. doi: 10.1093/molehr/gaaa052. Mol Hum Reprod. 2020. PMID: 32647873 Free PMC article. Review.
Cited by
-
An active metabolite of the anti-COVID-19 drug molnupiravir impairs mouse preimplantation embryos at clinically relevant concentrations.Reprod Toxicol. 2023 Oct;121:108475. doi: 10.1016/j.reprotox.2023.108475. Epub 2023 Sep 23. Reprod Toxicol. 2023. PMID: 37748715 Free PMC article.
-
Mevalonate metabolites boost aged oocyte quality through prenylation of small GTPases.Nat Aging. 2025 Aug 26. doi: 10.1038/s43587-025-00946-7. Online ahead of print. Nat Aging. 2025. PMID: 40858817
-
Trophectoderm formation: regulation of morphogenesis and gene expressions by RHO, ROCK, cell polarity, and HIPPO signaling.Reproduction. 2022 Aug 22;164(4):R75-R86. doi: 10.1530/REP-21-0478. Print 2022 Oct 1. Reproduction. 2022. PMID: 35900353 Free PMC article. Review.
-
Follicular metabolic dysfunction, oocyte aneuploidy and ovarian aging: a review.J Ovarian Res. 2025 Mar 12;18(1):53. doi: 10.1186/s13048-025-01633-2. J Ovarian Res. 2025. PMID: 40075456 Free PMC article. Review.
-
Granulosa cell mevalonate pathway abnormalities contribute to oocyte meiotic defects and aneuploidy.Nat Aging. 2023 Jun;3(6):670-687. doi: 10.1038/s43587-023-00419-9. Epub 2023 May 15. Nat Aging. 2023. PMID: 37188792
References
-
- Alarcón VB, Marikawa Y.. Deviation of the blastocyst axis from the first cleavage plane does not affect the quality of mouse postimplantation development. Biol Reprod 2003;69:1208–1212. - PubMed
-
- Arnett DK, Jacobs DR Jr, Luepker RV, Blackburn H, Armstrong C, Claas SA.. Twenty-year trends in serum cholesterol, hypercholesterolemia, and cholesterol medication use: the Minnesota Heart Survey, 1980-1982 to 2000-2002. Circulation 2005;112:3884–3891. - PubMed
-
- Buhaescu I, Izzedine H.. Mevalonate pathway: a review of clinical and therapeutical implications. Clin Biochem 2007;40:575–584. - PubMed
Publication types
MeSH terms
Substances
Grants and funding
LinkOut - more resources
Full Text Sources
Other Literature Sources
Research Materials
Miscellaneous
