

Impact of seasonality and malaria control interventions on Anopheles density and species composition from three areas of Uganda with differing malaria endemicity
- PMID: 33678166
- PMCID: PMC7938603
- DOI: 10.1186/s12936-021-03675-5
Impact of seasonality and malaria control interventions on Anopheles density and species composition from three areas of Uganda with differing malaria endemicity
Abstract
Background: Long-lasting insecticidal nets (LLINs) and indoor residual spraying (IRS) are the malaria control interventions primarily responsible for reductions in transmission intensity across sub-Saharan Africa. These interventions, however, may have differential impact on Anopheles species composition and density. This study examined the changing pattern of Anopheles species in three areas of Uganda with markedly different transmission intensities and different levels of vector control.
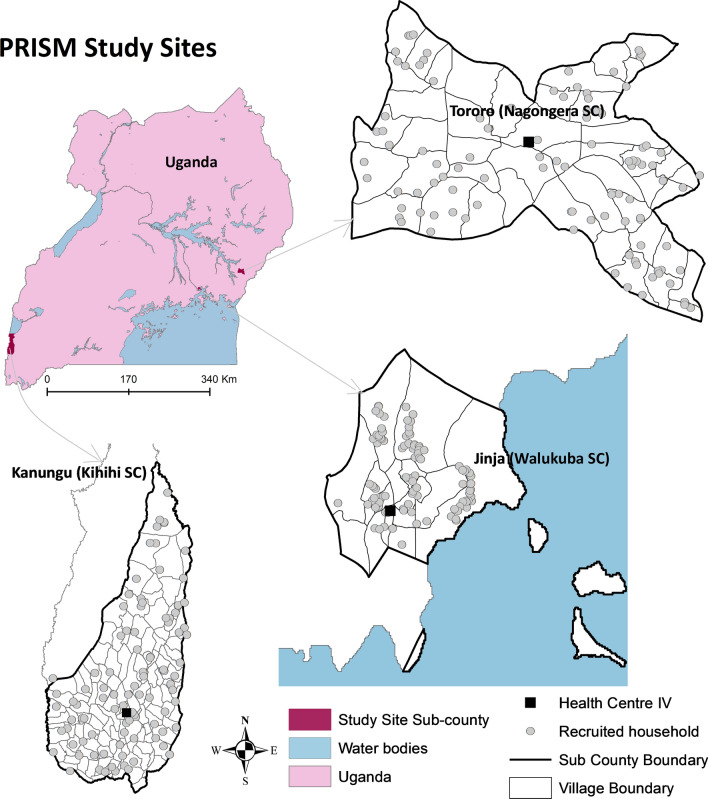
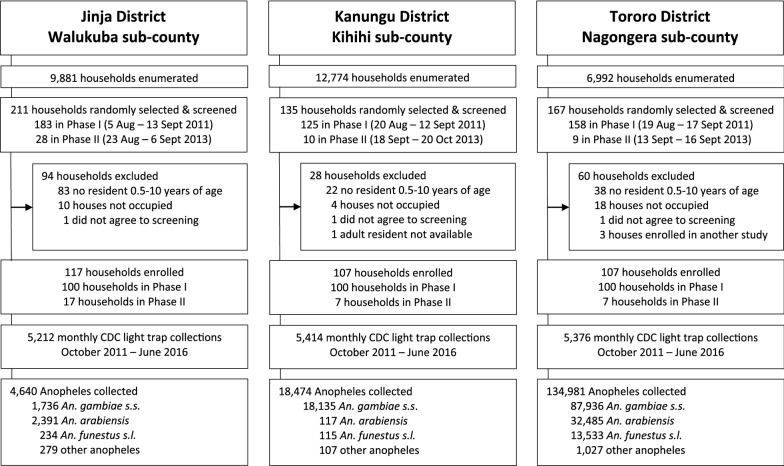
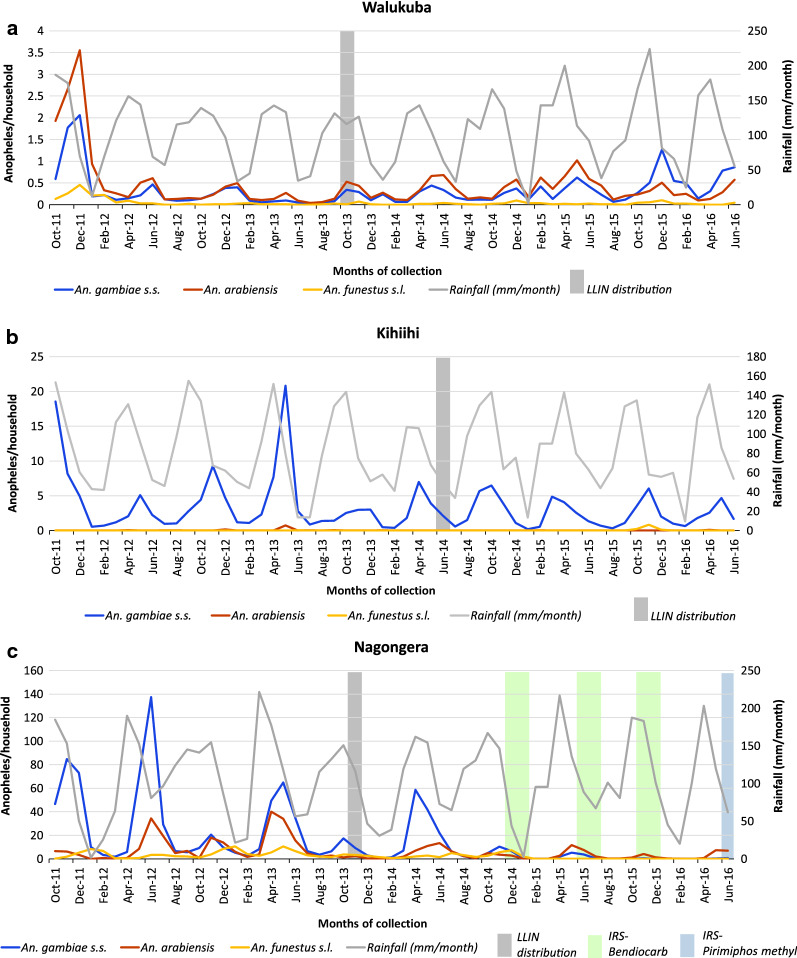
Methods: From October 2011 to June 2016 mosquitoes were collected monthly using CDC light traps from 100 randomly selected households in three areas: Walukuba (low transmission), Kihihi (moderate transmission) and Nagongera (high transmission). LLINs were distributed in November 2013 in Walukuba and Nagongera and in June 2014 in Kihihi. IRS was implemented only in Nagongera, with three rounds of bendiocarb delivered between December 2014 and June 2015. Mosquito species were identified morphologically and by PCR (Polymerase Chain Reaction).
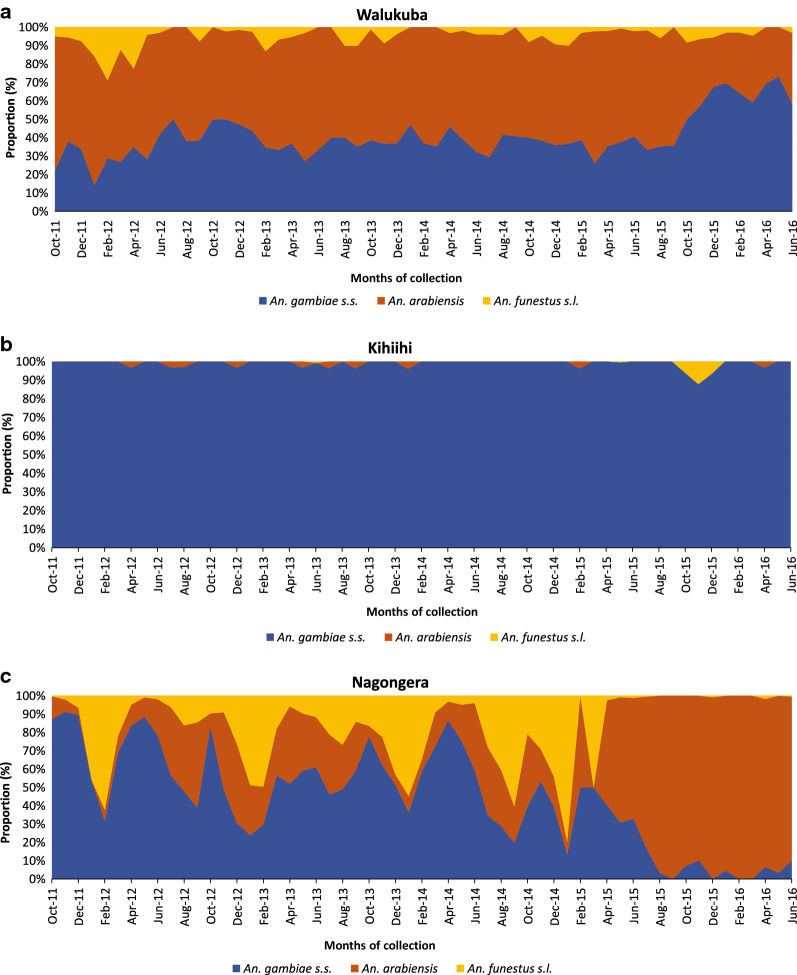
Results: In Walukuba, LLIN distribution was associated with a decline in Anopheles funestus vector density (0.07 vs 0.02 mosquitoes per house per night, density ratio [DR] 0.34, 95% CI: 0.18-0.65, p = 0.001), but not Anopheles gambiae sensu stricto (s.s.) nor Anopheles arabiensis. In Kihihi, over 98% of mosquitoes were An. gambiae s.s. and LLIN distribution was associated with a decline in An. gambiae s.s. vector density (4.00 vs 2.46, DR 0.68, 95% CI: 0.49-0.94, p = 0.02). In Nagongera, the combination of LLINs and multiple rounds of IRS was associated with almost complete elimination of An. gambiae s.s. (28.0 vs 0.17, DR 0.004, 95% CI: 0.002-0.009, p < 0.001), and An. funestus sensu lato (s.l.) (3.90 vs 0.006, DR 0.001, 95% CI: 0.0005-0.004, p < 0.001), with a less pronounced decline in An. arabiensis (9.18 vs 2.00, DR 0.15 95% CI: 0.07-0.33, p < 0.001).
Conclusions: LLIN distribution was associated with reductions in An. funestus s.l. in the lowest transmission site and An. gambiae s.s. in the moderate transmission site. In the highest transmission site, a combination of LLINs and multiple rounds of IRS was associated with the near collapse of An. gambiae s.s. and An. funestus s.l. Following IRS, An. arabiensis, a behaviourally resilient vector, became the predominant species, which may have implications for malaria vector control activities. Development of interventions targeted at outdoor biting remains a priority.
Keywords: Anopheles density; Interventions; Malaria control; Seasonality; Species composition.
Conflict of interest statement
The authors declare that they have no competing interests.
Figures
References
-
- WHO. World Malaria Report 2019. Geneva, World Health Organization, 2019.
-
- Uganda Bureau of Statistics, NMCP, ICF International. Uganda Malaria Indicator Survey . Rockville. USA: Kampala, Uganda; 2009. p. 2010.
-
- Uganda Bureau of Statistics, NMCP, ICF International. Uganda Malaria Indicator Survey 2014–2015. Rockville, USA, Kampala, Uganda, 2015.
MeSH terms
Grants and funding
LinkOut - more resources
Full Text Sources
Other Literature Sources
Medical
