. 2021 Mar 7;13(1):58.
doi: 10.1186/s13195-021-00793-9.

Development of a novel, sensitive translational immunoassay to detect plasma glial fibrillary acidic protein (GFAP) after murine traumatic brain injury

Affiliations

Development of a novel, sensitive translational immunoassay to detect plasma glial fibrillary acidic protein (GFAP) after murine traumatic brain injury

Emily B Button et al. Alzheimers Res Ther. .

Abstract

Background: Glial fibrillary acidic protein (GFAP) has emerged as a promising fluid biomarker for several neurological indications including traumatic brain injury (TBI), a leading cause of death and disability worldwide. In humans, serum or plasma GFAP levels can predict brain abnormalities including hemorrhage on computed tomography (CT) scans and magnetic resonance imaging (MRI). However, assays to quantify plasma or serum GFAP in preclinical models are not yet available.

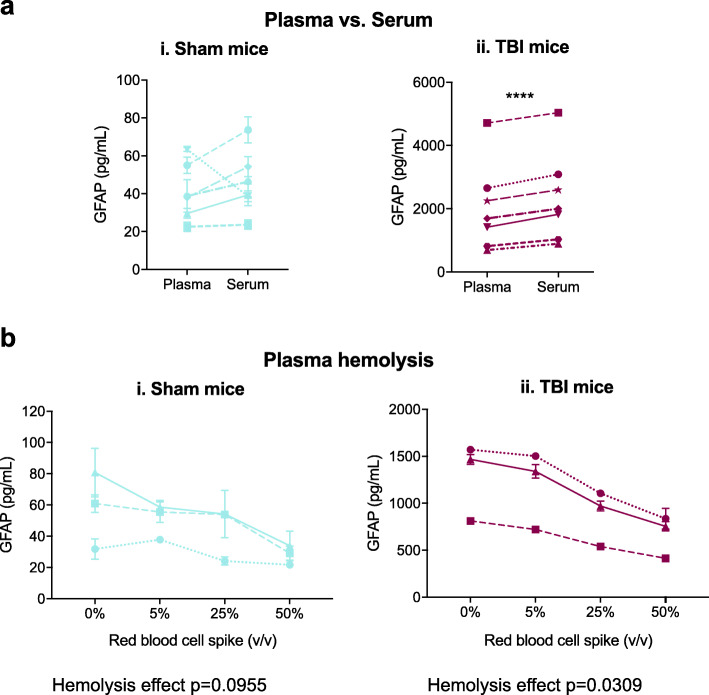
Methods: We developed and validated a novel sensitive GFAP immunoassay assay for mouse plasma on the Meso Scale Discovery immunoassay platform and validated assay performance for robustness, precision, limits of quantification, dilutional linearity, parallelism, recovery, stability, selectivity, and pre-analytical factors. To provide proof-of-concept data for this assay as a translational research tool for TBI and Alzheimer's disease (AD), plasma GFAP was measured in mice exposed to TBI using the Closed Head Impact Model of Engineered Rotational Acceleration (CHIMERA) model and in APP/PS1 mice with normal or reduced levels of plasma high-density lipoprotein (HDL).

Results: We performed a partial validation of our novel assay and found its performance by the parameters studied was similar to assays used to quantify human GFAP in clinical neurotrauma blood specimens and to assays used to measure murine GFAP in tissues. Specifically, we demonstrated an intra-assay CV of 5.0%, an inter-assay CV of 7.2%, a lower limit of detection (LLOD) of 9.0 pg/mL, a lower limit of quantification (LLOQ) of 24.8 pg/mL, an upper limit of quantification (ULOQ) of at least 16,533.9 pg/mL, dilution linearity of calibrators from 20 to 200,000 pg/mL with 90-123% recovery, dilution linearity of plasma specimens up to 32-fold with 96-112% recovery, spike recovery of 67-100%, and excellent analyte stability in specimens exposed to up to 7 freeze-thaw cycles, 168 h at 4 °C, 24 h at room temperature (RT), or 30 days at - 20 °C. We also observed elevated plasma GFAP in mice 6 h after TBI and in aged APP/PS1 mice with plasma HDL deficiency. This assay also detects GFAP in serum.

Conclusions: This novel assay is a valuable translational tool that may help to provide insights into the mechanistic pathophysiology of TBI and AD.

Keywords: CHIMERA; GFAP; Immunoassay; Plasma biomarker; TBI.


Conflict of interest statement

The authors declare that they have no competing interests.

Figures

Fig. 1
Fig. 1
The assay is robust to changes in antibody incubation duration but less robust to changes in samples incubation duration. a Low-, b intermediate-, and c high-concentration plasma pools were assayed using the standard assay protocol (1 h capture antibody incubation, 2 h sample incubation, 1 h detection antibody incubation) and several protocols with modifications to incubation durations. Robustness to protocol modifications was assessed by observing the variation in sample duplicate measurements and the closeness of the measured sample concentrations under each protocol to the measurements under the standard protocol. Mean concentration of duplicates is plotted with each point representing an individual sample replicate and error bars representing ± SD. Differences in measured sample concentration compared to the standard assay protocol were analyzed by one-way ANOVA with Dunnett’s multiple comparisons test and displayed within the graphs as *p < 0.05. o/n: overnight, SD: standard deviation
Fig. 2
Fig. 2
High intra-assay and inter-assay precision is observed for low-, intermediate-, and high-concentration samples. Assay precision was determined through the measurement of a low-, b intermediate-, and c high-concentration plasma pools over 5 days with 5 sample replicates per day. Mean concentration of replicates is plotted with each point representing an individual sample replicate and error bars representing ± SD. Differences in measured sample concentration between assay replicates were analyzed by one-way ANOVA with Tukey’s multiple comparisons test and displayed within the graph as *p < 0.05, **p < 0.01, and ****p < 0.0001. SD: standard deviation
Fig. 3
Fig. 3
The assay has a wide quantitative dynamic range from 25 pg/mL to at least 16,533 pg/mL and a lower limit of detection of 9 pg/mL. Eight plasma samples with a very low or b very high expected GFAP concentrations were assayed in duplicate and c CV of duplicates were determined. d 16 blank replicates (1% BSA in PBS) were assayed to calculate an estimated lower limit of quantification and lower limit of detection as described in Table 6. a,b,d Mean concentration of replicates is plotted with each point representing an individual sample replicate and error bars representing ± SD. c Points represent mean sample concentration and CV of duplicates. ac Circles represent samples from female mice, squares represent samples from male mice. AU: arbitrary units, CV: coefficient of variation, SD: standard deviation, BSA: bovine serum albumin, PBS: phosphate-buffered saline, ECL: electrochemiluminescence
Fig. 4
Fig. 4
The assay shows high dilution linearity over a wide range of calibrator and plasma specimen dilutions. Assay calibrator was spiked into 3 individual plasma samples with very low endogenous GFAP to a concentration of 2,000,000 pg/mL. Serial dilutions from 10-fold to 1,000,000-fold were made and samples at each dilution step were assayed in duplicate. a Percent recovery of samples spiked with calibrator plotted against dilution factor. b ECL signal of samples spiked with calibrator were plotted against the dilution factor. Serial dilutions were performed from 2-fold to 64-fold on 3 plasma samples with high endogenous GFAP concentrations. c Percent recovery of diluted plasma samples plotted against dilution factor. d ECL signal of diluted plasma samples and calibrator plotted against dilution factor. Points represent mean concentration of duplicates and error bars represent ±SD. For some points, the error bars are shorter than the height of the symbol and therefore are not shown. AU: arbitrary units, ECL: electrochemiluminescence
Fig. 5
Fig. 5
Spike recovery of the assay is optimal for specimens with high endogenous GFAP concentrations and sub-optimal for specimens with low endogenous GFAP concentrations. a Five plasma samples were spiked with calibrator at 0, 100, 1000, or 10,000 pg/mL. Mean percent recovery is plotted at each spike concentration with points representing individual spiked sample percent recovery and error bars representing ±SD. Point shapes represent individual plasma samples. %recovery = ((measured concentration spiked sample-measured concentration neat sample)/concentration of spike) × 100%. SD: standard deviation
Fig. 6
Fig. 6
Assay measurements remain stable in specimens exposed to up to 7 freeze-thaw cycles, 168 h at 4 °C, 24 h at room temperature, or 30 days at − 20 °C. a Samples from low-, intermediate-, and high-concentration plasma pools were assayed after a number a freeze-thaw cycles. Samples from b low-, c intermediate-, and d high-concentration plasma pools were also assayed after incubation at 4 °C, room temperature, or − 20 °C. (i) Normalized concentrations relative to samples directly stored at − 80 °C and (ii) variation in sample duplicates are plotted. Points represent (i) mean normalized concentration or (ii) CV of duplicates and (i) error bars represent ±SD. For some points, the error bars are shorter than the height of the symbol and therefore are not shown. The effect of plasma temperature modification on measured concentration was analyzed by repeated measures one-way ANOVA with Dunnett’s multiple comparisons test; no significant differences were found. CV: coefficient of variation, RT: room temperature
Fig. 7
Fig. 7
Assay measurements are slightly higher in serum than in plasma and are reduced in the presence of hemolysis. Blood was collected from mice 6 h after isoflurane exposure (sham) (i) or isoflurane exposure and TBI (ii) by cardiac puncture into tubes with (plasma) and without (serum) EDTA. a Plasma and serum were isolated by centrifugation and were assayed in duplicate. Differences in concentrations by matrix were analyzed by paired t test, ****p < 0.0001. b Plasma specimens were spiked with 0%, 5%, 25%, or 50% red blood cells, frozen at − 80 °C for 1 h, thawed, and assayed in duplicate. The effect of hemolysis on measured concentrations was analyzed by one-way ANOVA with repeated measures (exact p values are shown below graphs) followed by Dunnett’s multiple comparisons test, no significant differences from neat plasma were found. Mean plasma GFAP concentrations for each mouse are plotted with points representing mean and error bars ±SD of duplicates, in some cases error bars are smaller than the symbol. TBI: traumatic brain injury, EDTA: ethylenediaminetetraacetic acid, SD: standard deviation
Fig. 8
Fig. 8
Assay measurements are unaffected by a delay in blood centrifugation to plasma but may be affected by route of blood collection. Blood was collected from mice 6 h after isoflurane exposure (sham) or isoflurane exposure and TBI by the saphenous vein and by cardiac puncture. Saphenous blood was immediately centrifuged to plasma. Blood collected by cardiac puncture was separated into two equal aliquots. One aliquot was immediately centrifuged to plasma (optimal) and one aliquot was left on ice for 4 h before centrifugation to plasma (4 h on ice). After centrifugation to plasma, samples were immediately stored at − 80 °C. Samples were assayed in duplicate. Mean plasma GFAP concentrations for each mouse are plotted with points representing mean and error bars ±SD of duplicates. The effect of blood collection and processing method on measured concentration was analyzed by paired t test; no significant differences were found. SD: standard deviation, TBI: traumatic brain injury
Fig. 9
Fig. 9
Murine plasma GFAP concentrations are acutely elevated after a closed-head TBI. Male and female C57Bl/6 mice aged 3.5–5 months were anesthetized with isoflurane then exposed to a 2.5 J closed-head TBI with a CHIMERA device or to isoflurane without TBI (sham). Blood was collected by cardiac puncture 6 h or 2 d after the sham or TBI procedure and centrifuged to plasma. a Mean plasma GFAP concentrations of each group are plotted with points representing individual mouse plasma samples and error bars representing ±SD. Circles represent female mice and triangles represent male mice. The effects of injury and time after injury on plasma GFAP concentrations were analyzed by two-way ANOVA (exact p values below graph) followed by Sidak’s multiple comparisons test (detailed within graph) where ****p < 0.0001. Correlations between plasma GFAP concentrations and b neurological severity score 2 h after sham or TBI procedure and c brain IL-6 concentrations were analyzed by Spearman correlation. Significant correlations are displayed below graphs with exact p values. TBI: traumatic brain injury, SD: standard deviation, IL-6: interleukin 6, CHIMERA: closed-head injury model of engineered rotational acceleration
Fig. 10
Fig. 10
Plasma GFAP levels are elevated in aged APP/PS1 mice and APP/PS1 mice lacking apoA-I. a Female APP/PS1 mice (on a mixed C3H/Bl6 background) were aged to 3, 6, 9, 12, 18, or 24 months old then plasma specimens were collected by cardiac puncture. Mean plasma GFAP concentrations of each group are plotted with points representing individual mouse plasma samples and error bars representing ±SD. The effects of age and APP/PS1 genotype on plasma GFAP concentration were analyzed by two-way ANOVA (exact p values below graph) followed by Tukey’s multiple comparisons test across genotypes (exact p values below graph) or Sidak’s multiple comparison’s test within each genotype (detailed within graph, **p < 0.01, ***p < 0.001). b Male and female apoA-I hemizygous (apoA-IHEM) or knockout (apoA-IKO) mice with or without APP/PS1 transgenes (on a C57Bl/6 background) were aged to 12 months old then plasma specimens were collected by cardiac puncture. Mean plasma GFAP concentrations of each group are plotted with points representing individual mouse plasma samples and error bars representing ±SD. The effects APP/PS1 genotype and apoA-I genotype on plasma GFAP concentration were analyzed by two-way ANOVA (exact p values below graph) followed by Sidak’s multiple comparisons test (detailed within graph *p < 0.05, **p < 0.01). apoA-I: apolipoprotein A-I, SD: standard deviation

References

    1. Hampel H, O’Bryant SE, Molinuevo JL, Zetterberg H, Masters CL, Lista S, et al. Blood-based biomarkers for Alzheimer disease: mapping the road to the clinic. Nat Rev Neurol. 2018;14(11):639–652. doi: 10.1038/s41582-018-0079-7. - DOI - PMC - PubMed
    1. Zetterberg H, Blennow K. Fluid biomarkers for mild traumatic brain injury and related conditions. Nat Rev Neurol. 2016;12(10):563–574. doi: 10.1038/nrneurol.2016.127. - DOI - PubMed
    1. FDA authorizes marketing of first blood test to aid in the evaluation of concussion in adults. 2018. Available from: https://www.fda.gov/news-events/press-announcements/fda-authorizes-marke.... Accessed 18 Sep 2020.
    1. Bazarian JJ, Biberthaler P, Welch RD, Lewis LM, Barzo P, Bogner-Flatz V, et al. Serum GFAP and UCH-L1 for prediction of absence of intracranial injuries on head CT (ALERT-TBI): a multicentre observational study. Lancet Neurol. 2018;17(9):782–789. doi: 10.1016/S1474-4422(18)30231-X. - DOI - PubMed
    1. Anderson TN, Hwang J, Munar M, Papa L, Hinson HE, Vaughan A, et al. Blood-based biomarkers for prediction of intracranial hemorrhage and outcome in patients with moderate or severe traumatic brain injury. J Trauma Acute Care Surg. 2020;89(1):80–86. doi: 10.1097/TA.0000000000002706. - DOI - PMC - PubMed

Publication types

LinkOut - more resources