. 2021 Jan 28;48(2):e2020GL090112.
doi: 10.1029/2020GL090112. Epub 2021 Jan 19.

Steep Glacier Bed Knickpoints Mitigate Inland Thinning in Greenland

Affiliations

Steep Glacier Bed Knickpoints Mitigate Inland Thinning in Greenland

Denis Felikson et al. Geophys Res Lett. .

Abstract

Greenland's outlet glaciers have been a leading source of mass loss and accompanying sea-level rise from the Greenland Ice Sheet (GrIS) over the last 25 years. The dynamic component of outlet glacier mass loss depends on both the ice flux through the terminus and the inland extent of glacier thinning, initiated at the ice-ocean interface. Here, we find limits to the inland spread of thinning that initiates at glacier termini for 141 ocean-terminating outlet glaciers around the GrIS. Inland diffusion of thinning is limited by steep reaches of bed topography that we call "knickpoints." We show that knickpoints exist beneath the majority of outlet glaciers but they are less steep in regions of gentle bed topography, giving glaciers in gentle bed topography the potential to contribute to ongoing and future mass loss from the GrIS by allowing the diffusion of thinning far into the ice sheet interior.


Figures

Figure 1
Figure 1
Geometry and predicted flowline thinning limits for two GrIS outlet glaciers. (a) Smoothed topography along Humboldt Gletscher flowlines with distance from terminus showing bed (black) and ice sheet surface (blue) along surveyed flowlines. (b) Péclet number along flowlines (gray) and Pe = 3 threshold (dashed red line). (c) Flowlines overlaid on top of bed topography in map view. (d)(f) Similar to (a–c) at Helheimgletscher; identified knickpoints (red) in (d); locations where observed cumulative thinning along flowlines reaches 89% are shown as black diamonds in (d) (further discussed in the text); predicted flowline thinning limits shown as green diamonds in (d and f). Green diamonds in (b, c, e, and f) show locations of predicted flowline thinning limits. Glacier locations shown on GrIS map insert.
Figure 2
Figure 2
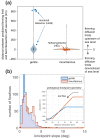
Distances from GrIS margin to predicted flowline thinning limits and knickpoint slopes in regions of gentle and mountainous bed topography. (a) Violin plots of distances between predicted flowline thinning limits and locations (along flow) where the bed rises above sea level for all GrIS flowlines within regions of gentle and mountainous bed topography (Helheimgletscher distances shown as red dots; Humboldt Gletscher distances shown as blue dots). Violin plots show box and whisker plot as well as a kernel density estimation of the underlying distribution of data (i.e., the width of the shaded area represents the relative proportion of the number of flowlines located at a particular distance). Thinning limits that are collocated exactly with the location where the bed rises above sea level would plot along y = 0. Predicted flowline thinning limits that are upstream of the location where the bed rises above sea level plot above y = 0 and those that are downstream plot below y = 0. (b) Normalized histograms of the slopes of identified knickpoints at the location where the bed rises above sea level. Inset shows a prototypical knickpoint using the median trough depths, median knickpoint slope, and median upstream height for knickpoints in gentle regions (blue) and mountainous regions (red).
Figure 3
Figure 3
Glacier thinning limits and potential for dynamic mass loss of 141 GrIS outlet glaciers. (a) Distances from ice sheet margin to thinning limits plotted against ice fluxes for glaciers in regions of gentle (circles) and mountainous (squares) bed topography. Purple markers indicate a group of glaciers with thinning limits >200 km from the ice margin; yellow markers indicate a group of glaciers with >5 km3/yr ice flux. White x's inside purple markers indicate nine glaciers in NW Greenland, discussed in the text. (b) Flowlines for each glacier drawn from the terminus to the predicted glacier thinning limit and colored according to groupings shown in (a), shown on top of Greenland bed topography. Regions of mountainous bed topography (red coastlines) and gentle bed topography (blue coastlines) shown. Upernavik Isstrøm C (UPR‐C), Cornell Gletscher (COR), Humboldt Gletcher (HUM), Kangerlussuaq Gletscher (KAN), Helheimgletscher (HEL), and Jakobshavn Isbræ (JAK) referenced in the text, are labeled in both panels.

References

    1. Bevan, S. L. , Luckman, A. J. , & Murray, T. (2012). Glacier dynamics over the last quarter of a century at Helheim, Kangerdlugssuaq and 14 other major Greenland outlet glaciers. The Cryosphere, 6(5), 923–937. 10.5194/tc-6-923-2012 - DOI
    1. Bindschadler, R. A. (1997). Actively surging West Antarctic ice streams and their response characteristics. Annals of Glaciology, 24, 409–414. 10.3189/s0260305500012520 - DOI
    1. Carr, J. R. , Stokes, C. , & Vieli, A. (2014). Recent retreat of major outlet glaciers on Novaya Zemlya, Russian Arctic, influenced by fjord geometry and sea‐ice conditions. Journal of Glaciology, (60)(219), 155–170. 10.3189/2014jog13j122 - DOI
    1. Catania, G. A. , Stearns, L. A. , Sutherland, D. A. , Fried, M. J. , Bartholomaus, T. C. , Morlighem, M. , Shroyer, E. , & Nash, J. (2018). Geometric Controls on Tidewater Glacier Retreat in Central Western Greenland. Journal of Geophysical Research: Earth Surface, 123(8), 2024–2038. 10.1029/2017jf004499 - DOI
    1. Csatho, B. M. , Schenk, A. F. , van der Veen, C. J. , Babonis, G. , Duncan, K. , Rezvanbehbahani, S. , van den Broeke, M. R. , Simonsen, S. B. , Nagarajan, S. , & van Angelen, J. H. (2014). Laser altimetry reveals complex pattern of Greenland Ice Sheet dynamics. Proceedings of the National Academy of Sciences, 111(52), 18478–18483. 10.1073/pnas.1411680112 - DOI - PMC - PubMed

References From the Supporting Information

    1. Cuffey, K. , & Paterson, W. S. B. (2010). The physics of glaciers (4th ed.). Academic Press.
    1. Howat, I. M. , & Eddy, A. (2011). Multi‐decadal retreat of Greenland’s marine‐terminating glaciers. Journal of Glaciology, 57(203), 389–396. 10.3189/002214311796905631 - DOI
    1. Hutter, K. (1983). Theoretical glaciology: Material science of ice and the mechanics of glaciers and ice sheets. Dordrecht, The Netherlands: Reidel Publishing.
    1. Joughin, I. , Smith, B. , Howat, I. , & Scambos, T. (2016). MEaSUREs Multi‐year Greenland Ice Sheet Velocity Mosaic, Version 1. Boulder, CO: NASA National Snow and Ice Data Center Distributed Active Archive Center; 10.5067/QUA5Q9SVMSJG - DOI
    1. Joughin, I. , Smith, B. E. , & Howat, I. M. (2018). A complete map of Greenland ice velocity derived from satellite data collected over 20 years. Journal of Glaciology, 64(243), 1–11. 10.1017/jog.2017.73 - DOI - PMC - PubMed