

COVID-19 outbreak and Urban dynamics: regional variations in India
- PMID: 33678946
- PMCID: PMC7925257
- DOI: 10.1007/s10708-021-10394-6
COVID-19 outbreak and Urban dynamics: regional variations in India
Abstract
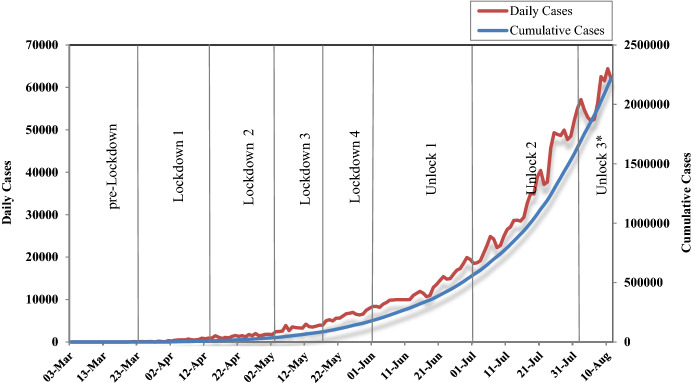
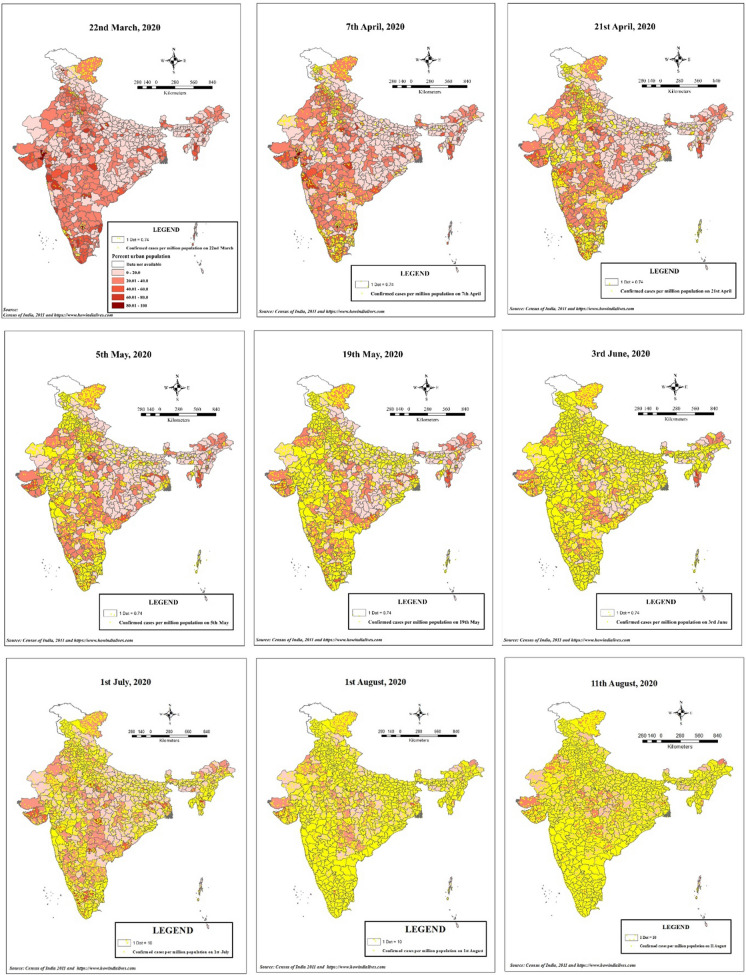
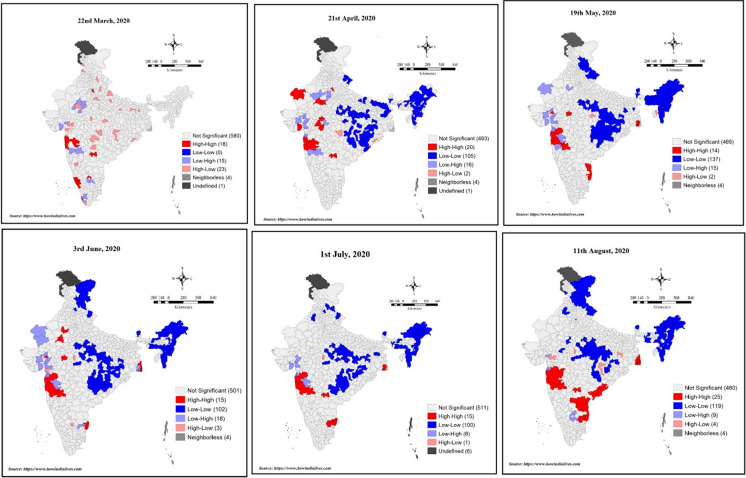
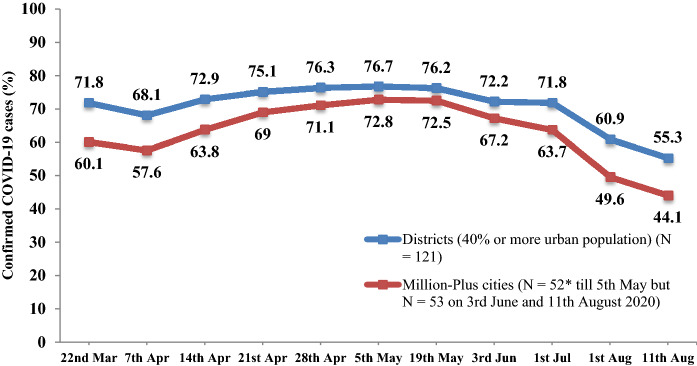
India was the second highest COVID-19 affected country in the world with 2.1 million cases by 11th August. This study focused on the spatial transmission of the pandemic among the 640 districts in India over time, and aimed to understand the urban-centric nature of the infection. The connectivity context was emphasized that possibly had inflicted the outbreak. Using the modes of transmission data for the available cases, the diffusion of this disease was explained. Metropolitans contributed three-fourths of total cases from the beginning. The transport networks attributed significantly in transmitting the virus from the urban containment zones. Later, there was a gradual shift of infections from urban to rural areas; however, the numbers kept increasing in the former. The massive reverse migration after lockdown spiked the infected cases further. Districts with airports reported more with influx of international passengers. A profound east-west division in April with higher infections in the southern and western districts existed. By mid-May eastern India saw a steep rise in active cases. Moran's I analysis showed a low autocorrelation initially which increased over time. Hotspot clustering was observed in western Maharashtra, eastern Tamil Nadu, Gujarat and around Kolkata by the second week of August. The diffusion was due to travel, exposure to infected individuals and among the frontline workers. Spatial regression models confirmed that urbanization was positively correlated with higher incidences of infections. Transit mediums, especially rail and aviation were positively associated. These models validated the crucial role of spatial proximity in diffusion of the pandemic.
Keywords: COVID-19; Cities; Modes of transmission; Spatial regression models; Travel networks; Urban-centric.
© The Author(s), under exclusive licence to Springer Nature B.V. part of Springer Nature 2021.
Conflict of interest statement
Conflicts of interestThe authors declare that there was no potential conflicts of interest while conducting the research or preparing the manuscript. No research grant was obtained from funding agencies to prepare this manuscript. This study has been carried out using secondary data and did not involve any human participants or animals. All the data are available in the public domain thus, no Informed consent was required.
Figures
References
-
- Anselin L, Syabri I, Kho Y. GeoDa: An introduction to spatial data analysis. Geographical Analysis. 2006;38(1):5–22. doi: 10.1111/j.0016-7363.2005.00671.x. - DOI
-
- Avetisyan, S. (2020). Coronavirus and urbanisation: do pandemics are anti-urban? Retrieved from https://papers.ssrn.com/sol3/papers.cfm?abstract_id=3584395.
LinkOut - more resources
Full Text Sources
Other Literature Sources
Miscellaneous