HIV in Canada-surveillance report, 2019
- PMID: 33679250
- PMCID: PMC7927910
- DOI: 10.14745/ccdr.v47i01a11
HIV in Canada-surveillance report, 2019
Abstract
Background: Human immunodeficiency virus (HIV) is a global public health issue. HIV has been nationally notifiable in Canada since 1985. The Public Health Agency of Canada (PHAC) monitors trends in new HIV diagnoses.
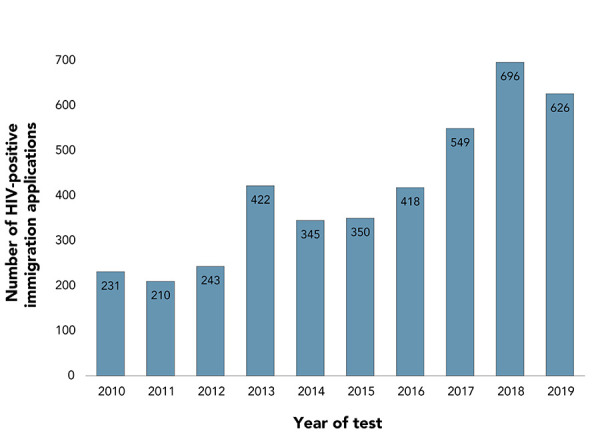
Objectives: The objective of this surveillance report is to provide an overview of the epidemiology of reported HIV cases in 2019 in Canada. The report highlights 10-year trends (2010-2019). Data on HIV diagnosed through Immigration Medical Exams (IME) and trends in perinatal transmission of HIV are also presented.
Methods: PHAC monitors HIV through the HIV/AIDS Surveillance System, a passive, case-based system that collates non-nominal data submitted voluntarily by all Canadian provinces and territories. Descriptive analyses were conducted on national data. IME data were obtained from Immigration, Refugees and Citizenship Canada (IRCC), and data on HIV-exposed pregnancies were obtained through the Canadian Perinatal HIV Surveillance Program.
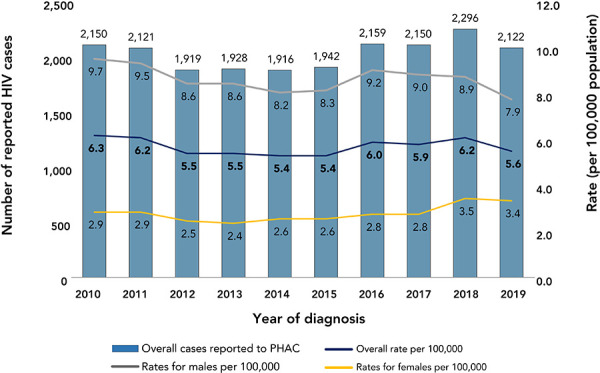
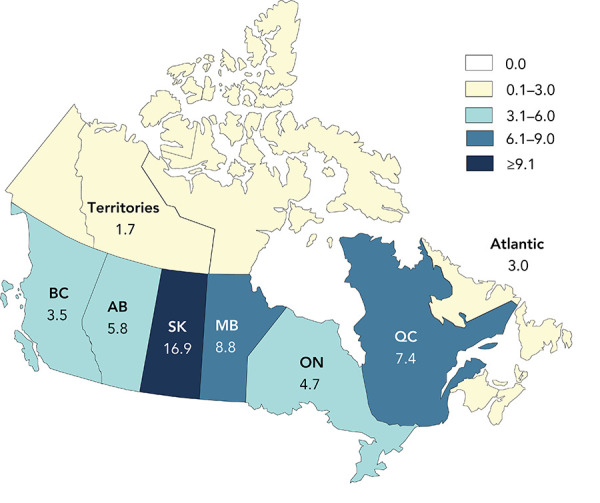
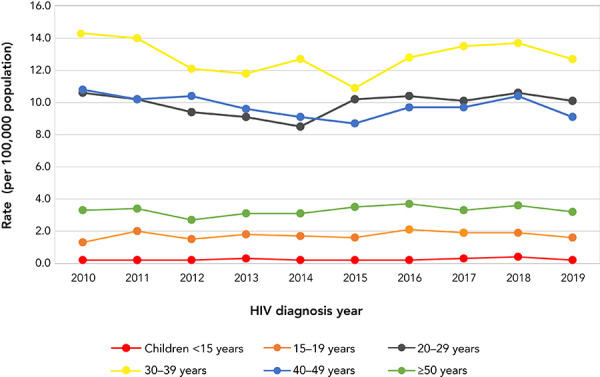
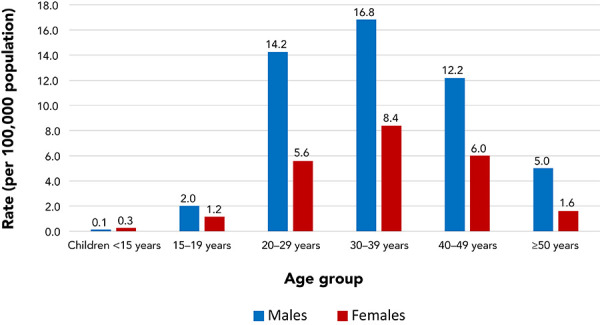
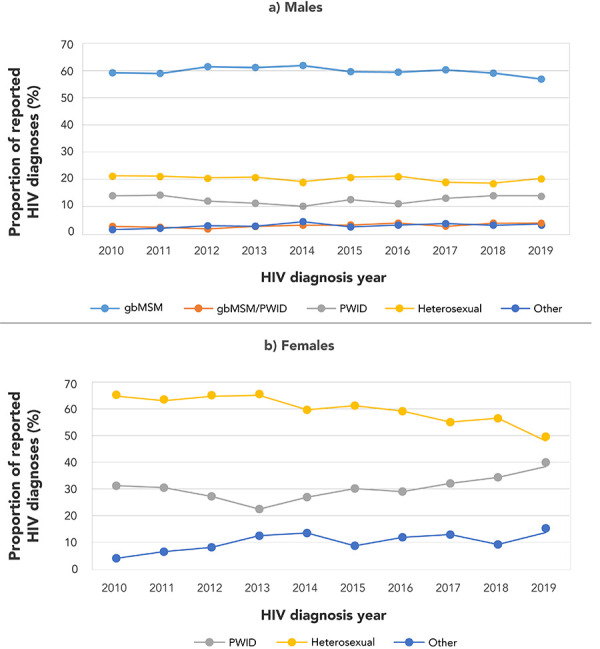
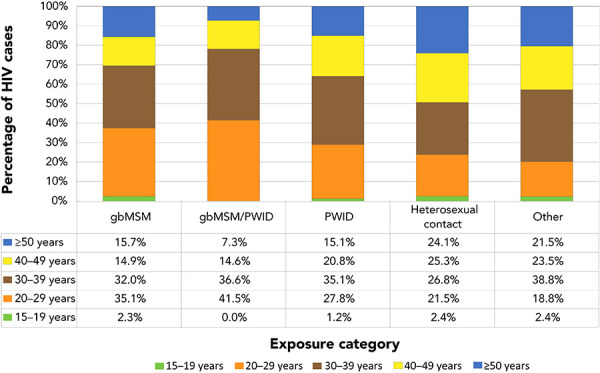
Results: In 2019, a total of 2,122 HIV diagnoses were reported in Canada (5.6 per 100,000 population). Saskatchewan reported the highest provincial diagnosis rate at 16.9 per 100,000 population. The 30 to 39-year age group had the highest HIV diagnosis rate at 12.7 per 100,000 population. While the rates for both males and females fluctuated in the past decade, since 2010 the rates among males decreased overall, while the rate among females increased slightly. As in previous years, the diagnosis rate for males in 2019 was higher than that for females (7.9 versus 3.4 per 100,000 population, respectively). The highest proportion of all reported adult cases with known exposure were gay, bisexual and other men who have sex with men (gbMSM, 39.7%), followed by cases attributed to heterosexual contact (28.3%) and among people who inject drugs (PWID, 21.5%). The number of migrants who tested positive for HIV during an IME conducted in Canada was 626. The one documented perinatal HIV transmission related to a mother who had not received antepartum or intrapartum antiretroviral therapy prophylaxis.
Conclusion: The number and rate of reported HIV cases in Canada has remained relatively stable over the last decade, with minor year-to-year variations. As in previous years, the gbMSM and PWID populations represent a high proportion of HIV diagnoses, although a sizable number of cases were attributed to heterosexual contact. It is important to routinely monitor trends in HIV in light of pan-Canadian commitments to reduce the health impact of sexually transmitted and blood-borne infections by 2030.
Keywords: Canada; HIV; bixexual and other men who have sex with men; gay; heterosexual contact; people who inject drugs; perinatal HIV; surveillance.
Conflict of interest statement
Competing interests: None.
Figures
References
-
- The Joint United Nations Programme on HIV/AIDS. UNAIDS data 2020. Geneva (CH): UNAIDS; 2020. https://www.unaids.org/sites/default/files/media_asset/2020_aids-data-bo... - PubMed
-
- Public Health Agency of Canada. Estimates of HIV incidence, prevalence and Canada’s progress on meeting the 90-90-90 HIV targets, 2018. Ottawa (ON): PHAC; 2020 (accessed 2020-12-17). https://www.canada.ca/en/public-health/services/publications/diseases-co...
-
- Public Health Agency of Canada. Population-specific HIV/AIDS status report: people living with HIV/AIDS. Ottawa (ON): PHAC; 2013 (accessed 2020-12-17). https://www.canada.ca/en/public-health/services/hiv-aids/publications/po...
-
- Public Health Agency of Canada. Reducing the health impact of sexually transmitted and blood-borne infections in Canada by 2030: a pan-Canadian STBBI framework for action. Ottawa (ON): PHAC; 2019 (accessed 2020-12-17). https://www.canada.ca/en/public-health/services/infectious-diseases/sexu...
-
- Public Health Agency of Canada. Accelerating our response: Government of Canada five-year action plan on sexually transmitted and blood-borne infections. Ottawa (ON): PHAC; 2019 (accessed 2020-12-17). https://www.canada.ca/en/public-health/services/reports-publications/acc... - PMC - PubMed
LinkOut - more resources
Full Text Sources
Other Literature Sources
Research Materials
Miscellaneous