Effects of Ocular Direct Current Stimulation on Full Field Electroretinogram
- PMID: 33679299
- PMCID: PMC7928396
- DOI: 10.3389/fnins.2021.606557
Effects of Ocular Direct Current Stimulation on Full Field Electroretinogram
Abstract
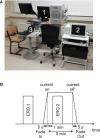
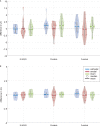
Studies on weak current stimulation (1-2 mA) examine effects on neuronal cells for the treatment of neurological diseases, like depression. Ocular current stimulation showed positive effects on retinal nerve cells which indicate that neurodegenerative ocular diseases, e.g., glaucoma, can be treated with current stimulation of the eye. However, up to now it remains unclear which exact retinal cells can be influenced. During an ocular direct current stimulation, a significant reduction of the characteristic P50 amplitude of a pattern-reversal electroretinogram (PERG) was found for an anodal and a cathodal stimulation. This current stimulation effect could originate from the modulation of pre-ganglion cell activity or by changes in local ON and OFF responses of ganglion cells. For clarification, we investigate acute direct current stimulation effects on a full field electroretinogram (ERG), which represents the activity of pre-ganglion cells (specifically cones and bipolar cells). The ERG from 15 subjects was evaluated before (ERG 1) and during (ERG 2) an ocular direct current stimulation with 800 μA over 5 min. The current was applied through a ring rubber electrode placed around the eye and a 25 cm2 rubber electrode placed at the ipsilateral temple. For ERG measurements, sintered Ag/AgCl skin-electrodes were positioned on the lower eyelid (active), the earlobe (reference), and the forehead (ground). The volunteers were stimulated in three independent sessions, each with a different current application (randomized order): cathodal polarity, anodal polarity (referred to the electrode around the eye), or sham stimulation. The changes between the two ERG measurements of the characteristic full field ERG amplitudes, a-wave, b-wave, and b'-wave (b-wave measured from zero line) were tested with the Wilcoxon signed-rank test (α = 0.05). Comparing before to during the current stimulation for all applications, the ERG waves showed no effects on amplitudes or latencies. Furthermore, no significant difference between the cathodal, anodal, and sham stimulation could be found by a Friedman test. These results indicate an unlikely contribution of pre-ganglion cells to the previously reported stimulation effect on PERG signals.
Keywords: direct current stimulation; electroretinogram; full field ERG; non-invasive brain stimulation; ocular electrical stimulation; transorbital electrical stimulation.
Copyright © 2021 Blum, Solf, Hunold and Klee.
Conflict of interest statement
The authors declare that the research was conducted in the absence of any commercial or financial relationships that could be construed as a potential conflict of interest.
Figures


Similar articles
-
Ocular direct current stimulation affects retinal ganglion cells.Sci Rep. 2021 Sep 2;11(1):17573. doi: 10.1038/s41598-021-96401-9. Sci Rep. 2021. PMID: 34475417 Free PMC article.
-
The Effects of an Ocular Direct Electrical Stimulation on Pattern-Reversal Electroretinogram.Front Neurosci. 2020 Jun 10;14:588. doi: 10.3389/fnins.2020.00588. eCollection 2020. Front Neurosci. 2020. PMID: 32587502 Free PMC article.
-
Cervical trans-spinal direct current stimulation: a modelling-experimental approach.J Neuroeng Rehabil. 2019 Oct 25;16(1):123. doi: 10.1186/s12984-019-0589-6. J Neuroeng Rehabil. 2019. PMID: 31653265 Free PMC article. Clinical Trial.
-
The photopic negative response (PhNR): measurement approaches and utility in glaucoma.Int Ophthalmol. 2020 Dec;40(12):3565-3576. doi: 10.1007/s10792-020-01515-0. Epub 2020 Jul 31. Int Ophthalmol. 2020. PMID: 32737731 Free PMC article. Review.
-
Update on the pattern electroretinogram in glaucoma.Optom Vis Sci. 2008 Jun;85(6):386-95. doi: 10.1097/OPX.0b013e318177ebf3. Optom Vis Sci. 2008. PMID: 18521020 Review.
Cited by
-
Effects of tACS-Like Electrical Stimulation on Off- and On-Off Center Retinal Ganglion Cells: Part II.Eye Brain. 2022 Jan 25;14:17-33. doi: 10.2147/EB.S313090. eCollection 2022. Eye Brain. 2022. PMID: 35115857 Free PMC article.
-
Ocular direct current stimulation affects retinal ganglion cells.Sci Rep. 2021 Sep 2;11(1):17573. doi: 10.1038/s41598-021-96401-9. Sci Rep. 2021. PMID: 34475417 Free PMC article.
-
Evaluation of visual acuity in dry AMD patients after microcurrent electrical stimulation.Int J Retina Vitreous. 2023 Jun 18;9(1):36. doi: 10.1186/s40942-023-00471-y. Int J Retina Vitreous. 2023. PMID: 37331928 Free PMC article.
References
-
- Bach M., Hoffmann M. B. (2006). “The origin of the pattern electroretinogram,” in Principles and Practice of Clinical Electrophysiology of Vision, eds Heckenlively J. R., Arden G. B. (Cambridge, MA: The Mit Press; ), 185–196.
-
- Bikson M., Paulus W., Esmaeilpour Z., Kronberg G., Nitsche M. A. (2019). “Mechanisms of acute and after effects of transcranial direct current stimulation,” in Practical Guide to Transcranial Direct Current Stimulation, eds Knotkova H., Nitsche M., Bikson M., Woods A. (Cham: Springer; ), 81–113. 10.1007/978-3-319-95948-1 - DOI
LinkOut - more resources
Full Text Sources
Other Literature Sources
Research Materials
Miscellaneous

