. 2021 Feb 19:13:634412.
doi: 10.3389/fnsyn.2021.634412. eCollection 2021.

Phenotypic Characterization and Brain Structure Analysis of Calcium Channel Subunit α2δ-2 Mutant (Ducky) and α2δ Double Knockout Mice

Affiliations

Phenotypic Characterization and Brain Structure Analysis of Calcium Channel Subunit α2δ-2 Mutant (Ducky) and α2δ Double Knockout Mice

Stefanie M Geisler et al. Front Synaptic Neurosci. .

Abstract

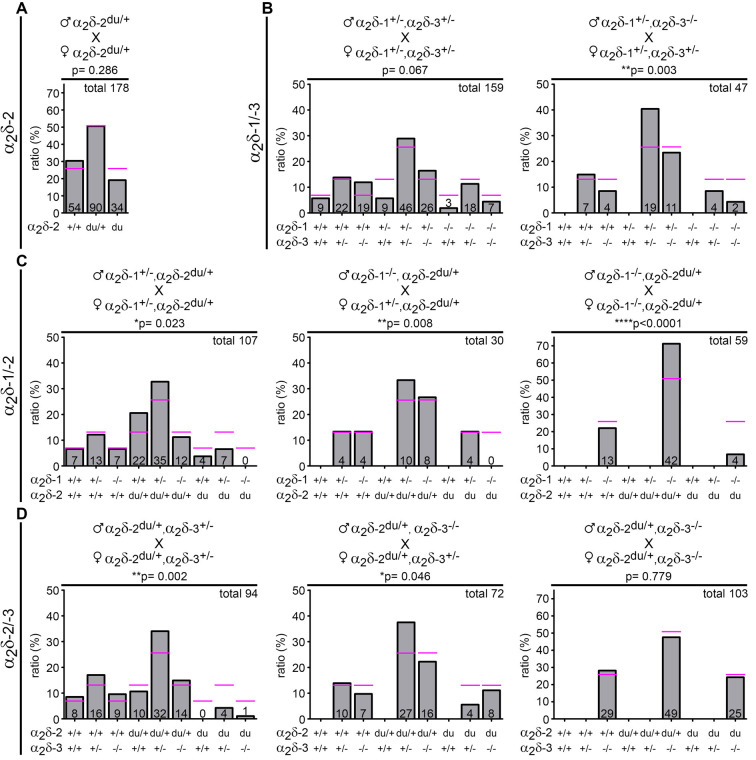
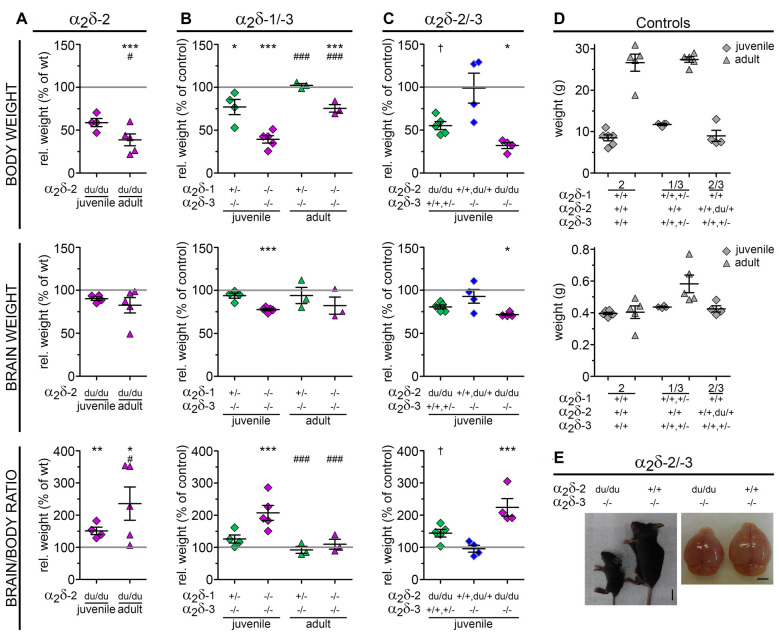
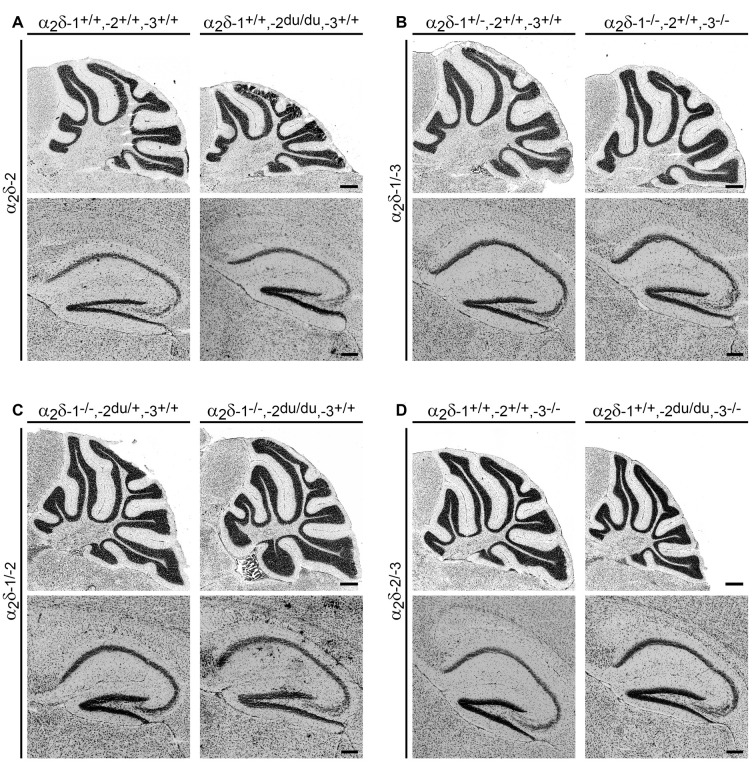
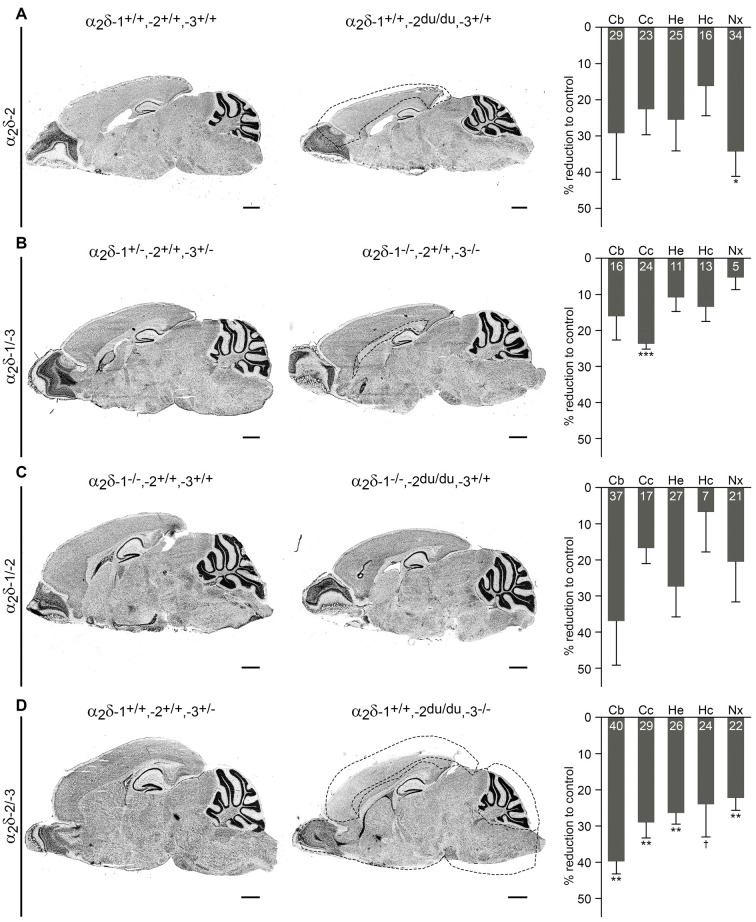
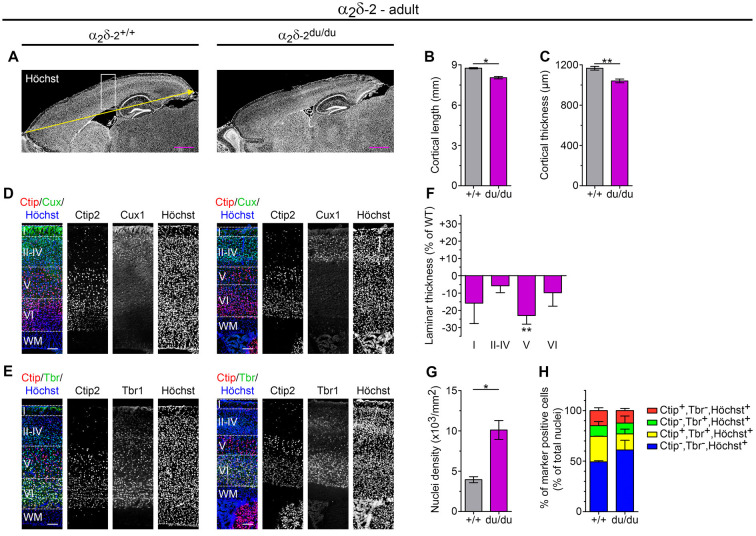
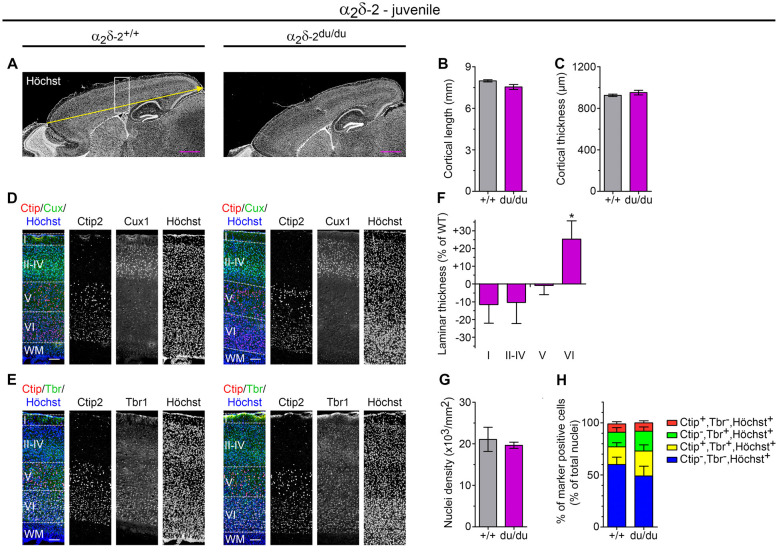
Auxiliary α2δ subunits of voltage-gated calcium channels modulate channel trafficking, current properties, and synapse formation. Three of the four isoforms (α2δ-1, α2δ-2, and α2δ-3) are abundantly expressed in the brain; however, of the available knockout models, only α2δ-2 knockout or mutant mice display an obvious abnormal neurological phenotype. Thus, we hypothesize that the neuronal α2δ isoforms may have partially specific as well as redundant functions. To address this, we generated three distinct α2δ double knockout mouse models by crossbreeding single knockout (α2δ-1 and -3) or mutant (α2δ-2/ducky) mice. Here, we provide a first phenotypic description and brain structure analysis. We found that genotypic distribution of neonatal litters in distinct α2δ-1/-2, α2δ-1/-3, and α2δ-2/-3 breeding combinations did not conform to Mendel's law, suggesting premature lethality of single and double knockout mice. Notably, high occurrences of infant mortality correlated with the absence of specific α2δ isoforms (α2Δ-2 > α2δ-1 > α2δ-3), and was particularly observed in cages with behaviorally abnormal parenting animals of α2δ-2/-3 cross-breedings. Juvenile α2δ-1/-2 and α2δ-2/-3 double knockout mice displayed a waddling gate similar to ducky mice. However, in contrast to ducky and α2δ-1/-3 double knockout animals, α2δ-1/-2 and α2δ-2/-3 double knockout mice showed a more severe disease progression and highly impaired development. The observed phenotypes within the individual mouse lines may be linked to differences in the volume of specific brain regions. Reduced cortical volume in ducky mice, for example, was associated with a progressively decreased space between neurons, suggesting a reduction of total synaptic connections. Taken together, our findings show that α2δ subunits differentially regulate premature survival, postnatal growth, brain development, and behavior, suggesting specific neuronal functions in health and disease.

Keywords: CACNA2D; brain disease; cortical lamination; over-grooming; stereology; voltage-gated calcium channels.


Conflict of interest statement

The authors declare that the research was conducted in the absence of any commercial or financial relationships that could be construed as a potential conflict of interest.

Figures

Figure 1
Figure 1
Genotype distribution is altered in neonatal litters bred from distinct α2δ inter-crosses. Expected (magenta lines) and observed (bar graphs) genotypes of neonatal offspring (P0–1) obtained by crossbreeding different α2δ mutant or single knockout mice (parental genotypes are shown above respective graphs). Symbols indicate either wildtype (+) or mutated (−) α2δ-1, α2δ-2, or α2δ-3 alleles. The absolute number of pups is displayed on the bars and the total amount of analyzed animals is depicted on the upper right side of each graph (confer Table 1 for further information on the number of analyzed litters and mean litter size). While the observed genotype ratio in litters was close to expected values when crossbreeding heterozygous α2δ-2 mutant mice (A) the frequency of distinct α2δ single knockout and double knockout mice was below expected ratios in α2δ-1/-3 (B) α2δ-1/-2 (C) and α2δ-2/-3 (D) inter-crosses. Statistics: Chi-square test: (A) χ(2)2 = 2.5; (B) left: χ(8)2 = 14.6, right: χ(5)2 = 18.1; (C) left: χ(8)2 = 17.8, middle: χ(5)2 = 15.6, right: χ(2)2 = 22.6; (D) left: χ(8)2 = 24.2, middle: χ(5)2 = 11.3, right: χ(2)2 = 0.5. Exact p-values are given in the respective graphs. Asterisks in graphs indicate significance levels: *p < 0.05, **p < 0.01, ****p < 0.0001.
Figure 2
Figure 2
Loss of distinct α2δ subunits causes impaired development. Relative body weight, brain weight and brain/body ratios calculated as percentage of controls (gray line and raw values in D) as a measure for proper development of α2δ-2 mutant mouse ducky (A) and α2δ-1/-3 (B) or α2δ-2/-3 (C) double knockout mice. Juvenile (3-4-week-old) or adult mice (8–13-week-old) are depicted with squares or triangles, respectively. In all three mouse models juvenile mice showed a highly decreased body weight together with a moderately reduced brain size resulting in 1.5-fold (A, ducky), 2-fold (B, α2δ-1/-3), or 2.2-fold (C, α2δ-2/-3) higher brain/body ratios compared to controls. The magnitude of this effect varied with age: while brain/body ratios were normalized to control levels in adult α2δ-1/-3 double knockout mice (B) a relatively mild increase in body weight during adulthood together with a moderately reduced brain size resulted in even more elevated brain/body ratios in ducky mice (A, 2.4-fold). Exemplary images of a α2δ-2/-3 double knockout mouse (left) at P21, depicting the remarkably smaller body and brain size compared to its α2δ-3 single knockout littermate (E). Values for individual animals (dots) and means (line) ± SEM are shown. N-numbers: (A) wildtype controls: six (juvenile) and five (adult), ducky mutant: four (juvenile) and five (adult); (B) wildtype or heterozygous controls: four (juvenile) and five (adult), α2δ-3 knockout: four (juvenile) and three (adult), α2δ-1/-3 double knockout: five (juvenile) and three (adult); (C) wildtype or heterozygous controls: 4, α2δ-2 knockout: 5, α2δ-3 knockout: 4, α2δ-2/-3 double knockout: 4. Statistics: two-way ANOVA with Holm–Sidak posthoc analysis: body weight: genotype: F(1,16) = 45.8, p < 0.001, age: F(1,16) = 64, p < 0.001, genotype × age: F(1,16) = 19.2, p < 0.001; brain weight: genotype: F(1,16) = 3.9, p = 0.064, age: F(1,16) = 0.1, p = 0.7, genotype × age: F(1,16) = 0.3, p = 0.6; Brain/body ratio: genotype: F(1,16) = 18.6, p < 0.001, age: F(1,16) = 39.8, p < 0.001, genotype × age: F(1,16) = 0.1, p = 0.8; (B) two-way ANOVA with Holm–Sidak posthoc analysis: body weight: genotype: F(2,18) = 50.7, p < 0.001, age: F(2,18) = 764.5, p < 0.001, genotype × age: F(2,18) = 2.8, p = 0.09; brain weight: genotype: F(2,18) = 5.9, p = 0.01, age: F(2,18) = 28.2, p < 0.001, genotype × age: F(2,18) = 0.1, p = 0.9; Brain/body ratio: genotype: F(2,18) = 9.2, p = 0.002, age: F(2,18) = 115.5, p < 0.001, genotype × age: F(2,18) = 5.0, p = 0.02; (C) one-way ANOVA with Holm–Sidak posthoc analysis: body weight: F(3,11) = 6.6, p = 0.008, post hoc: p = 0.053 between α2δ-2 single knockout and control, *p < 0.05 between α2δ-2/-3 double knockout and α2δ-3 single knockout/control; brain weight: F(3,11) = 5.8, p = 0.01, posthoc: p = 0.07 between α2δ-2 single knockout and control, *p = 0.015 between α2δ-2/-3 double knockout and control; brain/body ratio: F(3,11) = 11.5, p = 0.001, posthoc: ***p = 0.001 between α2δ-2/-3 double knockout and control, **p = 0.002 between α2δ-2/-3 double knockout and α2δ-3 single knockout, *p = 0.012 between α2δ-2/-3 double knockout and α2δ-2 single knockout. Symbols in graphs indicate significance levels of factor genotype within (*), or factor age (#): p < 0.07, */#p < 0.05, **p < 0.01, ***/###p < 0.001.
Figure 3
Figure 3
General histologic examination of Nissl-stained brain sections does not reveal major morphological abnormalities. Representative micrographs of Nissl-stained sagittal cryosections obtained from adult (8–13-weeks-old; A,B) and juvenile (3–4-weeks-old; C,D) mouse brains. The cerebellum and hippocampus of ducky (A), α2δ-1/-3 (B), α2δ-1/-2 (C), α2δ-2/-3 (D) double knockout mice showed no overt anatomical defects compared to control mice. Scale bars, 400 μm (Cerebellum), and 200 μm (Hippocampus).
Figure 4
Figure 4
Volumes of distinct brain regions are decreased in adult ducky and α2δ double knockout mice. Representative micrographs of Nissl-stained sagittal cryosections obtained from adult (8–13-weeks-old; A,B) and juvenile (3–4-week-old; C,D) mice. Consecutive slides were used for volume quantification of specific brain regions by applying the Cavalieri principle. Data from three mice per genotype were averaged and bar graphs depict means of respective knockout mice ± SEM, calculated as percentage reduction to corresponding controls (indicated with numbers in bars). Dashed lines in micrographs illustrate significantly decreased brain areas in knockout mice (right picture of each panel) compared to respective controls (left picture of each panel). (A) Ducky mice showed a generally reduced volume of all analyzed brain regions, with neocortical size being significantly decreased by 34%. (B) While the majority of analyzed structures were only slightly affected in α2δ-1/-3 double knockout mice, a specific volume reduction of 24% was found in the corpus callosum. (C) Brain regions of α2δ-1/-2 double knockout mice were not significantly different from control animals which already lacked α2δ-1. However, additional knockout of α2δ-2 caused an obvious trend towards reduced volumes of the cerebellum (37%), whole hemisphere (27%), and neocortex (21%). (D) α2δ-2/-3 double knockout mice showed a drastic volume reduction of all analyzed brain regions ranging from 22 to 40%. The highly significant decrease of the cerebellum, whole hemisphere, and neocortex was similar to the one found in α2δ-1/-2 double knockout mice. Furthermore, the size of the corpus callosum was significantly reduced by 29%. Confer Supplementary Table 2 for raw data of individual mice and respective genotypes. Abbreviations: Cb, cerebellum, Cc, corpus callosum, He, whole hemisphere, Hc, hippocampus, Nx, neocortex. Statistics: unpaired t-test with Holm–Sidak correction for multiplicity (for p-values see Supplementary Table 2). Symbols in graphs indicate corrected significance levels compared to control: p < 0.06; *p < 0.05; **p < 0.01; ***p < 0.001. Scale bars, 1 mm.
Figure 5
Figure 5
Adult ducky mice display a reduced thickness of cortical layers and increased cell densities. (A–C) Representative micrographs of mid-sagittal cryosections obtained from adult (8–13-weeks-old) wildtype and α2δ-2 mutant (ducky) mouse brains (A). Slides were counterstained with the nuclear marker Höchst to analyze anterior-posterior length (yellow arrow and quantification in panel (B) and thickness (C) of the somatosensory cortex, which were both significantly decreased in ducky mice. Two (B) and three (C) mice per genotype were analyzed and bar graphs depict means of mice ± SEM. Statistics: unpaired t-test: (B) t(2):6.9, p = 0.02; (C) t(4):4.8, p = 0.009. Representative micrographs of triple immunofluorescence labelings of consecutive sagittal sections with layer-specific markers Ctip2 (red; layer V), Cux1 (green; layer II–IV) or Tbr1 (green; layer VI) and Höchst (blue) at the level of somatosensory cortex (see the boxed region in A), showing that cortical lamination is preserved in adult ducky mice (D,E). Quantification of the laminar thickness (F), total cell density (G), and percentage of marker positive neurons of total cells (H). The thickness of individual layers was reduced in ducky mice when compared to wild-type controls, the most affected being layer V (F, 23%). This effect was accompanied by a 2.5-fold increase in nuclear cell density (G) while the proportion of cells expressing individual markers remained unaffected (H). Two mice per genotype were analyzed and bar graphs depict means of mice ± SEM. Statistics: (F) Two-way RM ANOVA with Holm–Sidak posthoc analysis: genotype: F(1,6) = 17.9, p = 0.05, layer: F(3,6) = 150.5, p < 0.001, genotype x layer: F(3,6) = 1.4, p = 0.34, posthoc: **p < 0.001 between ducky and wildtype within layer 5; (G) unpaired t-test: t2:5.0, p = 0.038; (H) Two-way RM ANOVA with Holm–Sidak posthoc analysis: genotype: F(1,6) = 0.6, p = 0.5, marker: F(3,6) = 26.3, p < 0.001, genotype x marker: F(3,6) = 1.2, p = 0.39. Symbols in graphs indicate significance levels: *p < 0.05; **p < 0.01. Scale bars, 1 mm (A,B) and 100 μm (D,E).
Figure 6
Figure 6
Juvenile ducky mice display altered cortical cytoarchitecture. (A–C) Representative micrographs of mid-sagittal cryosections obtained from juvenile (3-weeks-old) wildtype and α2δ-2 mutant (ducky) mouse brains (A). Slides were counterstained with the nuclear marker Höchst to analyze anterior-posterior length (yellow arrow and quantification in panel B) and thickness (C) of the somatosensory cortex. Both cortex length and cortical thickness of ducky mice did not significantly differ compared to wildtypes. Four mice per genotype were analyzed and bar graphs depict means of mice ± SEM. Statistics: unpaired t-test: (B) t6: 2.3, p = 0.06; (C) t(6): 1.1, p = 0.33. Representative micrographs of triple immunofluorescence labelings of consecutive sagittal sections with layer-specific markers Ctip2 (red; layer V), Cux1 (green; layer II–IV) or Tbr1 (green; layer VI) and Höchst (blue) at the level of somatosensory cortex (see the boxed region in A), indicating lamination is preserved in juvenile ducky mice (D,E). However, further quantitative analysis of laminar thickness (F), total cell density (G), and percentage of marker positive neurons of total cells (H) revealed a significant increase of layer VI in juvenile ducky mice (F, 25%) without apparent effects on total cell density (G) or proportion of marker positive cells (H). Four mice per genotype were analyzed and bar graphs depict means of mice ± SEM. Statistics: (F) two-way RM ANOVA with Holm–Sidak posthoc analysis: genotype: F(1,18) = 0.17, p = 0.7, layer: F(3,18) = 124.7, p < 0.001, genotype × layer: F(3,18) = 2.5, p = 0.095, posthoc: *p < 0.05 between ducky and wildtype within layer 6; (G) unpaired t-test: t(6): 5.0, p = 0.65; (H) two-way RM ANOVA with Holm–Sidak post hoc analysis: genotype: F(1,18) = 0.83, p = 0.4, marker: F(3,18) = 21.6, p < 0.001, genotype × marker: F(3,18) = 0.87, p = 0.48. Symbols in graphs indicate significance levels: *p < 0.05. Scale bars, 1 mm (A,B) and 100 μm (D,E).

Similar articles

Cited by

References

    1. Abdurakhmanova S., Chary K., Kettunen M., Sierra A., Panula P. (2017). Behavioral and stereological characterization of Hdc KO mice: relation to Tourette syndrome. J. Comp. Neurol. 525, 3476–3487. 10.1002/cne.24279 - DOI - PubMed
    1. Ablinger C., Geisler S. M., Stanika R. I., Klein C. T., Obermair G. J. (2020). Neuronal α2δ proteins and brain disorders. Pflugers Arch. 472, 845–863. 10.1007/s00424-020-02420-2 - DOI - PMC - PubMed
    1. Arikkath J., Campbell K. P. (2003). Auxiliary subunits: essential components of the voltage-gated calcium channel complex. Curr. Opin. Neurobiol. 13, 298–307. 10.1016/s0959-4388(03)00066-7 - DOI - PubMed
    1. Arlotta P., Molyneaux B. J., Chen J., Inoue J., Kominami R., Macklis J. D. (2005). Neuronal subtype-specific genes that control corticospinal motor neuron development in vivo. Neuron 45, 207–221. 10.1016/j.neuron.2004.12.036 - DOI - PubMed
    1. Barclay J., Balaguero N., Mione M., Ackerman S. L., Letts V. A., Brodbeck J., et al. . (2001). Ducky mouse phenotype of epilepsy and ataxia is associated with mutations in the Cacna2d2 gene and decreased calcium channel current in cerebellar Purkinje cells. J. Neurosci. 21, 6095–6104. 10.1523/JNEUROSCI.21-16-06095.2001 - DOI - PMC - PubMed

LinkOut - more resources