

Pan-Cancer Analysis and Drug Formulation for GPR139 and GPR142
- PMID: 33679382
- PMCID: PMC7933564
- DOI: 10.3389/fphar.2020.521245
Pan-Cancer Analysis and Drug Formulation for GPR139 and GPR142
Abstract
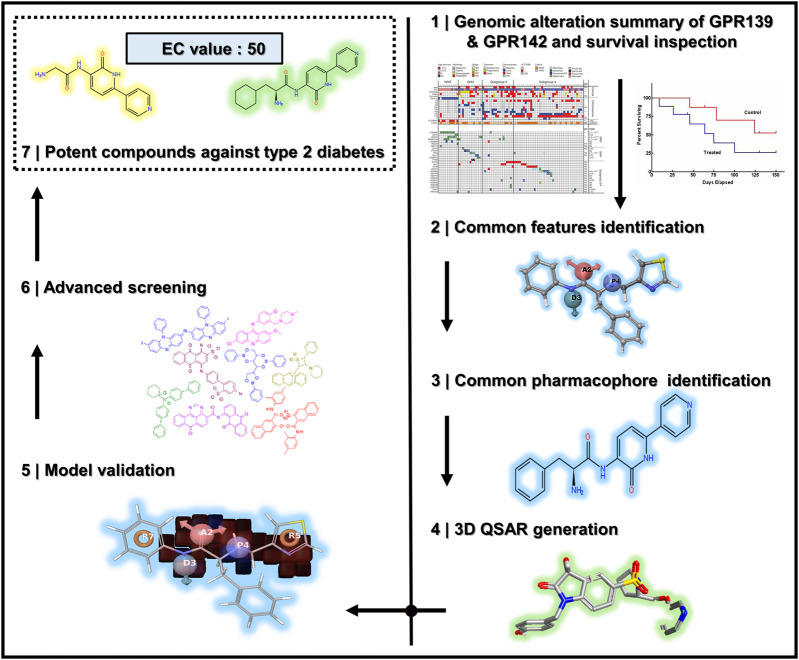
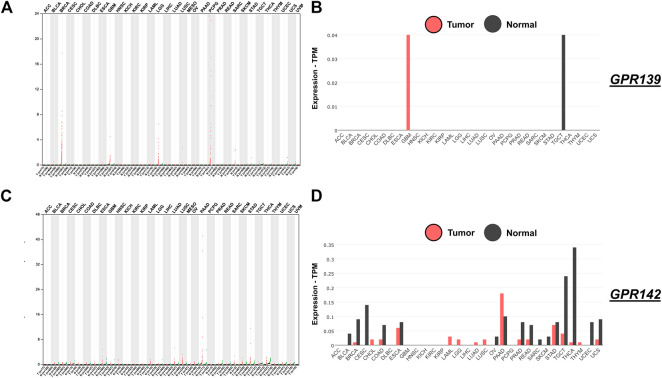
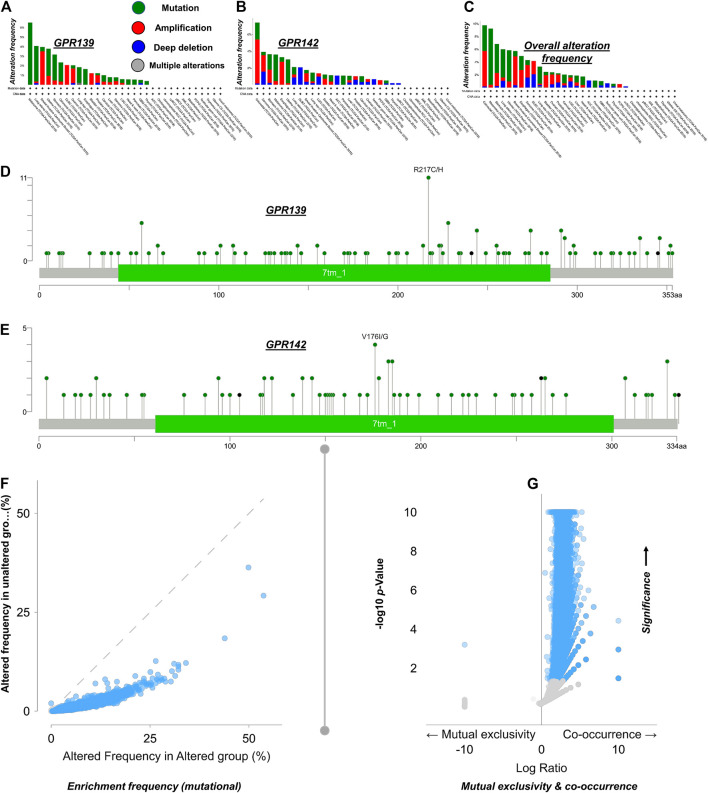
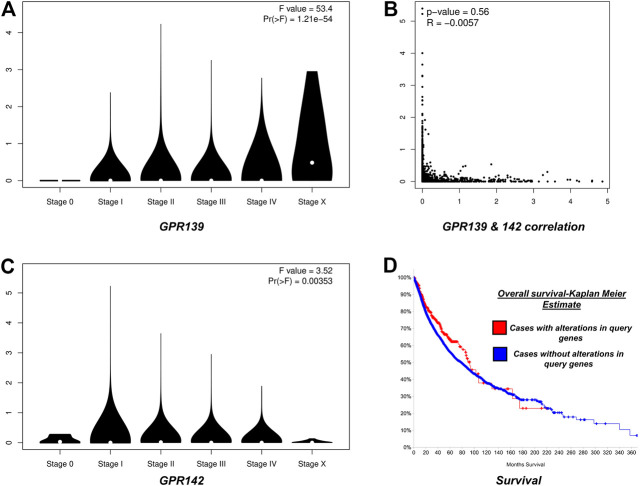
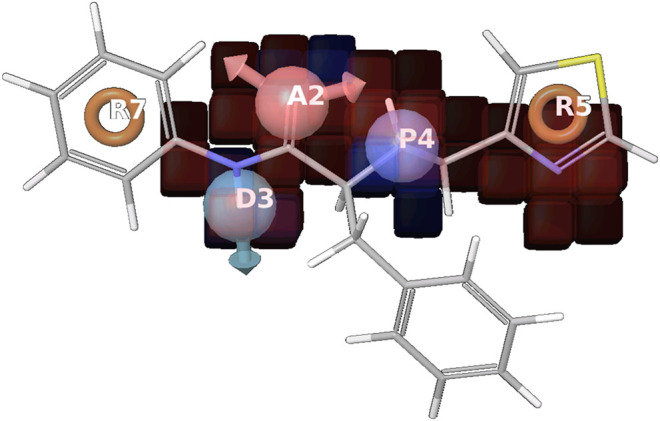
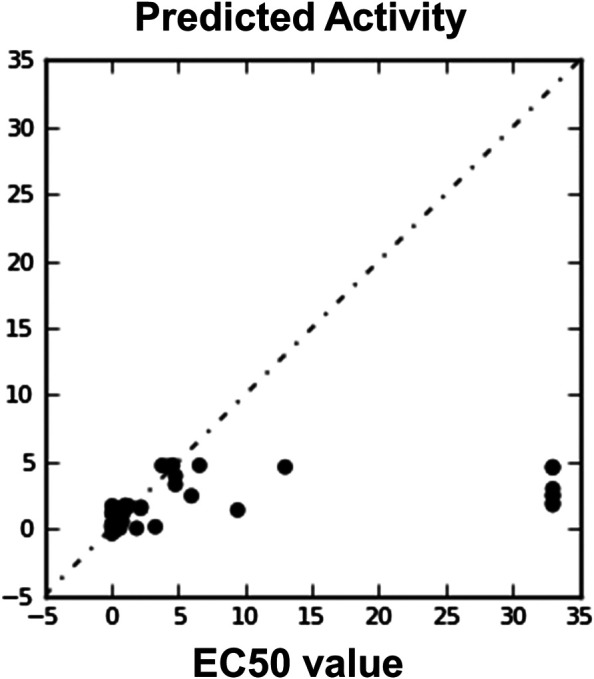
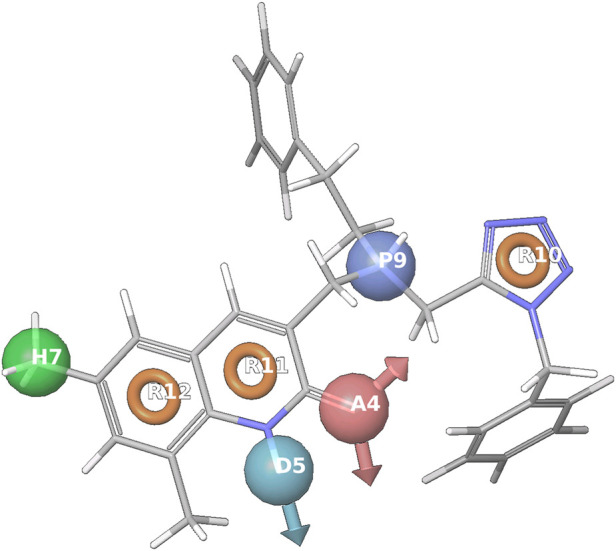
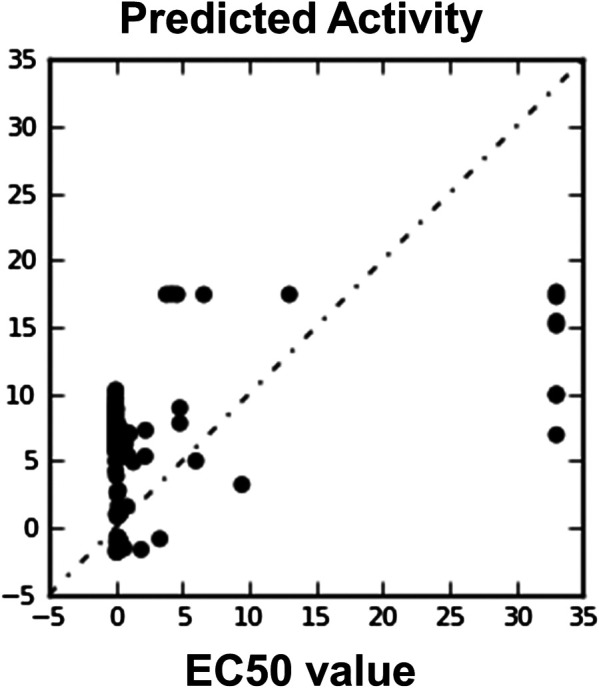
GPR (G protein receptor) 139 and 142 are novel foundling GPCRs (G protein-coupled receptors) in the class "A" of the GPCRs family and are suitable targets for various biological conditions. To engage these targets, validated pharmacophores and 3D QSAR (Quantitative structure-activity relationship) models are widely used because of their direct fingerprinting capability of the target and an overall accuracy. The current work initially analyzes GPR139 and GPR142 for its genomic alteration via tumor samples. Next to that, the pharmacophore is developed to scan the 3D database for such compounds that can lead to potential agonists. As a result, several compounds have been considered, showing satisfactory performance and a strong association with the target. Additionally, it is gripping to know that the obtained compounds were observed to be responsible for triggering pan-cancer. This suggests the possible role of novel GPR139 and GPR142 as the substances for initiating a physiological response to handle the condition incurred as a result of cancer.
Keywords: 3D quantitative structure-activity relationship; 7TM; GPR142; molecular modeling; pan-cancer; pharmacophore; the cancer genome atlas.
Copyright © 2021 Kaushik, Mehmood, Dai and Wei.
Conflict of interest statement
The authors declare that the research was conducted in the absence of any commercial or financial relationships that could be construed as a potential conflict of interest.
Figures
Similar articles
-
Characterisation and differential expression of two very closely related G-protein-coupled receptors, GPR139 and GPR142, in mouse tissue and during mouse development.Neuropharmacology. 2006 Mar;50(4):512-20. doi: 10.1016/j.neuropharm.2005.11.003. Epub 2005 Dec 27. Neuropharmacology. 2006. PMID: 16378626
-
Structure Based Virtual Screening Studies to Identify Novel Potential Compounds for GPR142 and Their Relative Dynamic Analysis for Study of Type 2 Diabetes.Front Chem. 2018 Feb 14;6:23. doi: 10.3389/fchem.2018.00023. eCollection 2018. Front Chem. 2018. PMID: 29492402 Free PMC article.
-
Insights into unbound-bound states of GPR142 receptor in a membrane-aqueous system using molecular dynamics simulations.J Biomol Struct Dyn. 2018 May;36(7):1788-1805. doi: 10.1080/07391102.2017.1335234. Epub 2017 Jun 22. J Biomol Struct Dyn. 2018. PMID: 28571491
-
Drug design strategies for targeting G-protein-coupled receptors.Chembiochem. 2002 Oct 4;3(10):928-44. doi: 10.1002/1439-7633(20021004)3:10<928::AID-CBIC928>3.0.CO;2-5. Chembiochem. 2002. PMID: 12362358 Review.
-
Neuronal nicotinic acetylcholine receptor agonists: pharmacophores, evolutionary QSAR and 3D-QSAR models.Curr Top Med Chem. 2004;4(3):335-60. doi: 10.2174/1568026043451384. Curr Top Med Chem. 2004. PMID: 14754450 Review.
Cited by
-
Therapeutic and prognostic potential of GPCRs in prostate cancer from multi-omics landscape.Front Pharmacol. 2022 Aug 30;13:997664. doi: 10.3389/fphar.2022.997664. eCollection 2022. Front Pharmacol. 2022. PMID: 36110544 Free PMC article.
-
Evidence of Omics, Immune Infiltration, and Pharmacogenomic for SENP1 in the Pan-Cancer Cohort.Front Pharmacol. 2021 Jul 1;12:700454. doi: 10.3389/fphar.2021.700454. eCollection 2021. Front Pharmacol. 2021. PMID: 34276383 Free PMC article.
-
Multiomics dynamic learning enables personalized diagnosis and prognosis for pancancer and cancer subtypes.Brief Bioinform. 2023 Sep 22;24(6):bbad378. doi: 10.1093/bib/bbad378. Brief Bioinform. 2023. PMID: 37889117 Free PMC article.
-
GPR139, an Ancient Receptor and an Emerging Target for Neuropsychiatric and Behavioral Disorders.Mol Neurobiol. 2025 Jul;62(7):9324-9337. doi: 10.1007/s12035-025-04828-2. Epub 2025 Mar 18. Mol Neurobiol. 2025. PMID: 40102345 Free PMC article. Review.
-
Pan-cancer analysis shapes the understanding of cancer biology and medicine.Cancer Commun (Lond). 2025 Jul;45(7):728-746. doi: 10.1002/cac2.70008. Epub 2025 Mar 22. Cancer Commun (Lond). 2025. PMID: 40120098 Free PMC article. Review.
References
-
- Bhachoo J., Beuming T. (2017). “Investigating protein-peptide interactions using the schrödinger computational suite, Methods molecular biology, Modeling peptide-protein interactions, Editors Schueler-Furman O., London N. New York, NY: Humana Press, Vol. 1561, 235–254. 10.1007/978-1-4939-6798-8_14 - DOI - PubMed
LinkOut - more resources
Full Text Sources
Other Literature Sources
Research Materials