. 2021 Feb 17:12:637136.
doi: 10.3389/fphys.2021.637136. eCollection 2021.

Multiscale and Multimodal Optical Imaging of the Ultrastructure of Human Liver Biopsies

Affiliations

Multiscale and Multimodal Optical Imaging of the Ultrastructure of Human Liver Biopsies

Cihang Kong et al. Front Physiol. .

Abstract

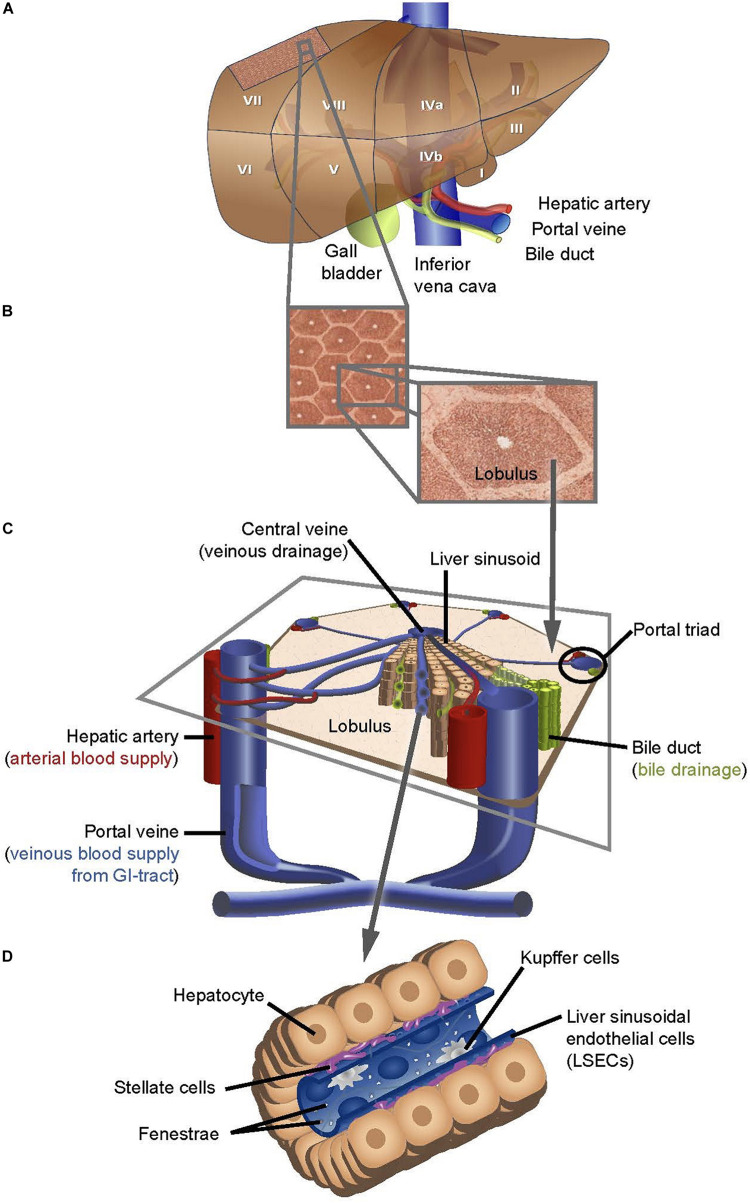
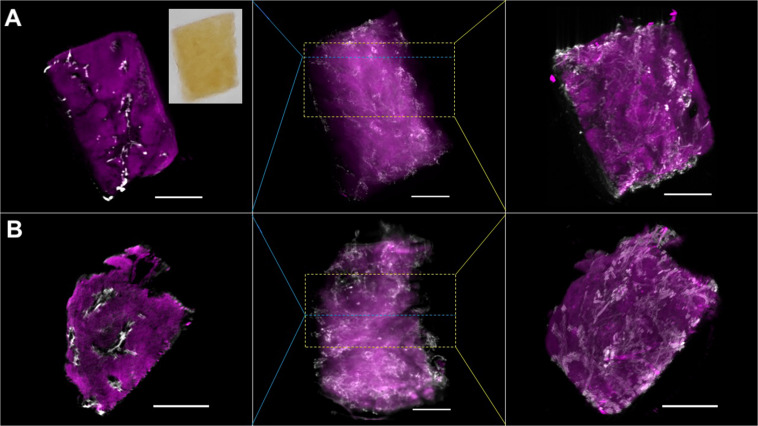
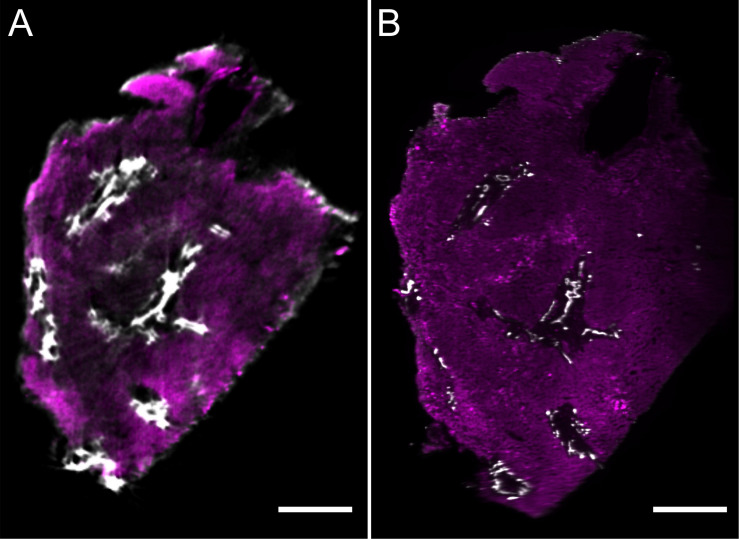
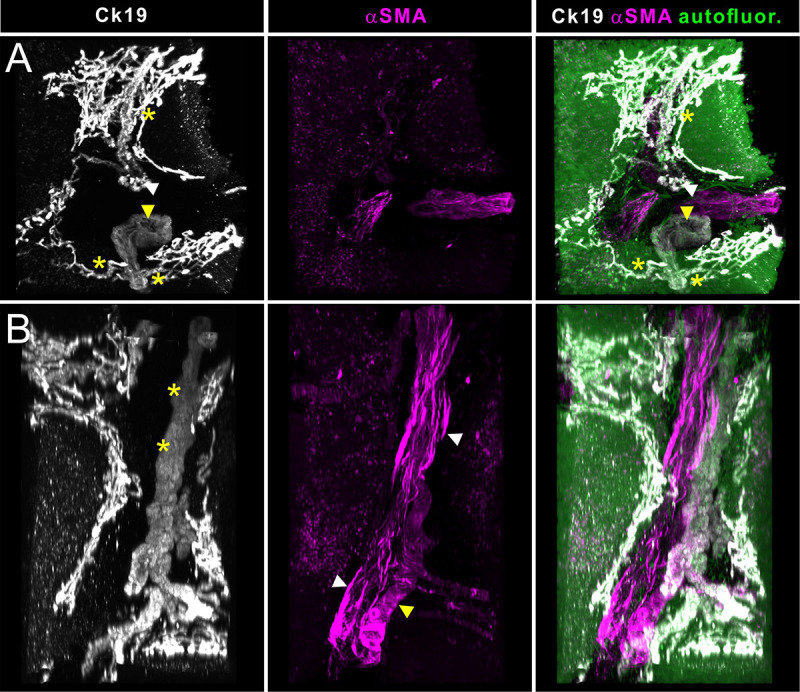
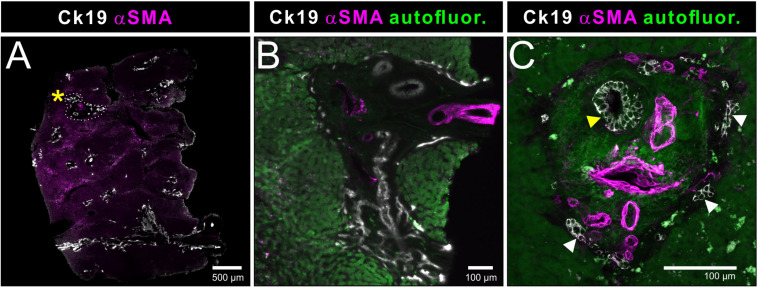
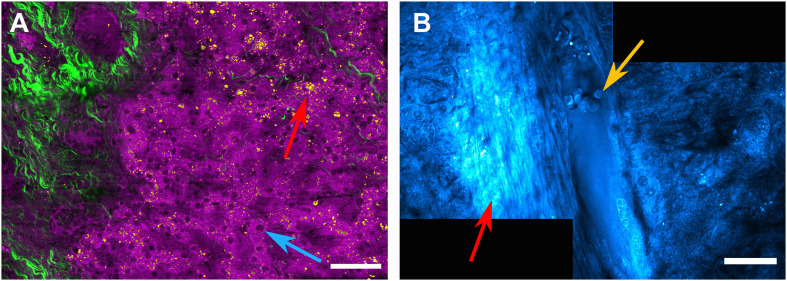
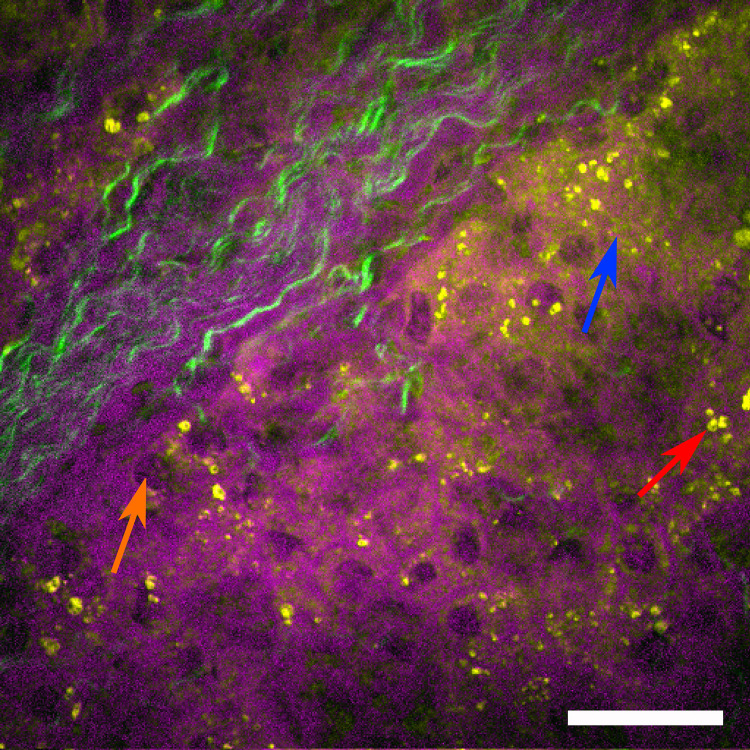
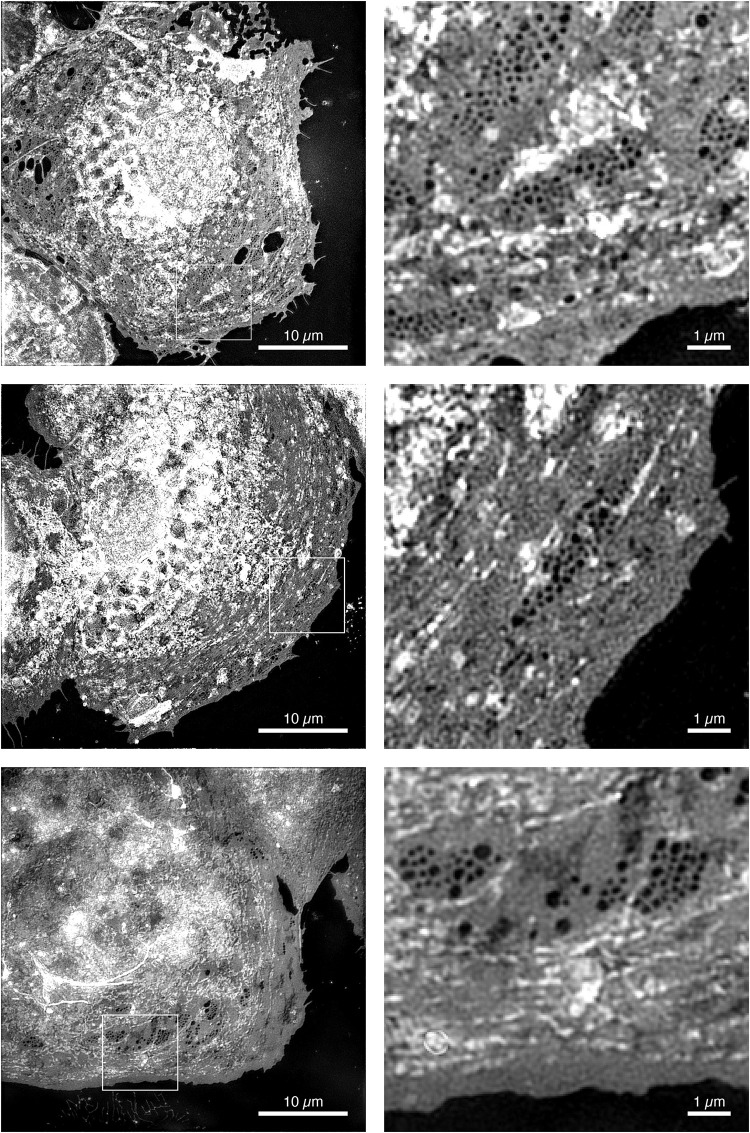
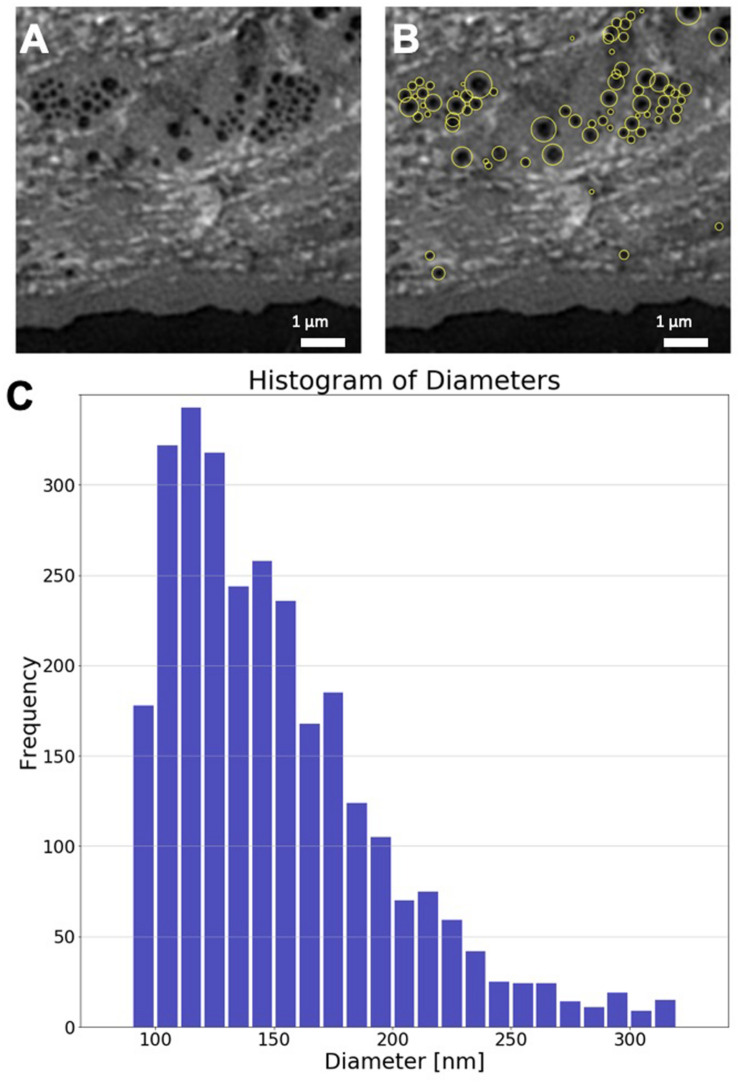
The liver as the largest organ in the human body is composed of a complex macroscopic and microscopic architecture that supports its indispensable function to maintain physiological homeostasis. Optical imaging of the human liver is particularly challenging because of the need to cover length scales across 7 orders of magnitude (from the centimeter scale to the nanometer scale) in order to fully assess the ultrastructure of the entire organ down to the subcellular scale and probe its physiological function. This task becomes even more challenging the deeper within the organ one hopes to image, because of the strong absorption and scattering of visible light by the liver. Here, we demonstrate how optical imaging methods utilizing highly specific fluorescent labels, as well as label-free optical methods can seamlessly cover this entire size range in excised, fixed human liver tissue and we exemplify this by reconstructing the biliary tree in three-dimensional space. Imaging of tissue beyond approximately 0.5 mm length requires optical clearing of the human liver. We present the successful use of optical projection tomography and light-sheet fluorescence microscopy to derive information about the liver architecture on the millimeter scale. The intermediate size range is covered using label-free structural and chemically sensitive methods, such as second harmonic generation and coherent anti-Stokes Raman scattering microscopy. Laser-scanning confocal microscopy extends the resolution to the nanoscale, allowing us to ultimately image individual liver sinusoidal endothelial cells and their fenestrations by super-resolution structured illumination microscopy. This allowed us to visualize the human hepatobiliary system in 3D down to the cellular level, which indicates that reticular biliary networks communicate with portal bile ducts via single or a few ductuli. Non-linear optical microscopy enabled us to identify fibrotic regions extending from the portal field to the parenchyma, along with microvesicular steatosis in liver biopsies from an older patient. Lastly, super-resolution microscopy allowed us to visualize and determine the size distribution of fenestrations in human liver sinusoidal endothelial cells for the first time under aqueous conditions. Thus, this proof-of-concept study allows us to demonstrate, how, in combination, these techniques open up a new chapter in liver biopsy analysis.

Keywords: coherent Raman scattering microscopy; light-sheet fluorescence microscopy; liver biology; liver morphology; liver sinusoidal endothelial cells.; liver sinusoids; super-resolution optical microscopy.


Conflict of interest statement

The authors declare that the research was conducted in the absence of any commercial or financial relationships that could be construed as a potential conflict of interest.

Figures

FIGURE 1
FIGURE 1
Schematic depiction of the structure of the human liver at different scales of resolution. (A) Traditional segmentation used in anatomy and surgery, subdivides the human liver into eight segments. (B) Each segment is composed of numerous liver lobules that are packed in a honeycomb pattern (B. left panel) and individual lobules are separated by bands rich in extracellular matrix (B. right panel). (C) Every tripartite junction between liver lobules forms a portal field, composedof a venous vessel originating from a branch of the portal vein, an arterial vessel originating from the hepatic artery and one or more bile ducts. The basic functional unit of the liver is comprised of a central sinusoid flanked by trabeculae of hepatocytes that enclose with their apical membrane a primary bile canaliculus, finally draining into the bile duct in the portal triad. All sinusoids of a lobule drain into a single central venous vessel. (D) The distance between the fenestrated endothelial cells that form the sinusoids and the hepatocyte canaliculi is referred to as Space of Disse and contains stellate cells, while Kupffer cells patrol within the endothelial lumen.
FIGURE 2
FIGURE 2
Optical projection tomographs (OPT) of the human liver. (A) and (B) are two different liver biopsies obtained from the same patient, each covering a volume of approximately 3 mm × 3 mm × 5 mm. The images in the center column panels are projections of the fluorescence from the entire sample. The images in the left panels show single cross sections that were taken at the regions indicated by the blue dashed lines in each row. The images in the right panels are projections of a stack of cross sections, the extent of which is indicated by the yellow dashed box. The specimen were stained with antibodies against a smooth muscle actin identifying smooth muscle cells (magenta, indicated by arrowheads in the individual panels) and cytokeratin 19 identifying bile ducts (white, indicated by asterisks in the panels) and subsequently cleared following the BABB protocol. The inset in the upper left panel shows a photograph of the optically cleared liver sample in BABB. Scale bars are 1 mm.
FIGURE 3
FIGURE 3
Comparison of liver volumes imaged by optical projection tomography (A) and light sheet microscopy (B). Optical sections of the same wholemount immunostained liver biopsy (for antibodies and colors also see Figures 2, 4) were acquired with both optical projection tomography (A) and light sheet microscopy (B). Image stacks were visualized using the volume rendering software package Voreen. Subsequently, rendered volumes were digitally oriented such that the sectional planes were approximately matching and virtually isolated, thin optical section corresponding to 9.6 μm (A) and 5 μm (B) are shown for direct comparison. Arrowheads identify corresponding structures. Scale bars represent 500 μm.
FIGURE 4
FIGURE 4
Light sheet fluorescence microscopic analysis of human liver biopsies. Whole mount human liver biopsies stained for smooth muscle actin (magenta) and cytokeratin 19 (white) – identical specimen as depicted in Figures 2, 3. Tissue autofluoresence (green) provided anatomical landmarks. Shown are maximum intensity projections of a tissue volume of approx. 1500 μm × 1300 μm × 800 μm. (A) Cross sectional aspect of a hepatic portal field. Besides the supplying blood vessels, shown in magenta in the central panel (likely parts of the portal venous connection), a smaller (white arrowhead) and a larger bile duct (yellow arrowhead) and the reticular network formed by their upstream smallest bile ductuli (Ducts of Hering). Communicating ducts between this reticular networks and the portal ducts are marked by asterisks. (B) Volume rendering showing a longitudinal aspect of the vasculature and bile ducts running in a portal field. Note the presence of two supplying blood vessels, which show distinct differences in the orientation of the smooth muscle cells in the vessel wall (central panel, magenta). Longitudinally running smooth muscle cells identify branches of the venous vasculature (white arrowheads), while a circumferential orientation of the smooth muscle cells is indicative of arterial vessels (yellow arrowheads). Cytokeratin staining is gradually downregulated in the more differentiated cholangiocytes of the larger caliber bile ducts (asterisk).
FIGURE 5
FIGURE 5
Light sheet and confocal imaging of two representative human liver portal fields. (A) Light sheet microscopic overview of an immunostained human liver biopsy, in which specific structures of interest, here a prototypic portal field, are easily identified (encircled area next to asterisk). (B) Magnification of the cross section of one portal field from the rendered volume shown in (A). (C) Confocal image of a portal field from a 100 μm section identically stained to the specimen depicted in Figures 2, 4. Note the size difference of the cholangiocytes between the smallest bile ducts (white arrowheads) and the larger duct but also within the section of the larger bile duct (yellow arrowhead).
FIGURE 6
FIGURE 6
Non-linear optical confocal microscopy of human liver biopsies. (A) CARS image probing the 2845cm– 1 lipid resonance. By signal thresholding, weak background signals depicting single hepatocytes and their nuclei (blue arrow) are shown in magenta and can be separated from lipid droplets, which provide signal above the threshold value (red arrow), shown in yellow. The green color depicts parts of the sample producing a SHG signal, which was acquired subsequently utilizing a femtosecond fiber-laser source. SHG indicates fibrous structures within the liver tissue. Scale bar is 50 μm - note that several images are stitched together to obtain a larger field of view. (B) CARS image (at 2845cm– 1) of a portal vein with erythrocytes attached to the lumen (yellow arrow). In the vicinity of the vein, fibrotic alterations of the tissue can be seen (red arrow). Scale bar is 30 μm.
FIGURE 7
FIGURE 7
Hyperspectral SRS image of human liver biopsy. Hyperspectral SRS image probing the molecular resonances from 2790 to 3020 cm– 1 (utilizing spectral fitting for every pixel, where amplitude values of the peaks at 2845 cm– 1 (indicating lipids) are shown in yellow and at 2920 cm– 1 (indicating proteins) are shown in magenta. Single hepatocytes as indicated by their nuclei (orange arrow), sinusoids as well as lipid droplets (red arrow) can be identified. The green color channel shows the SHG signal indicating fibrotic tissue, which extends from the portal tract into the liver parenchyma. The parenchyma shows microvesicular steatosis (highlighted by a blue arrow). Scale bar is 30 μm.
FIGURE 8
FIGURE 8
Super-resolution structured illumination micrographs of human LSECs. Super-resolution structured illumination microscopy images of 3 different human liver sinusoidal endothelial cells. The cells were stained with the membrane dye CellMask Orange, which allows the visualization of fenestrae as dark holes. The first column shows images with a full field-of-view of 40 μm for each cell. The second column shows magnified views of the white outlined boxes in the images to the left typically displaying one or more sieve plates.
FIGURE 9
FIGURE 9
Analysis of hLSEC fenestration diameters. (A) Region of interest of an SR-SIM image depicting several sieve plates in the plasma membrane of hLSEC. (B) The same image as shown in (A), where fenestrae that were automatically identified and sized are highlighted by yellow circles, where the circle diameter corresponds to double the diameter identified for each fenestra. (C) Size distribution histogram of 4471 fenestrae identified in 21 regions of interest taken from 5 hLSECs.

Similar articles

Cited by

References

    1. Braet F., Wisse E. (2002). Structural and functional aspects of liver sinusoidal endothelial cell fenestrae: a review. Comp. Hepatol 17:1. 10.1007/s00795-007-0390-7 - DOI - PMC - PubMed
    1. Cheng J.-X., Xie X. S. (2015). Vibrational spectroscopic imaging of living systems: An emerging platform for biology and medicine. Science 350:8870. 10.1126/science.aaa8870 - DOI - PubMed
    1. Cogger V. C., McNerney G. P., Nyunt T., DeLeve L. D., McCourt P., Smedsrød B., et al. (2010). Three-dimensional structured illumination microscopy of liver sinusoidal endothelial cell fenestrations. J. Struct. Biol. 171 382–388. 10.1016/j.jsb.2010.06.001 - DOI - PMC - PubMed
    1. Costantini I., Cicchi R., Silvestri L., Vanzi F., Pavone F. S. (2019). In-vivo and ex-vivo optical clearing methods for biological tissues: review. Biomed. Opt. Express 10 5251–5267. 10.1364/BOE.10.005251 - DOI - PMC - PubMed
    1. Couteur D. G. L., Warren A., Cogger V. C., Smedsrød B., Sørensen K. K., Cabo R. D., et al. (2008). Old age and the hepatic sinusoid. Anat. Rec. 291 672–683. 10.1002/ar.20661 - DOI - PubMed

LinkOut - more resources