

Disrupted Regional Homogeneity in Melancholic and Non-melancholic Major Depressive Disorder at Rest
- PMID: 33679477
- PMCID: PMC7928375
- DOI: 10.3389/fpsyt.2021.618805
Disrupted Regional Homogeneity in Melancholic and Non-melancholic Major Depressive Disorder at Rest
Abstract
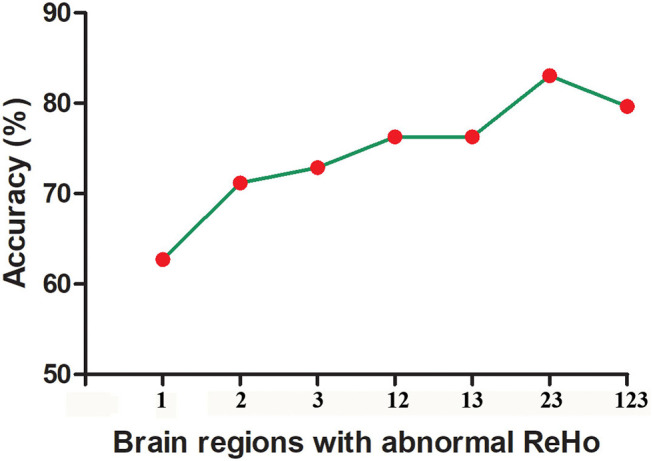
Background: Melancholic depression has been viewed as one severe subtype of major depressive disorder (MDD). However, it is unclear whether melancholic depression has distinct changes in brain imaging. We aimed to explore specific or distinctive alterations in melancholic MDD and whether the alterations could be used to separate melancholic MDD from non-melancholic MDD or healthy controls. Materials and Methods: Thirty-one outpatients with melancholic MDD and thirty-three outpatients with non-melancholic MDD and thirty-two age- and gender-matched healthy controls were recruited. All participants were scanned by resting-state functional magnetic resonance imaging (fMRI). Imaging data were analyzed with the regional homogeneity (ReHo) and support vector machine (SVM) methods. Results: Melancholic MDD patients exhibited lower ReHo in the right superior occipital gyrus/middle occipital gyrus than non-melancholic MDD patients and healthy controls. Merely for non-melancholic MDD patients, decreased ReHo in the right middle frontal gyrus was negatively correlated with the total HRSD-17 scores. SVM analysis results showed that a combination of abnormal ReHo in the right fusiform gyrus/cerebellum Crus I and the right superior occipital gyrus/middle occipital gyrus exhibited the highest accuracy of 83.05% (49/59), with a sensitivity of 90.32% (28/31), and a specificity of 75.00% (21/28) for discriminating patients with melancholic MDD from patients with non-melancholic MDD. And a combination of abnormal ReHo in the right fusiform gyrus/cerebellum VI and left postcentral gyrus/precentral gyrus exhibited the highest accuracy of 98.41% (62/63), with a sensitivity of 96.77% (30/31), and a specificity of 100.00%(32/32) for separating patients with melancholic MDD from healthy controls. Conclusion: Our findings showed the distinctive ReHo pattern in patients with melancholic MDD and found brain area that may be associated with the pathophysiology of non-melancholic MDD. Potential imaging markers for discriminating melancholic MDD from non-melancholic MDD or healthy controls were reported.
Keywords: magnetic resonance imaging; melancholic depression; non-melancholic depression; regional homogeneity; resting state.
Copyright © 2021 Yan, He, Cui, Liu, Li, Huang, Tang, Chen, Zhao, Xie and Guo.
Conflict of interest statement
The authors declare that the research was conducted in the absence of any commercial or financial relationships that could be construed as a potential conflict of interest.
Figures


Similar articles
-
Abnormal Default-Mode Network Homogeneity in Melancholic and Nonmelancholic Major Depressive Disorder at Rest.Neural Plast. 2021 Apr 26;2021:6653309. doi: 10.1155/2021/6653309. eCollection 2021. Neural Plast. 2021. PMID: 33995525 Free PMC article.
-
Altered resting-state brain activity in patients with major depression disorder and bipolar disorder: A regional homogeneity analysis.J Affect Disord. 2025 Jun 15;379:313-322. doi: 10.1016/j.jad.2025.03.057. Epub 2025 Mar 11. J Affect Disord. 2025. PMID: 40081596
-
Shared and distinct homotopic connectivity changes in melancholic and non-melancholic depression.J Affect Disord. 2021 May 15;287:268-275. doi: 10.1016/j.jad.2021.03.038. Epub 2021 Mar 19. J Affect Disord. 2021. PMID: 33799047
-
Resting-state functional magnetic resonance imaging and support vector machines for the diagnosis of major depressive disorder in adolescents.World J Psychiatry. 2024 Nov 19;14(11):1696-1707. doi: 10.5498/wjp.v14.i11.1696. eCollection 2024 Nov 19. World J Psychiatry. 2024. PMID: 39564181 Free PMC article. Review.
-
Electroencephalographic Parameters Differentiating Melancholic Depression, Non-melancholic Depression, and Healthy Controls. A Systematic Review.Front Psychiatry. 2021 Aug 19;12:648713. doi: 10.3389/fpsyt.2021.648713. eCollection 2021. Front Psychiatry. 2021. PMID: 34489747 Free PMC article.
Cited by
-
The Bilateral Precuneus as a Potential Neuroimaging Biomarker for Right Temporal Lobe Epilepsy: A Support Vector Machine Analysis.Front Psychiatry. 2022 Jun 15;13:923583. doi: 10.3389/fpsyt.2022.923583. eCollection 2022. Front Psychiatry. 2022. PMID: 35782449 Free PMC article.
-
Causal Association Between Major Depressive Disorder and Cortical Structure: A Bidirectional Mendelian Randomization Study and Mediation Analysis.CNS Neurosci Ther. 2025 Mar;31(3):e70319. doi: 10.1111/cns.70319. CNS Neurosci Ther. 2025. PMID: 40059068 Free PMC article.
-
Altered brain regional homogeneity is associated with depressive symptoms in COVID-19.J Affect Disord. 2022 Sep 15;313:36-42. doi: 10.1016/j.jad.2022.06.061. Epub 2022 Jun 25. J Affect Disord. 2022. PMID: 35764231 Free PMC article.
-
The classification of brain network for major depressive disorder patients based on deep graph convolutional neural network.Front Hum Neurosci. 2023 Jan 26;17:1094592. doi: 10.3389/fnhum.2023.1094592. eCollection 2023. Front Hum Neurosci. 2023. PMID: 36778038 Free PMC article.
-
Sex Differences of the Functional Brain Activity in Treatment-Resistant Depression: A Resting-State Functional Magnetic Resonance Study.Brain Sci. 2022 Nov 23;12(12):1604. doi: 10.3390/brainsci12121604. Brain Sci. 2022. PMID: 36552064 Free PMC article.
References
-
- American Psychiatric Association . DSM-IV: Diagnostic and Statistical Manual of Mental Disorders 4th ed. Washington, DC: Am Psychiatric Assoc Press; (1994).
LinkOut - more resources
Full Text Sources
Other Literature Sources