Review
. 2021 Feb 18:12:620852.
doi: 10.3389/fneur.2021.620852. eCollection 2021.

Skeletal Muscle in Cerebral Palsy: From Belly to Myofibril

Affiliations
Review

Skeletal Muscle in Cerebral Palsy: From Belly to Myofibril

Jason J Howard et al. Front Neurol. .

Abstract

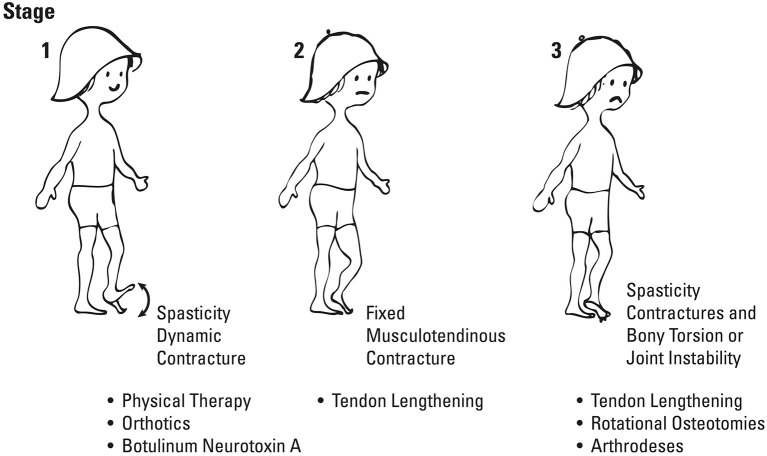
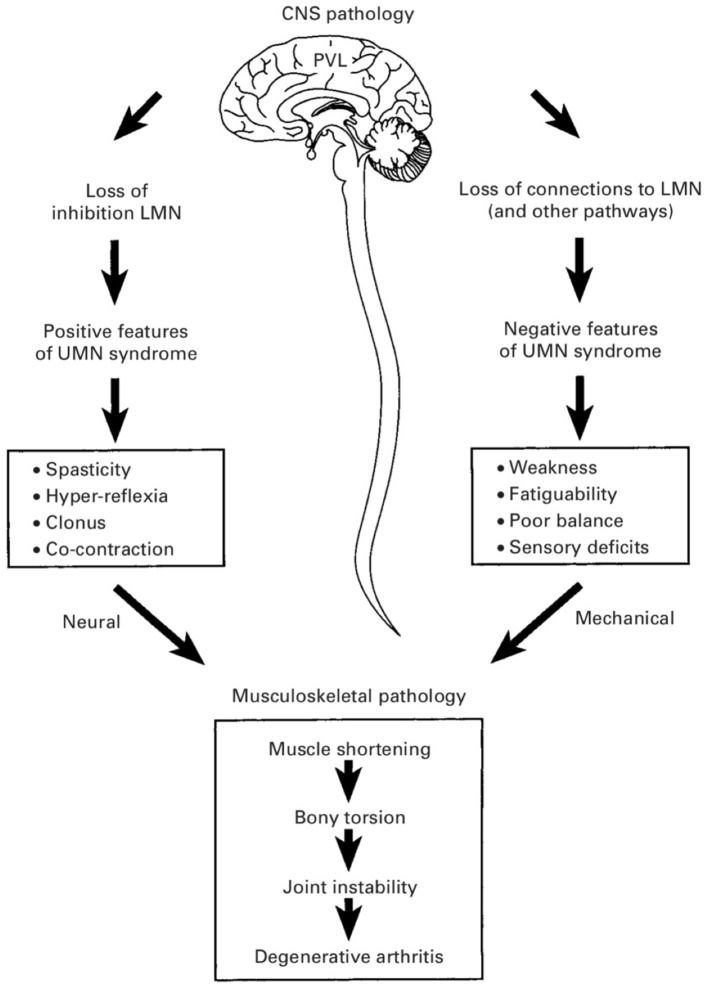
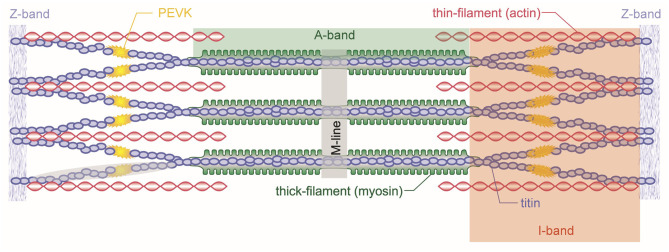
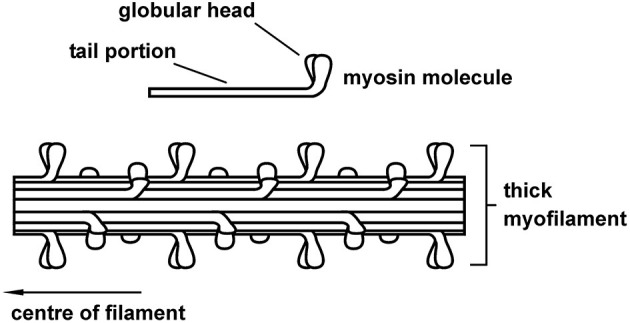
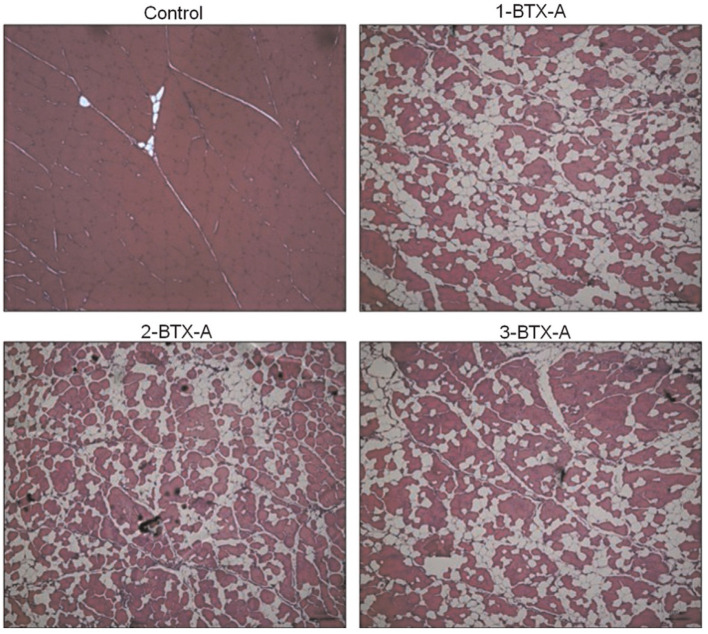
This review will provide a comprehensive, up-to-date review of the current knowledge regarding the pathophysiology of muscle contractures in cerebral palsy. Although much has been known about the clinical manifestations of both dynamic and static muscle contractures, until recently, little was known about the underlying mechanisms for the development of such contractures. In particular, recent basic science and imaging studies have reported an upregulation of collagen content associated with muscle stiffness. Paradoxically, contractile elements such as myofibrils have been found to be highly elastic, possibly an adaptation to a muscle that is under significant in vivo tension. Sarcomeres have also been reported to be excessively long, likely responsible for the poor force generating capacity and underlying weakness seen in children with cerebral palsy (CP). Overall muscle volume and length have been found to be decreased in CP, likely secondary to abnormalities in sarcomerogenesis. Recent animal and clinical work has suggested that the use of botulinum toxin for spasticity management has been shown to increase muscle atrophy and fibrofatty content in the CP muscle. Given that the CP muscle is short and small already, this calls into question the use of such agents for spasticity management given the functional and histological cost of such interventions. Recent theories involving muscle homeostasis, epigenetic mechanisms, and inflammatory mediators of regulation have added to our emerging understanding of this complicated area.

Keywords: cerebral palsy; connective tissue; epigenetics; muscle contractures; muscle morphology; satellite cells; skeletal muscle; spasticity.


Conflict of interest statement

The authors declare that the research was conducted in the absence of any commercial or financial relationships that could be construed as a potential conflict of interest.

Figures

Figure 1
Figure 1
Rang's three phases of cerebral palsy, the so-called “Traditional View,” which emphasizes spasticity as a primary driver of both muscle and bony deformities. (Used with permission ©Bill Reid/Kerr Graham, RCH Melbourne).
Figure 2
Figure 2
Positive and negative features of the upper motor neuron syndrome in cerebral palsy (CP). The negative features—including weakness, poor balance, and impaired selective motor control—are considered to be more important determinants of gross motor function in CP and are more likely causes of bony deformities and joint instability. (Used with permission © Bill Reid/Kerr Graham, RCH Melbourne).
Figure 3
Figure 3
Schematic representation of a skeletal muscle sarcomere. Shown are the contractile filaments actin and myosin and the structural protein titin. Sarcomeres are bordered by the Z-bands from which titin and actin emanate. Myosin is centered in the middle of the sarcomere and held in place by the titin filaments.
Figure 4
Figure 4
Schematic representation of the thick (myosin) skeletal muscle filament comprised primarily of myosin proteins. Myosin had a tail portion that is incorporated into the main body of the thick filament and two globular heads that reach out from the myosin toward the actin filament. Cross-bridges form cyclic attachments with actin, pulling actin past the myosin filament, thereby producing muscle contraction and force.
Figure 5
Figure 5
Geometric arrangement of the cross-bridges on the myosin filament. Cross-bridges come in pairs that are offset by 180° and are arranged every 14.3 nm along the myosin filament. Neighboring pairs of cross-bridges are rotated by 60°; therefore, cross-bridges with the same orientation (and thus attaching to the same actin filaments) occur every 42.9 nm.
Figure 6
Figure 6
Schematic representation of the thin (actin) filament. Actin is made up of two serially linked chains of actin globules and the repeating structures of the regulatory proteins tropomyosin and troponin. The regulatory protein troponin C binds calcium upon muscle activation, resulting in a configurational change of the troponin–tropomyosin complex that allows for cross-bridge attachment to actin.
Figure 7
Figure 7
Micrograph of a single myofibril (top panel) with the typical dark (A-band) and light (I-band) striation pattern and a corresponding sarcomere (middle panel) with a schematic representation of the sarcomere (bottom panel) including the appropriate labeling.
Figure 8
Figure 8
Schematic structural hierarchy of a skeletal muscle. The entire muscle is made up of fascicles, fascicles are made up of fibers (cells), and fibers are comprised of myofibrils. Each structural entity of the muscle is surrounded by connective tissues that connect the various structural levels with each other and connect the entire muscle to other muscles, bones, and fascia. The connective tissue layers are referred to as the epimysium, perimysium, and endomysium, as indicated in the figure.
Figure 9
Figure 9
Schematic figure of different structural arrangements of fibers relative to the long axis of the muscle. See text for further explanation and definition.
Figure 10
Figure 10
Sarcomere force–length relationship of a frog skeletal muscle as first described by Gordon et al. (38). The so-called plateau and descending limb regions are well explained by the sarcomere lengths (shown schematically below for lengths c, d, and e) and the corresponding overlap between the contractile filaments actin and myosin. The overlap between these filaments determines the number of possible cross-bridge interactions and thus the maximal, isometric force capacity.
Figure 11
Figure 11
Normalized force–velocity relationship of a skeletal muscle showing the well-known hyperbolic relationship between the maximal, steady-state force of a muscle as a function of its speed of shortening.
Figure 12
Figure 12
Force–time (top panel) and length–time (bottom panel) history of the contractile properties that produce residual force enhancement (FE) and residual force depression (FD). The dashed line labeled FREF represents the force obtained in an isometric reference contraction. Force enhancement represents the increase in steady-state isometric force (relative to FREF) of a muscle following active stretching, and force depression is the decrease in steady-state isometric force (relative to FREF) following active shortening.
Figure 13
Figure 13
Exemplar histology slides of muscles injected with Botulinum toxin type-A (BoNT-A). Control tissue that was injected with a corresponding volume of saline (Control), muscle receiving one BTXA injection evaluated 6 months following injection (1-BTX-A), muscle receiving two BTXA injections separated by 3 months and evaluated 6 months post the second injection (2-BTX-A), and muscle injected three times with BTXA, separated by 3 months and evaluated 6 months following the third and last injection. The red staining shows the contractile material of the muscle. The white, thin lines (especially visible in the Control slide) are representative of the collagen matrix structure, and the white extended areas (especially visible in the BoNT-A injected muscles) represent intramuscular fat. The average percentage of contractile tissue in these muscles were 96.9 ± 2.0% (Control), 59.2 ± 6.0% (1-BTX-A), 62.5 ± 6.1% (2-BTX-A), and 59.9 ± 11.8% (3-BTX-A), respectively.

Similar articles

Cited by

References

    1. Morris C. Definition and classification of cerebral palsy: a historical perspective. Dev Med Child Neurol. (2007) 49:3–7. 10.1111/j.1469-8749.2007.tb12609.x - DOI - PubMed
    1. Howard JJ, Soo B, Graham HK, Boyd RN, Reid S, Lanigan A, et al. . Cerebral palsy in Victoria: Motor types, topography and gross motor function. J Paediatr Child Health. (2005) 41:479–83. 10.1111/j.1440-1754.2005.00687.x - DOI - PubMed
    1. Lance JW. Symposium. In: Feldman RG, Young RR, Koella P. editors. Spasticity: Disordered Motor Control. Chicago, IL: Year Book Medical Pubs; (1980). p. 485-494.
    1. Yam WK, Leung MS. Interrater reliability of Modified Ashworth Scale and Modified Tardieu Scale in children with spastic cerebral palsy. J Child Neurol. (2006) 21:1031–5. 10.1177/7010.2006.00222 - DOI - PubMed
    1. Graham HK, Rosenbaum P, Paneth N, Dan B, Lin JP, Damiano DL, et al. . Cerebral palsy. Nat Rev Dis Primers. (2016) 2:15082. 10.1038/nrdp.2016.5 - DOI - PMC - PubMed

LinkOut - more resources