. 2021 Feb 18:11:549928.
doi: 10.3389/fendo.2020.549928. eCollection 2020.

Correspondence Between Perceived Pubertal Development and Hormone Levels in 9-10 Year-Olds From the Adolescent Brain Cognitive Development Study

Megan M Herting  1   2 Kristina A Uban  3   4 Marybel Robledo Gonzalez  5   6 Fiona C Baker  7 Eric C Kan  2   6 Wesley K Thompson  8 Douglas A Granger  4   9   10 Matthew D Albaugh  1 Andrey P Anokhin  11 Kara S Bagot  12 Marie T Banich  13 Deanna M Barch  14 Arielle Baskin-Sommers  15 Florence J Breslin  16 B J Casey  15 Bader Chaarani  17 Linda Chang  18 Duncan B Clark  19 Christine C Cloak  18 R Todd Constable  20 Linda B Cottler  21 Rada K Dagher  22 Mirella Dapretto  23 Anthony S Dick  24 Nico Dosenbach  25 Gayathri J Dowling  26 Julie A Dumas  17 Sarah Edwards  27 Thomas Ernst  18 Damien A Fair  28 Sarah W Feldstein-Ewing  29 Edward G Freedman  30 Bernard F Fuemmeler  31 Hugh Garavan  17 Dylan G Gee  15 Jay N Giedd  32 Paul E A Glaser  11 Aimee Goldstone  7 Kevin M Gray  33 Samuel W Hawes  24 Andrew C Heath  11 Mary M Heitzeg  34 John K Hewitt  13 Charles J Heyser  35 Elizabeth A Hoffman  26 Rebekah S Huber  36 Marilyn A Huestis  37 Luke W Hyde  38 M Alejandra Infante  5 Masha Y Ivanova  1 Joanna Jacobus  32 Terry L Jernigan  39 Nicole R Karcher  11 Angela R Laird  40 Kimberly H LeBlanc  26 Krista Lisdahl  41 Monica Luciana  42 Beatriz Luna  19 Hermine H Maes  43 Andrew T Marshall  2   44 Michael J Mason  45 Erin C McGlade  36 Amanda S Morris  16   46 Bonnie J Nagel  47 Gretchen N Neigh  48 Clare E Palmer  35 Martin P Paulus  16 Alexandra S Potter  17 Leon I Puttler  34 Nishadi Rajapakse  22 Kristina Rapuano  15 Gloria Reeves  27 Perry F Renshaw  49 Claudiu Schirda  50 Kenneth J Sher  51 Chandni Sheth  49 Paul D Shilling  5 Lindsay M Squeglia  33 Matthew T Sutherland  24 Susan F Tapert  2 Rachel L Tomko  33 Deborah Yurgelun-Todd  49 Natasha E Wade  5 Susan R B Weiss  26 Robert A Zucker  34 Elizabeth R Sowell  6
Affiliations

Correspondence Between Perceived Pubertal Development and Hormone Levels in 9-10 Year-Olds From the Adolescent Brain Cognitive Development Study

Megan M Herting et al. Front Endocrinol (Lausanne). .

Abstract

Aim: To examine individual variability between perceived physical features and hormones of pubertal maturation in 9-10-year-old children as a function of sociodemographic characteristics.

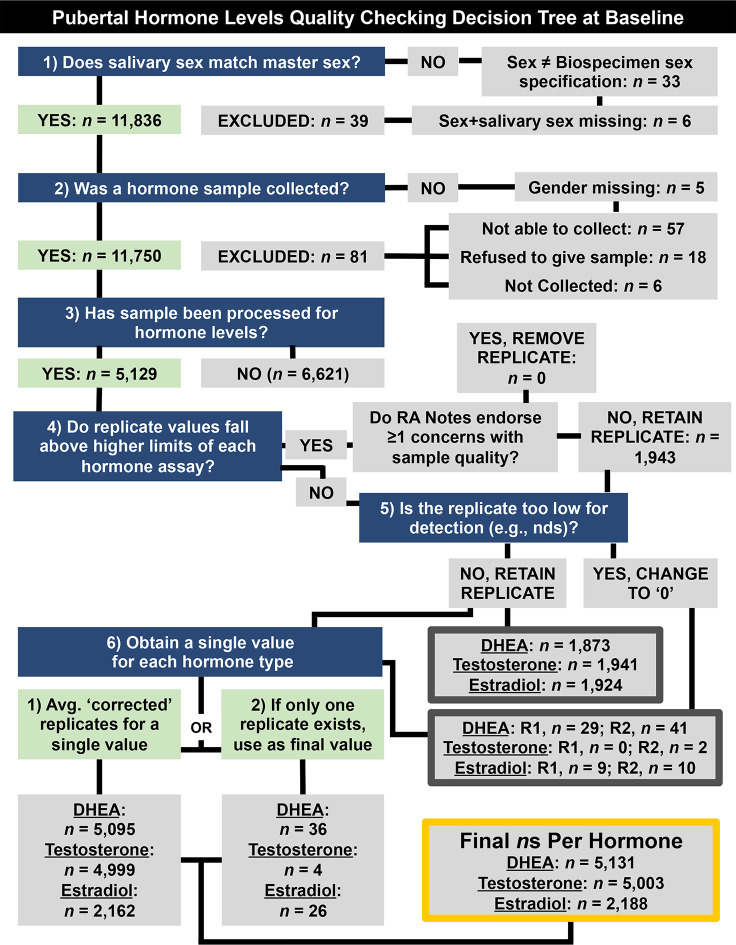
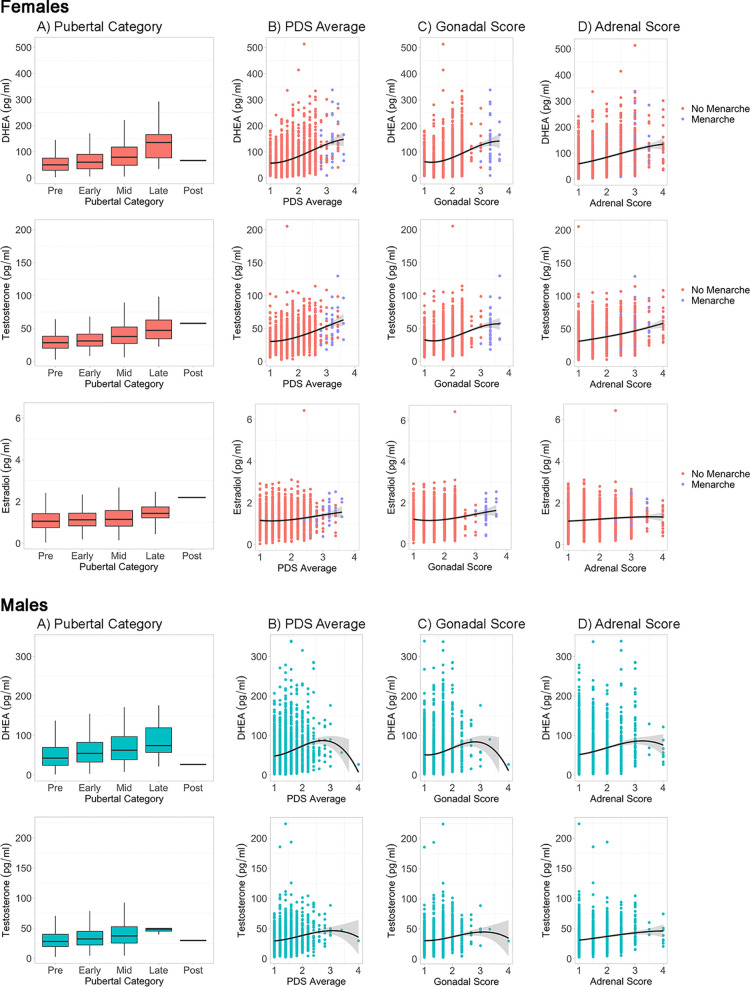
Methods: Cross-sectional metrics of puberty were utilized from the baseline assessment of the Adolescent Brain Cognitive Development (ABCD) Study-a multi-site sample of 9-10 year-olds (n = 11,875)-and included perceived physical features via the pubertal development scale (PDS) and child salivary hormone levels (dehydroepiandrosterone and testosterone in all, and estradiol in females). Multi-level models examined the relationships among sociodemographic measures, physical features, and hormone levels. A group factor analysis (GFA) was implemented to extract latent variables of pubertal maturation that integrated both measures of perceived physical features and hormone levels.

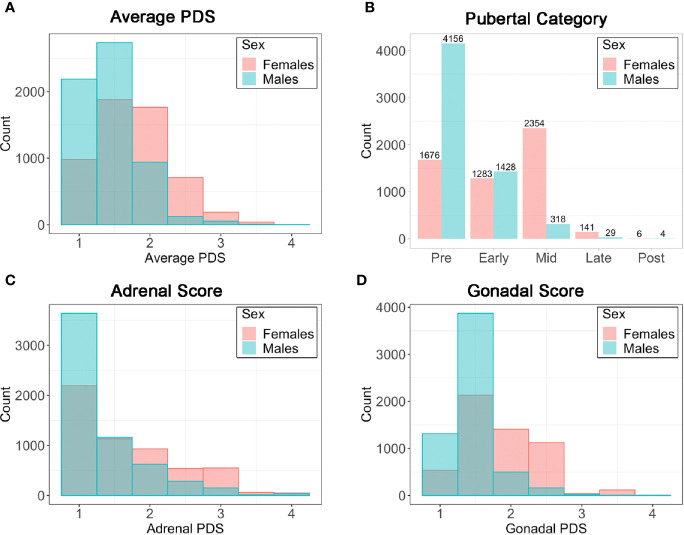
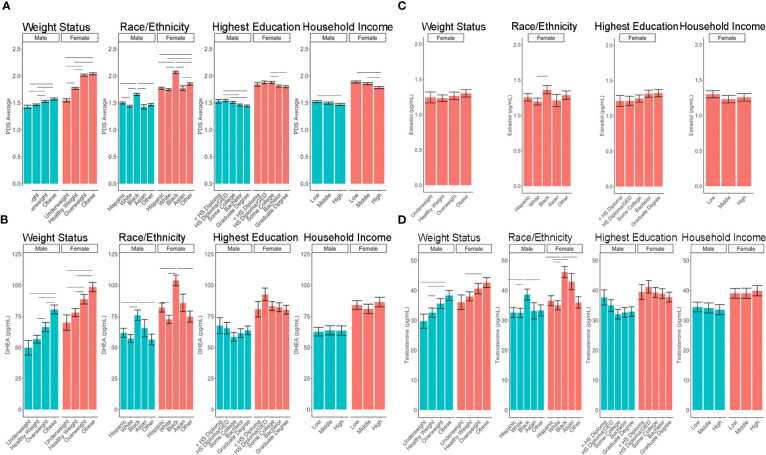
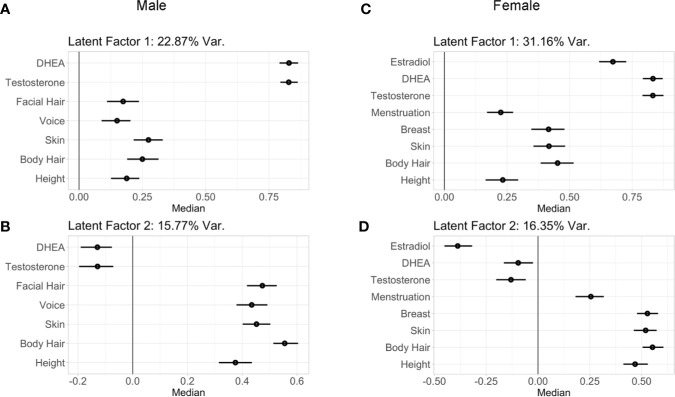
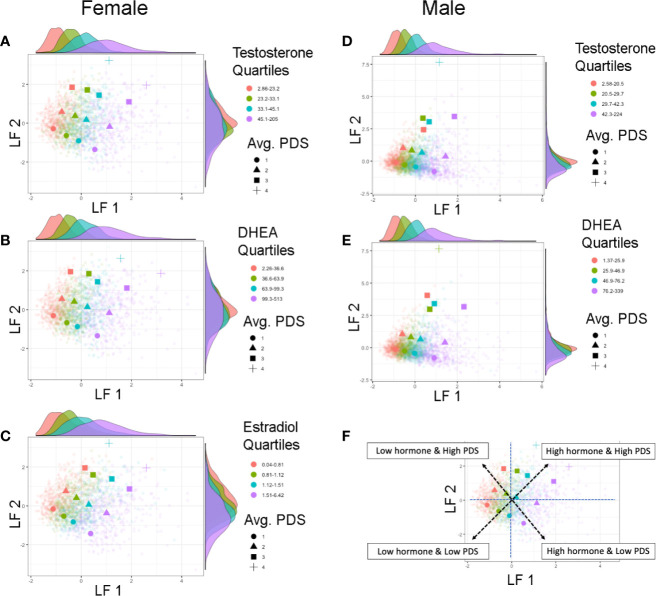
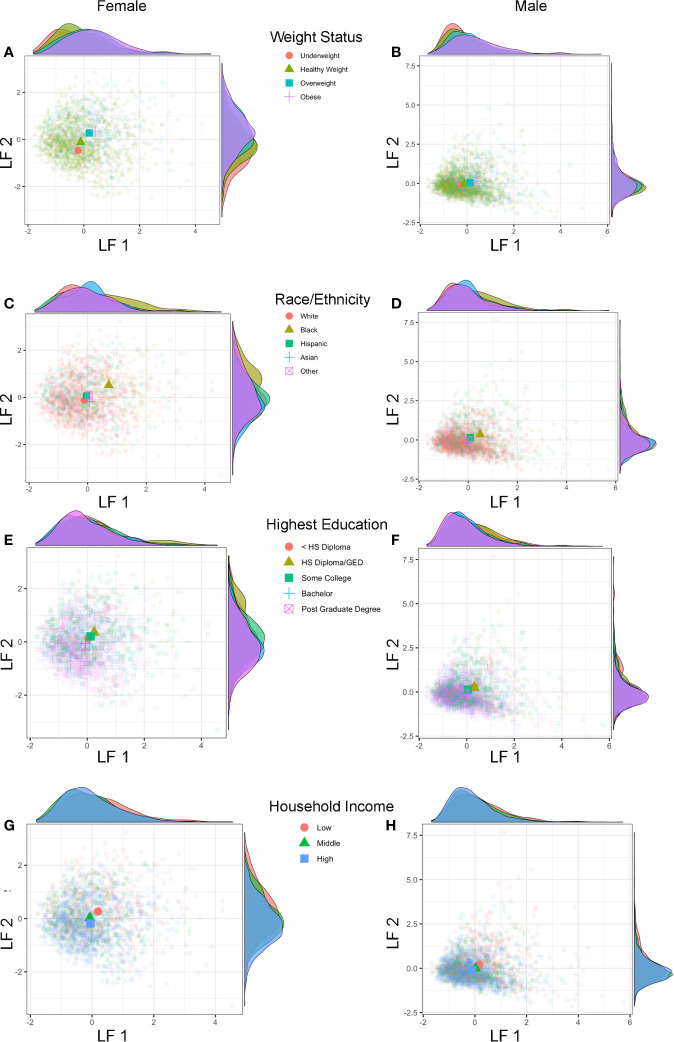
Results: PDS summary scores indicated more males (70%) than females (31%) were prepubertal. Perceived physical features and hormone levels were significantly associated with child's weight status and income, such that more mature scores were observed among children that were overweight/obese or from households with low-income. Results from the GFA identified two latent factors that described individual differences in pubertal maturation among both females and males, with factor 1 driven by higher hormone levels, and factor 2 driven by perceived physical maturation. The correspondence between latent factor 1 scores (hormones) and latent factor 2 scores (perceived physical maturation) revealed synchronous and asynchronous relationships between hormones and concomitant physical features in this large young adolescent sample.

Conclusions: Sociodemographic measures were associated with both objective hormone and self-report physical measures of pubertal maturation in a large, diverse sample of 9-10 year-olds. The latent variables of pubertal maturation described a complex interplay between perceived physical changes and hormone levels that hallmark sexual maturation, which future studies can examine in relation to trajectories of brain maturation, risk/resilience to substance use, and other mental health outcomes.

Keywords: adolescent brain cognitive development; dehydroepiandrosterone; estradiol; pubertal development scale; puberty; salivary hormones; testosterone.


Conflict of interest statement

In the interest of full disclosure, DG is founder and chief scientific and strategy advisor at Salimetrics LLC and Salivabio LLC (Carlsbad, CA) and these relationships are managed by the policies of the committee’s on conflict of interest at Johns Hopkins University School of Medicine and the University of California at Irvine. ND and DF have a financial interest in Nous Imaging Inc. and may financially benefit if the company is successful in marketing FIRMM software products. DF is a patent holder on the Framewise Integrated Real-Time Motion Monitoring (FIRMM) software and is a co-founder of Nous Imaging Inc. KG provides consultation to Pfizer, Inc. MP is an advisor to Spring Care, Inc., a behavioral startup and has received royalties for an article about methamphetamine in Uptodate. Authors AG and FB were employed by the company SRI International. SW has stock ownership in GE and Merck. All other authors declare that the research was conducted in the absence of any commercial or financial relationships that could be construed as a potential conflict of interest.

Figures

Figure 1
Figure 1
Decision tree for quality checking and generating a single hormone metric per participant at baseline (9–10 years old) (e.g., saliva assayed in duplicates, considerations for methodological concerns that may influence hormone level). Briefly, data were retained if (1) the sex specified during saliva collection matches sex at birth, as reported by parent participants, (2) if a salivary hormone sample was collected, and (3) if that sample had been processed. Replicate samples that fell below detection limits or were endorsed as problematic by research assistants (RAs) were not used to calculate participants’ hormone levels (4–6). NDS, not detectable sample; R1, Replicate 1. R2, Replicate 2.
Figure 2
Figure 2
Frequencies (N) for caregiver summary scores from the Pubertal Development Scale (PDS). (A) Average PDS score ranging from 1=not begun to 4=complete; (B) Pubertal Category score ranging from pre- to post- pubertal; (C) Adrenal score averaging adrenal PDS items and ranging from 1=not begun to 4=complete; (D) Gonadal score averaging gonadal PDS items and ranging from 1=not begun to 4=complete.
Figure 3
Figure 3
Caregiver based Pubertal Development Scale (PDS) summary scores and hormone levels by sex. For each sex, hormone levels are plotted by PDS summary scores, including (A) Pubertal Status Category, (B) Average PDS of all items, (C) Gonadal Score of PDS, and (D) Adrenal Score of PDS. Line represents cubic spline function of the data. Females are plotted by menarche status.
Figure 4
Figure 4
Post-hoc comparisons of sex differences in the associations between sociodemographic measures and pubertal outcomes of (A) PDS Average, (B) DHEA, (C) Estradiol, (D) Testosterone. Means and standard error (SE) for the fixed effects of weight status, race/ethnicity, highest parental education, and household income by sex, while adjusting for means of all other variables in the model. Lines denote p <0.05 using Tukey multiple comparison correction. HS, High school; GED, General Education Development. Income binned into a numerically coded factor representing low (<$50k), middle ($50–$100k), and high (≥$100k) income.
Figure 5
Figure 5
Latent factor loadings (median and 95% confidence intervals) of each predictor as identified by the two robust components of the group factor analyses. These analyses examined within and between variance in both perceived physical changes from the PDS as well as hormone levels in males (A, B) and females (C, D). These two latent factors capture the wide range of individual variability seen between physical and hormone metrics of early puberty among children, with latent factor 1 driven by hormone levels, and the latent factor 2 driven by physical maturation. Latent factor 1 accounted for 22.87% of variance of the pubertal measurements in (A) males and 31.16% in females (C). Latent factor 2 accounted for 15.77% of variance of the pubertal measurements in males (B) and 16.35% in females (D).
Figure 6
Figure 6
Individual differences in pubertal maturation as characterized by latent factors. Plots show individual scores (lighter, smaller colored shapes) as well as group-means (darker, larger colored shapes) of latent factor 1 (LF 1) and latent factor 2 (LF 2) in females (A–C) and males (D, E) by average score of physical features reported on the Pubertal Development Scale (PDS) (shape) as well as quartile range (color) of testosterone (A, D), DHEA (B, E), or estradiol (C). Opposite of each axis shows the marginal density plot of each latent factor as a function of each quartile of the given hormone (top: LF 1 by hormone density plot, right: LF 2 by hormone density plot). The correspondence between the two latent factors together captures synchrony and asynchrony between hormones and concomitant perceived physical features across this large child sample (F). Synchronous patterns are represented among individuals with a lower LF 1 and lower LF 2 scores who are pre-pubertal with low hormone levels (pink circle), and among individuals with a higher LF 1 and higher LF 2 scores who are the most advanced in physical maturation with high hormone levels (purple square or cross-hair). Opposing scores between LF 1 and LF 2 (e.g. higher LF 1 but lower LF 2 scores, or lower LF 1 but higher LF 2 scores) indicate a more asynchronous pattern between hormone levels and physical features.
Figure 7
Figure 7
Latent factors and sociodemographic characteristics. Plots show individual scores (lighter, smaller colored shapes) as well as group-means (darker, larger colored shapes) of latent factor 1 (LF 1) and latent factor 2 (LF 2) in females and males by weight status (A, B), race/ethnicity (C, D), highest parental education (E, F), and household income (G, H). Opposite of each axis shows the marginal density plot of each latent factor as a function of each sociodemographic measure. Group differences in pubertal maturation is apparent after integrating hormone levels and physical features using individual latent factors, with more advanced pubertal maturation seen (higher LF 1 and LF 2 scores) for overweight/obese versus underweight/healthy weight (A, B) as well as Black versus White, Hispanic, Asian, and Other (multi-race) (C, D) with larger effects seen in females as compared to males.

References

    1. Deardorff J, Hoyt LT, Carter R, Shirtcliff EA. Next Steps in Puberty Research: Broadening the Lens Toward Understudied Populations. J Res Adolesc (2019) 29:133–54. 10.1111/jora.12402 - DOI - PMC - PubMed
    1. Mendle J, Beltz AM, Carter R, Dorn LD. Understanding Puberty and Its Measurement: Ideas for Research in a New Generation. J Res Adolesc (2019) 29:82–95. 10.1111/jora.12371 - DOI - PubMed
    1. Savin-Williams RC, Ream GL. Pubertal onset and sexual orientation in an adolescent national probability sample. Arch Sex Behav (2006) 35:279–86. 10.1007/s10508-006-9032-8 - DOI - PubMed
    1. Braams BR, van Duijvenvoorde AC, Peper JS, Crone EA. Longitudinal changes in adolescent risk-taking: a comprehensive study of neural responses to rewards, pubertal development, and risk-taking behavior. J Neurosci (2015) 35:7226–38. 10.1523/JNEUROSCI.4764-14.2015 - DOI - PMC - PubMed
    1. Collado A, MacPherson L, Kurdziel G, Rosenberg LA, Lejuez CW. The relationship between puberty and risk taking in the real world and in the laboratory. Pers Indiv Differ (2014) 68:143–8. 10.1016/j.paid.2014.04.019 - DOI - PMC - PubMed

Publication types