. 2021 Feb 17:11:615280.
doi: 10.3389/fmicb.2020.615280. eCollection 2020.

Evolutionary Dynamics and Dissemination Pattern of the SARS-CoV-2 Lineage B.1.1.33 During the Early Pandemic Phase in Brazil

Affiliations

Evolutionary Dynamics and Dissemination Pattern of the SARS-CoV-2 Lineage B.1.1.33 During the Early Pandemic Phase in Brazil

Paola Cristina Resende et al. Front Microbiol. .

Abstract

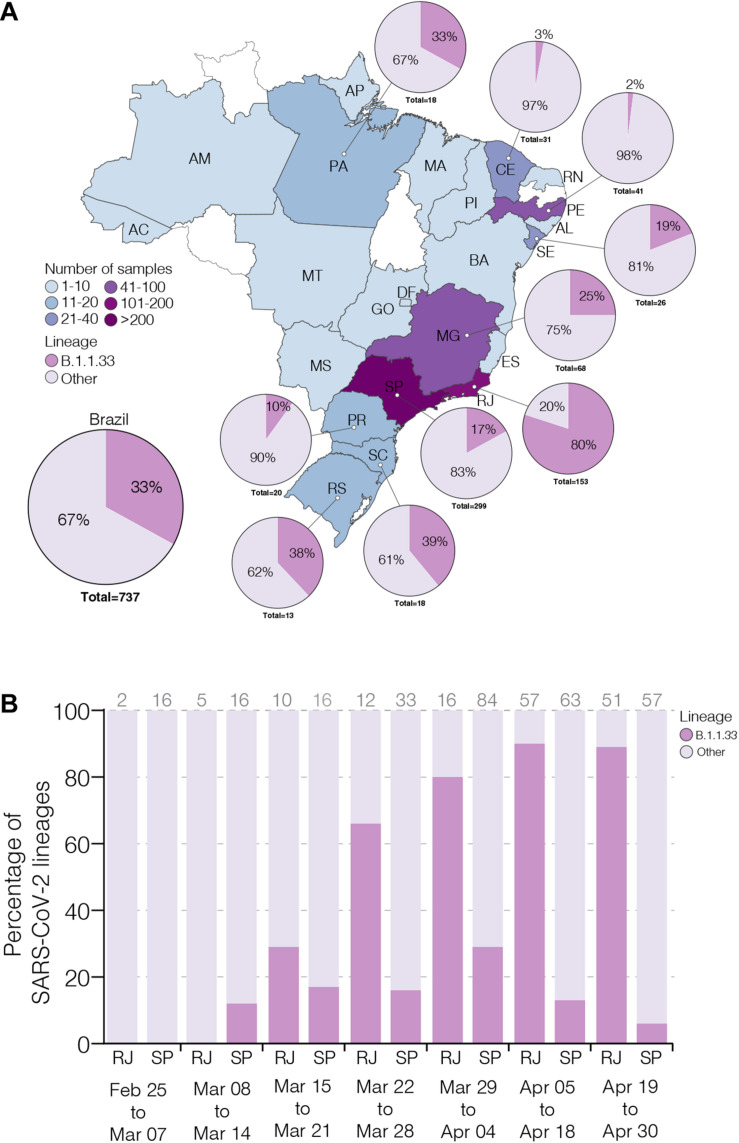
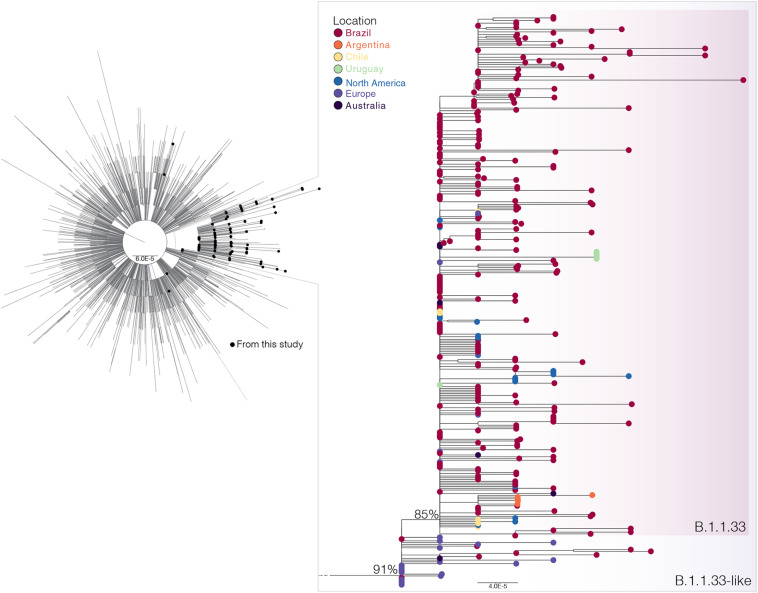
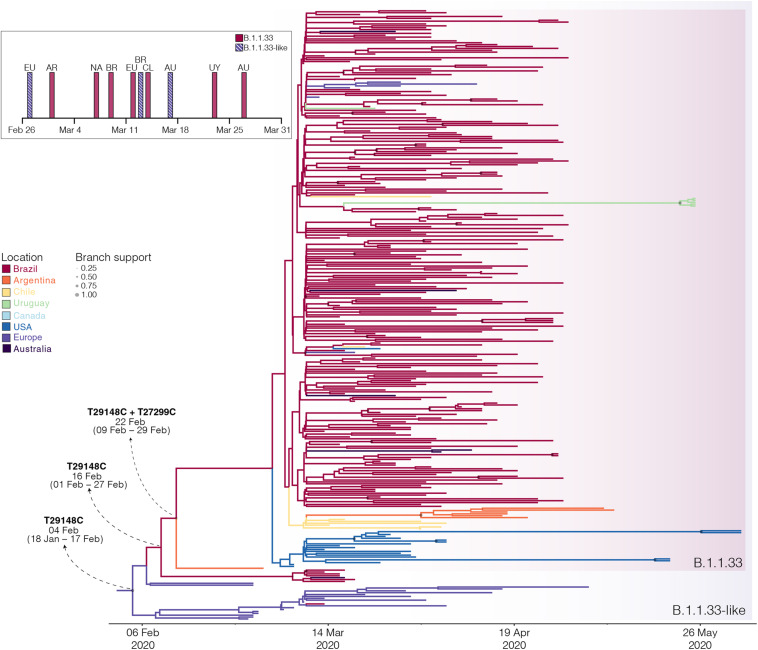
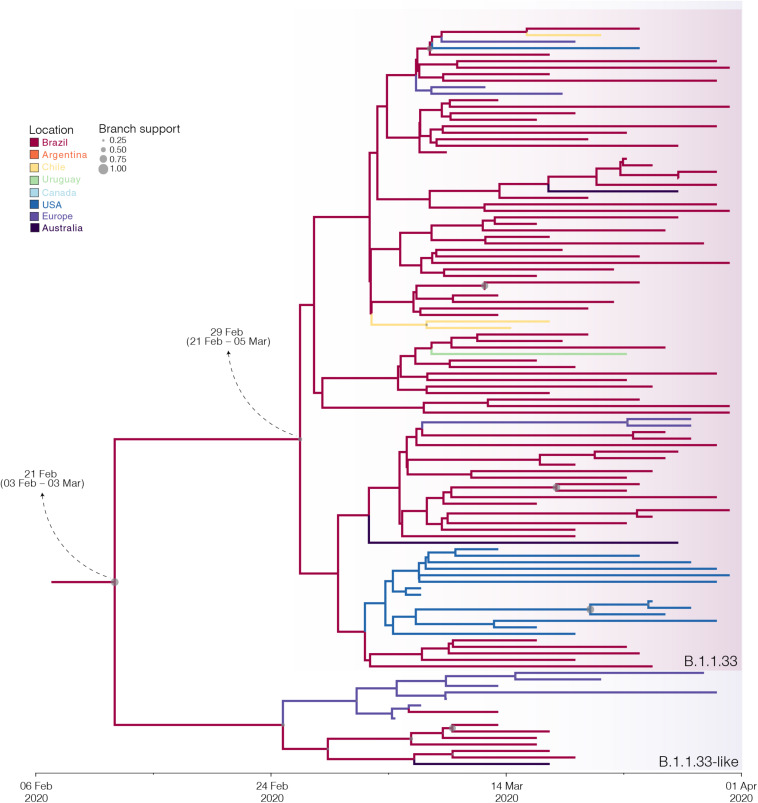
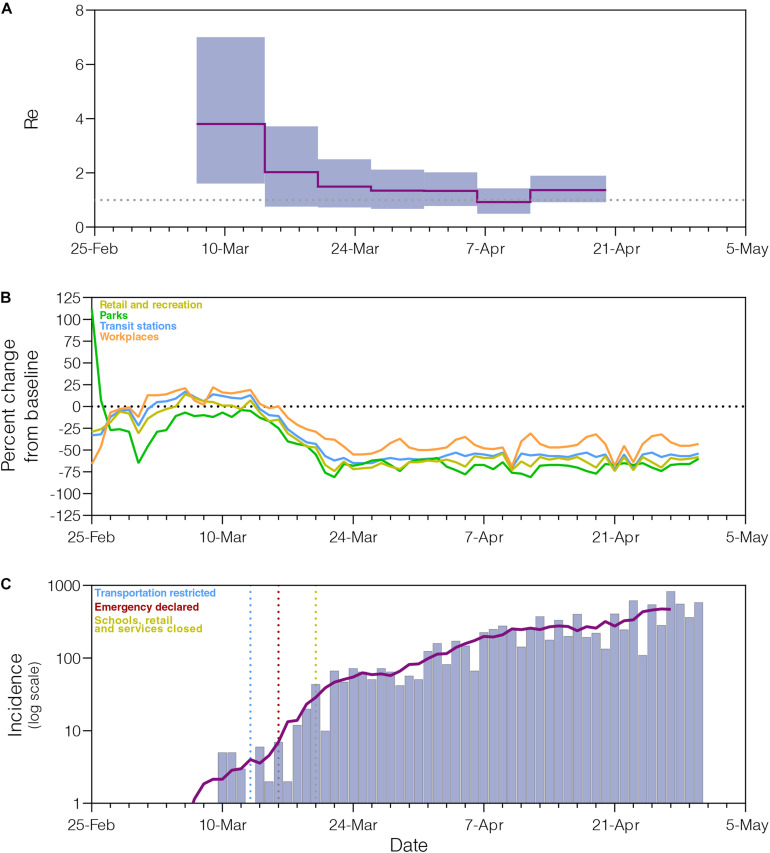
A previous study demonstrates that most of severe acute respiratory syndrome coronavirus-2 (SARS-CoV-2) Brazilian strains fell in three local clades that were introduced from Europe around late February 2020. Here we investigated in more detail the origin of the major and most widely disseminated SARS-CoV-2 Brazilian lineage B.1.1.33. We recovered 190 whole viral genomes collected from 13 Brazilian states from February 29 to April 31, 2020 and combined them with other B.1.1 genomes collected globally. Our genomic survey confirms that lineage B.1.1.33 is responsible for a variable fraction of the community viral transmissions in Brazilian states, ranging from 2% of all SARS-CoV-2 genomes from Pernambuco to 80% of those from Rio de Janeiro. We detected a moderate prevalence (5-18%) of lineage B.1.1.33 in some South American countries and a very low prevalence (<1%) in North America, Europe, and Oceania. Our study reveals that lineage B.1.1.33 evolved from an ancestral clade, here designated B.1.1.33-like, that carries one of the two B.1.1.33 synapomorphic mutations. The B.1.1.33-like lineage may have been introduced from Europe or arose in Brazil in early February 2020 and a few weeks later gave origin to the lineage B.1.1.33. These SARS-CoV-2 lineages probably circulated during February 2020 and reached all Brazilian regions and multiple countries around the world by mid-March, before the implementation of air travel restrictions in Brazil. Our phylodynamic analysis also indicates that public health interventions were partially effective to control the expansion of lineage B.1.1.33 in Rio de Janeiro because its median effective reproductive number (R e ) was drastically reduced by about 66% during March 2020, but failed to bring it to below one. Continuous genomic surveillance of lineage B.1.1.33 might provide valuable information about epidemic dynamics and the effectiveness of public health interventions in some Brazilian states.

Keywords: Brazil; community transmission; coronavirus; coronavirus disease 2019; genetic lineages; severe acute respiratory syndrome coronavirus-2.


Conflict of interest statement

The authors declare that the research was conducted in the absence of any commercial or financial relationships that could be construed as a potential conflict of interest.

Figures

FIGURE 1
FIGURE 1
Prevalence of severe acute respiratory syndrome coronavirus-2 (SARS-CoV-2) B.1.1.33 lineage in Brazil. (A) Map showing the prevalence of SARS-CoV-2 B.1.1.33 across Brazilian states with more than 10 viral genomes available. The color of each state represents the number of sequences used in this study. The pie charts show the proportion of sequences that belong to the B.1.1.33 lineage in each Brazilian state with >10 sequences and in the whole country. (B) Dynamics of B.1.1.33 lineage prevalence in Rio de Janeiro (RJ) and Sao Paulo (SP) states over time. The total of sequences analyzed in each period is indicated above each column. The two letter codes defining the Brazilian states follow the ISO 3166-2:BR standard.
FIGURE 2
FIGURE 2
Phylogenetic relationships of SARS-CoV-2 B.1.1 Brazilian and global strains. Maximum likelihood (ML) phylogenetic tree of 190 B.1.1 Brazilian genomes obtained in this survey (black circles) along with 3,053 B.1.1 international reference sequences from the GISAID database. The zoomed view shows the clusters B.1.1.33-like and B.1.1.33. Tip circles are colored according to the sampling location. Only node supports (aLRT) above 70% are shown. Shaded boxes highlight the position of clusters B.1.1.33-like and B.1.1.33. Tree was rooted on midpoint, and branch lengths are drawn to scale with the bars at the bottom indicating nucleotide substitutions per site.
FIGURE 3
FIGURE 3
Spatiotemporal dissemination of the SARS-CoV-2 clades B.1.1.33-like and B.1.1.33. Time-scaled Bayesian phylogeographic MCC tree of the major B.1.1 lineages circulating in Brazil. Branches are colored according to the most probable location state of their descendent nodes as indicated at the legend. Circle sizes at internal nodes are proportional to the corresponding posterior probability support as indicated at the legend. The inferred TMRCA (based on the median of the posterior heights) and nucleotide substitutions fixed at ancestral key nodes are shown. Shaded boxes highlight the position of the clades B.1.1.33-like and B.1.1.33. The tree is automatically rooted under the assumption of a strict molecular clock, and all horizontal branch lengths are drawn to a scale of years. The inset figure depicts the timeline of the earliest detection of clades B.1.1.33-like (blue dashed bars) and B.1.1.33 (red bars) in Europe (EU), North America (NA), Australia (AU), Argentina (AR), Brazil (BR), Chile (CL), and Uruguay (UY).
FIGURE 4
FIGURE 4
Influence of sampling on the phylogeographic reconstruction of SARS-CoV-2 clade B.1.1.33. Time-scaled Bayesian phylogeographic maximum clade credibility (MCC) tree of a subset of sequences comprising the oldest B.1.1.33-like and B.1.1.33 strains. Branches are colored according to the most probable location state of their descendent nodes as indicated at the legend. Circle size at internal nodes are proportional to the corresponding posterior probability support as indicated at the legend. The inferred TMRCA (based on the median of the posterior heights) and nucleotide substitutions fixed at ancestral key nodes are shown. Shaded boxes highlight the position of the clades B.1.1.33-like and B.1.1.33. The tree is automatically rooted under the assumption of a strict molecular clock, and all horizontal branch lengths are drawn to a scale of years.
FIGURE 5
FIGURE 5
Epidemiological and mobility indicators of the SARS-CoV-2 epidemic in Rio de Janeiro. (A) Temporal variation of the effective reproductive number (Re) of the B.1.1.33 lineage in Rio de Janeiro estimated using the Bayesian birth–death approach. (B) Mobility data trends reported as percentage change measured against baseline. Each parameter is colored following the legend. (C) Progress of incidence of SARS-CoV-2 in Rio de Janeiro. The line represents the weekly average. The date of the main epidemic control measures is indicated by the vertical dotted lines.
FIGURE 6
FIGURE 6
Putative origin and transmission history of the SARS-CoV-2 clades B.1.1.33-like and B.1.1.33. (A) Diagrams showing two alternative scenarios for the origin and dissemination of clades B.1.1.33-like and B.1.1.33. The left panel depicts the hypothetical scenario where a B.1.1.33-like strain carrying the mutation T29148C was introduced into Brazil from Europe (marked with an asterisk) and after a period of local transmission in Brazil arose the B.1.1.33 variant carrying the mutation T27299C, which dispersed all over the country and from Brazil to other countries in the Americas and Oceania. (B) This panel depicts the hypothetical scenario where a B.1.1 strain was introduced from Europe to Brazil, and mutations T29148C and T27299C arose at sequential steps during local transmission. According to this second scenario, Brazil was the epicenter of dissemination of both clades B.1.1.33-like and B.1.1.33 to other countries in Europe, the Americas, and Oceania. (C) Graphic showing the monthly number of international air passengers from South America, North America, and Europe that arrived in Brazil during 2020 (available at: https://www.anac.gov.br) (left-hand axis) along with probability density of TMRCA estimates for clades B.1.1.33.like (gray) and B.1.1.33 (red).

References

    1. Ayres D. L., Cummings M. P., Baele G., Darling A. E., Lewis P. O., Swofford D. L., et al. (2019). BEAGLE 3: improved performance, scaling, and usability for a high-performance computing library for statistical phylogenetics. Syst. Biol. 68 1052–1061. 10.1093/sysbio/syz020 - DOI - PMC - PubMed
    1. Binny R. N., Lustig A., Brower A., Hendy S. C., James A., Parry M., et al. (2020). Effective reproduction number for COVID-19 in Aotearoa New Zealand. medRxiv [Preprint], 10.1101/2020.08.10.20172320 - DOI
    1. Bluhm A., Christandl M., Gesmundo F., Klausen F. R., Manćinska L., Steffan V., et al. (2020). SARS-CoV-2 transmission chains from genetic data: a Danish case study. bioRxiv [Preprint], 10.1101/2020.05.29.123612 - DOI - PMC - PubMed
    1. Bouckaert R., Vaughan T. G., Barido-Sottani J., Duchene S., Fourment M., Gavryushkina A., et al. (2019). BEAST 2.5: an advanced software platform for Bayesian evolutionary analysis. PLoS Comput. Biol. 15:e1006650. 10.1371/journal.pcbi.1006650 - DOI - PMC - PubMed
    1. Candido D. S., Claro I. M., de Jesus J. G., Souza W. M., Moreira F. R. R., Dellicour S., et al. (2020). Evolution and epidemic spread of SARS-CoV-2 in Brazil. Science 369 1255–1260. 10.1126/science.abd2161 - DOI - PMC - PubMed

LinkOut - more resources