

Escherichia coli Exopolysaccharides Induced by Ceftriaxone Regulated Human Gut Microbiota in vitro
- PMID: 33679666
- PMCID: PMC7928337
- DOI: 10.3389/fmicb.2021.634204
Escherichia coli Exopolysaccharides Induced by Ceftriaxone Regulated Human Gut Microbiota in vitro
Abstract
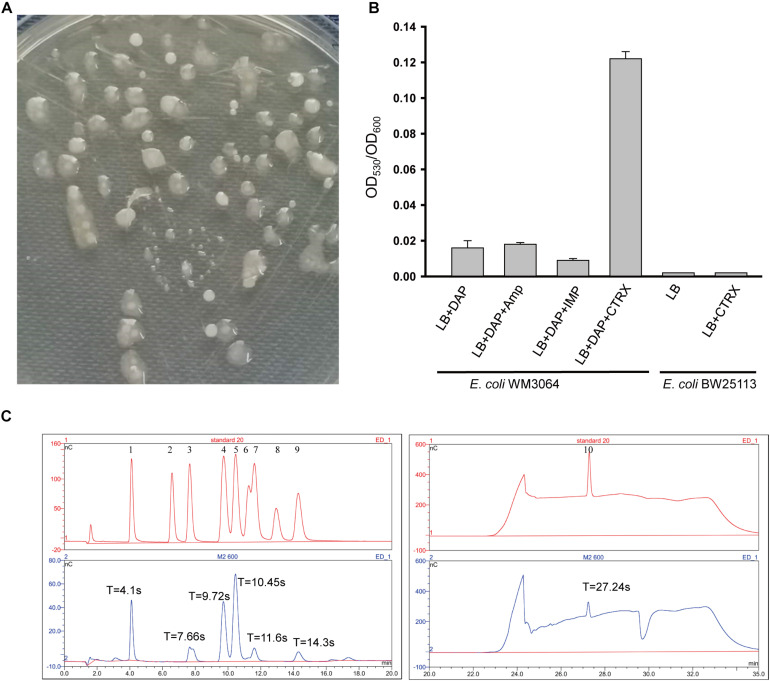
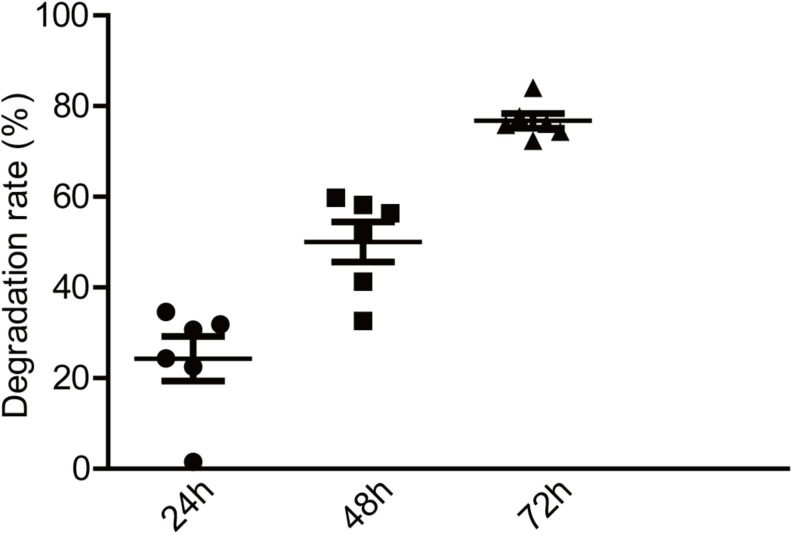
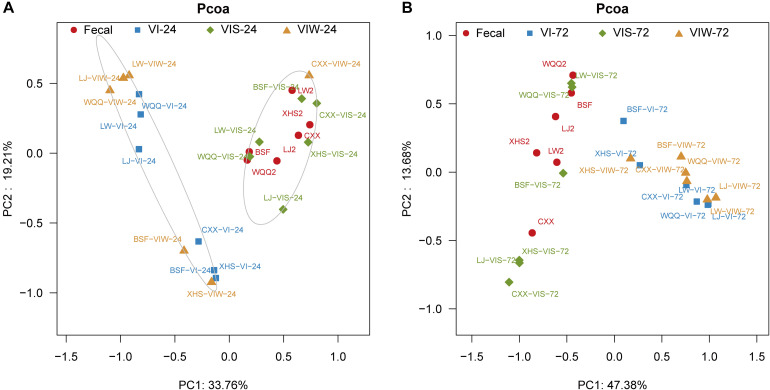
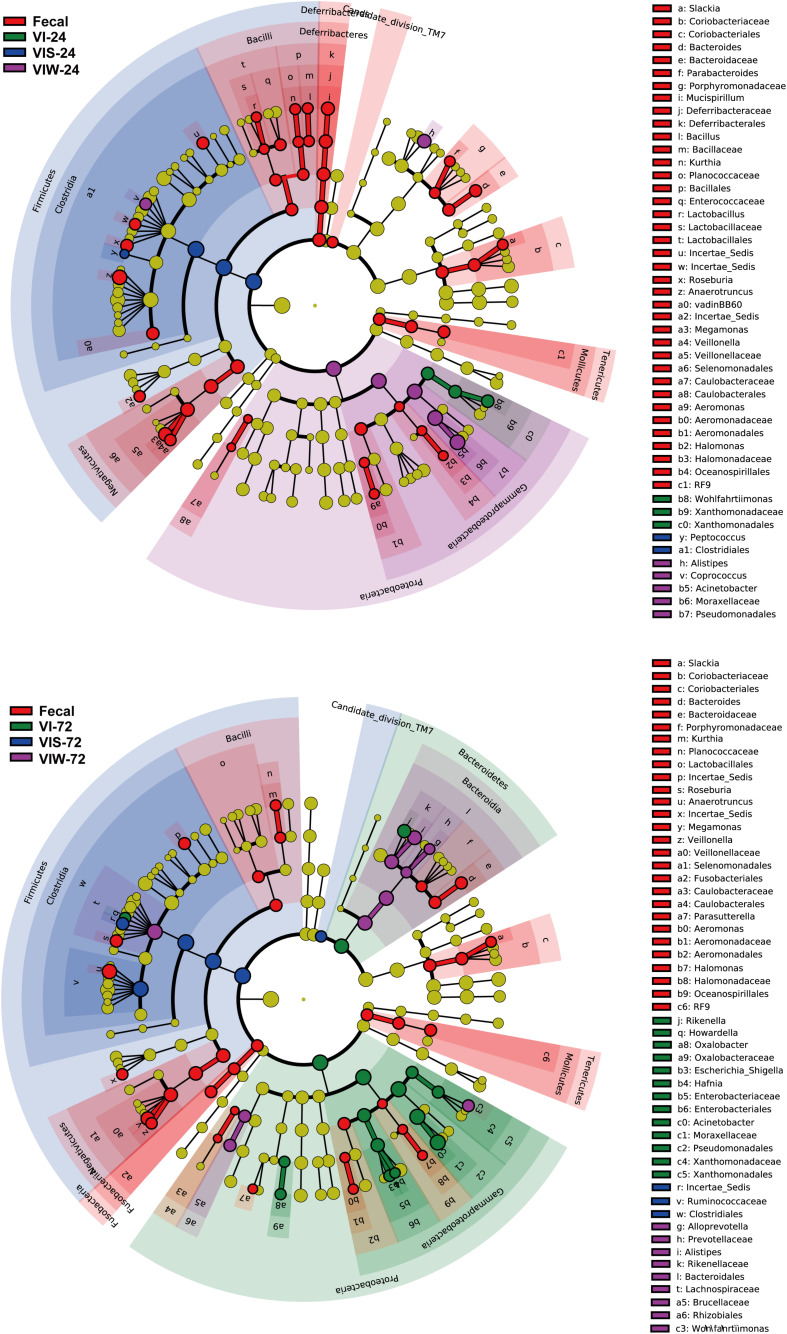
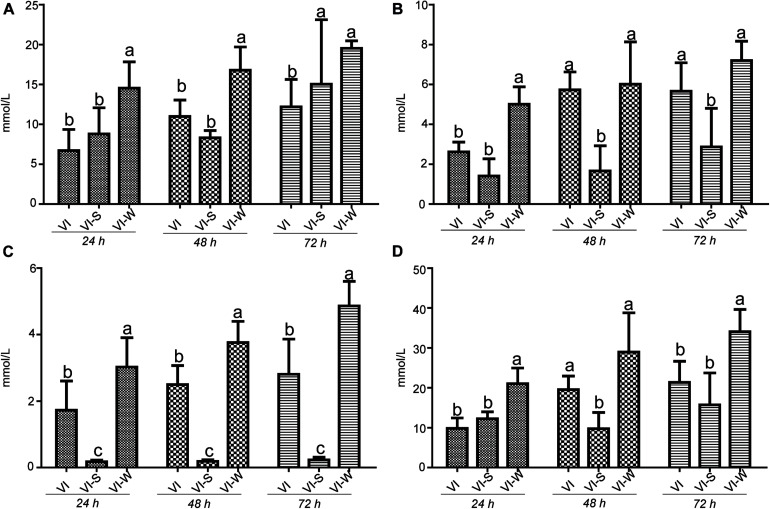
A stable intestinal microflora is an essential prerequisite for human health. This study investigated the interaction between Escherichia coli exopolysaccharides (named EPS-m2) and the human gut microbiota (HGM) in vitro. The EPS-m2 was produced by E. coli WM3064 when treated with ceftriaxone. The monosaccharide composition analysis revealed that EPS-m2 is composed of glucuronic acid, glucose, fucose, galactose/N-acetyl glucosamine, arabinose, xylose, and ribose with a molar ratio of approximately 77:44:29:28:2:1:1. The carbohydrates, protein, and uronic acids contents in EPS-m2 was 78.6 ± 0.1%, 4.38 ± 0.11%, and 3.86 ± 0.09%, respectively. In vitro batch fermentation experiments showed that 77% of EPS-m2 could be degraded by human fecal microbiota after 72 h of fermentation. In reverse, 16S rRNA gene sequencing analysis showed that EPS-m2 increased the abundance of Alistipes, Acinetobacter, Alloprevotella, Howardella, and Oxalobacter; GC detection illustrated that EPS-m2 enhanced the production of SCFAs. These findings indicated that EPS-m2 supplementation could regulate the HGM and might facilitate modulation of human health.
Keywords: 16S rRNA gene sequencing; EPS-m2; SCFA; ceftriaxone; gut microbiota.
Copyright © 2021 Li, Chen, Cao, Hu, Chen and Yin.
Conflict of interest statement
The authors declare that the research was conducted in the absence of any commercial or financial relationships that could be construed as a potential conflict of interest.
Figures
Similar articles
-
Effects of an Escherichia coli exopolysaccharide on human and mouse gut microbiota in vitro.Int J Biol Macromol. 2020 May 1;150:991-999. doi: 10.1016/j.ijbiomac.2019.10.186. Epub 2019 Nov 18. Int J Biol Macromol. 2020. PMID: 31751742
-
Effects of bifidobacteria-produced exopolysaccharides on human gut microbiota in vitro.Appl Microbiol Biotechnol. 2019 Feb;103(4):1693-1702. doi: 10.1007/s00253-018-9572-6. Epub 2018 Dec 19. Appl Microbiol Biotechnol. 2019. PMID: 30569218
-
Exopolysaccharides From Lactobacillus paracasei Isolated From Kefir as Potential Bioactive Compounds for Microbiota Modulation.Front Microbiol. 2020 Oct 16;11:583254. doi: 10.3389/fmicb.2020.583254. eCollection 2020. Front Microbiol. 2020. PMID: 33178165 Free PMC article.
-
Bacterial exopolysaccharides as emerging bioactive macromolecules: from fundamentals to applications.Res Microbiol. 2023 May;174(4):104024. doi: 10.1016/j.resmic.2022.104024. Epub 2022 Dec 30. Res Microbiol. 2023. PMID: 36587857 Review.
-
In vitro human gut microbiota fermentation models: opportunities, challenges, and pitfalls.Microbiome Res Rep. 2023 Jan 17;2(1):2. doi: 10.20517/mrr.2022.15. eCollection 2023. Microbiome Res Rep. 2023. PMID: 38045607 Free PMC article. Review.
Cited by
-
Connecting the Dots Between the Gut-IGF-1-Prostate Axis: A Role of IGF-1 in Prostate Carcinogenesis.Front Endocrinol (Lausanne). 2022 Mar 15;13:852382. doi: 10.3389/fendo.2022.852382. eCollection 2022. Front Endocrinol (Lausanne). 2022. PMID: 35370981 Free PMC article. Review.
References
LinkOut - more resources
Full Text Sources
Other Literature Sources
Miscellaneous