. 2021 Feb 15:11:617767.
doi: 10.3389/fimmu.2020.617767. eCollection 2020.

Engineered IgG1-Fc Molecules Define Valency Control of Cell Surface Fcγ Receptor Inhibition and Activation in Endosomes

Affiliations

Engineered IgG1-Fc Molecules Define Valency Control of Cell Surface Fcγ Receptor Inhibition and Activation in Endosomes

Elizabeth M Bailey et al. Front Immunol. .

Abstract

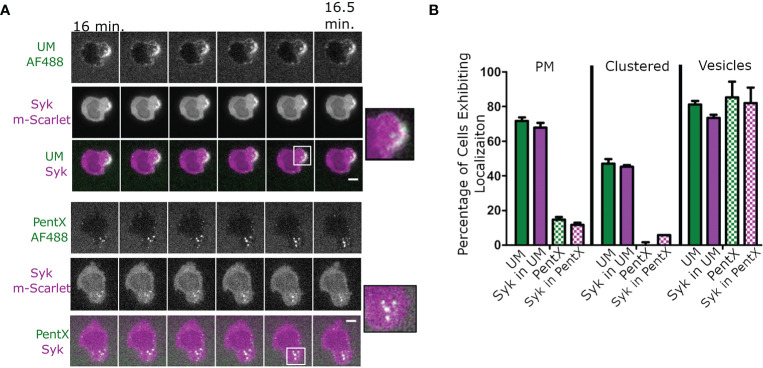
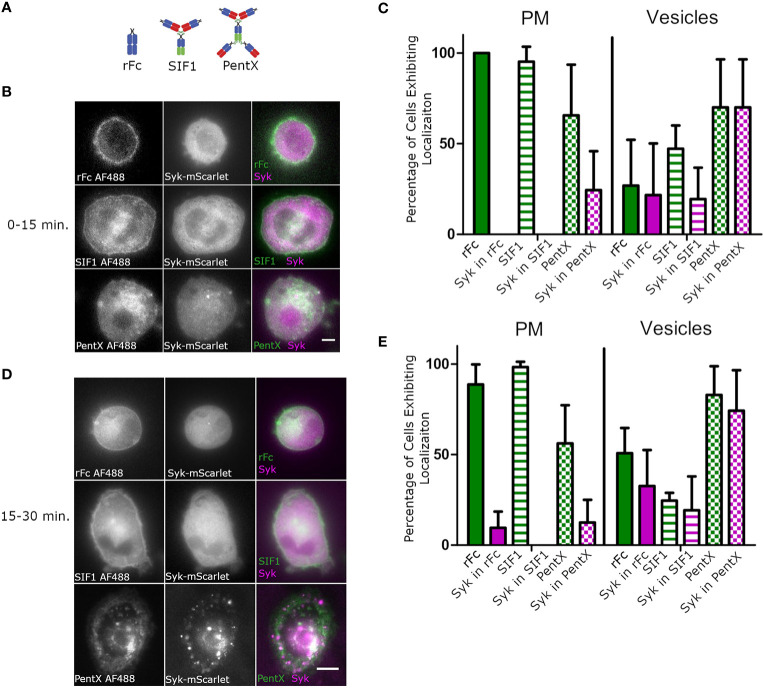
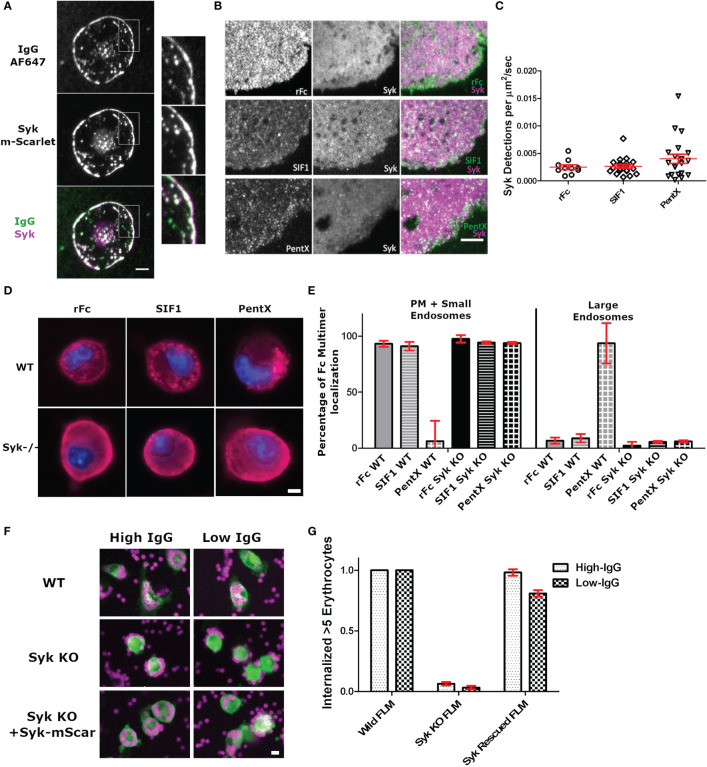
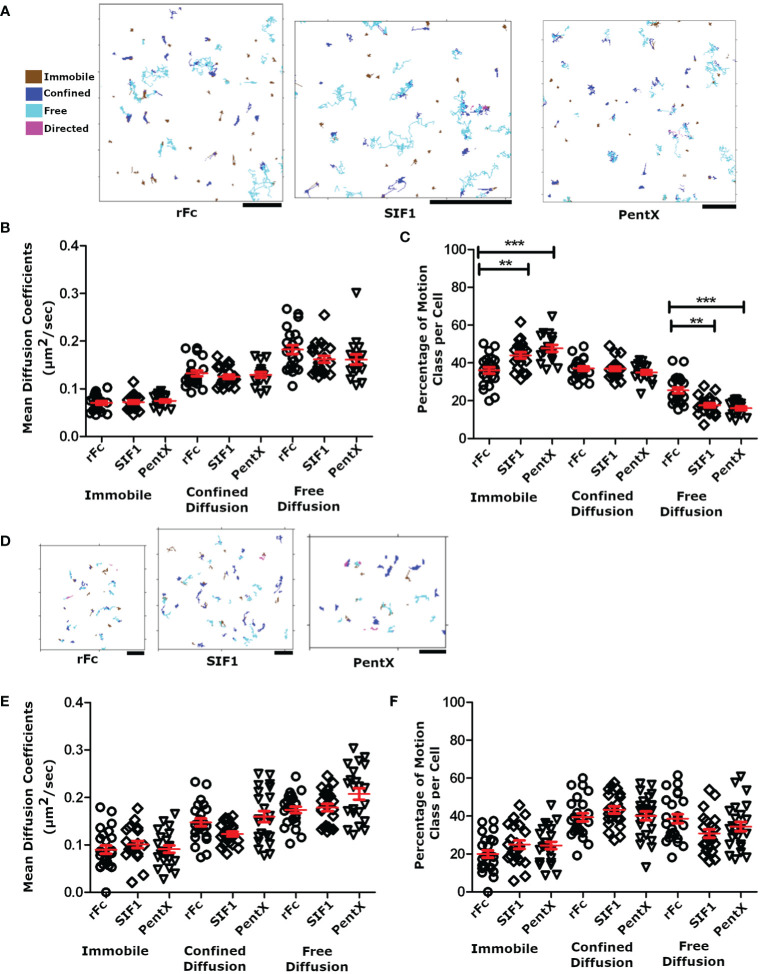
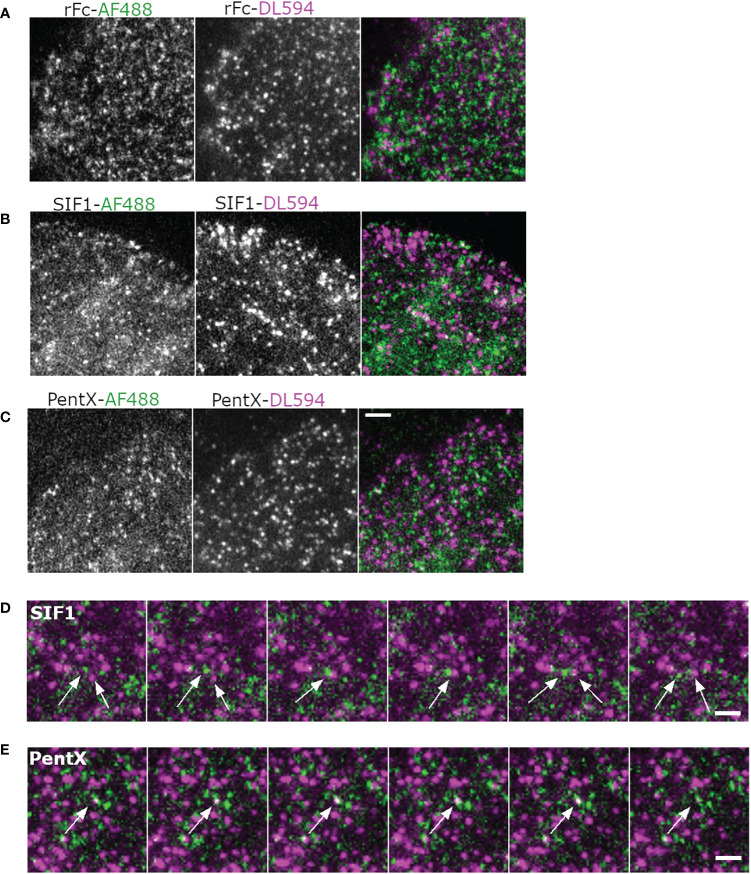
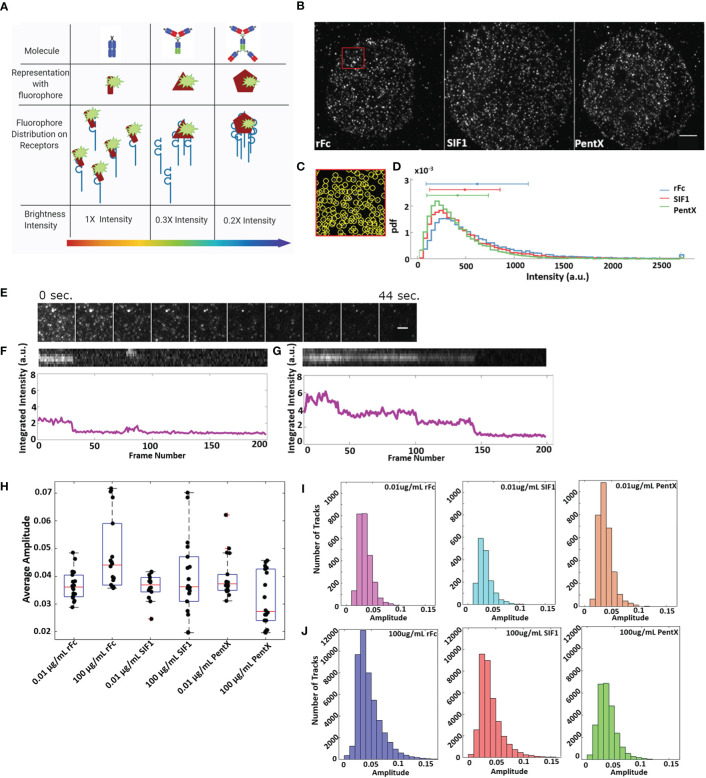
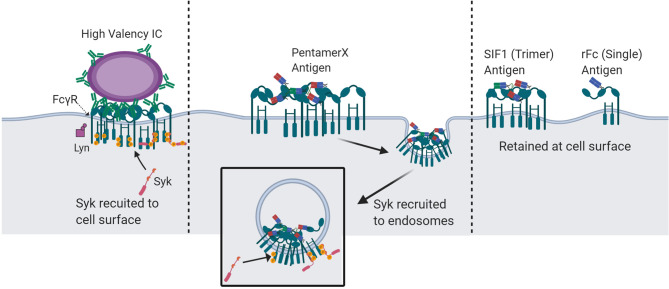
The inhibition of Fcγ receptors (FcγR) is an attractive strategy for treating diseases driven by IgG immune complexes (IC). Previously, we demonstrated that an engineered tri-valent arrangement of IgG1 Fc domains (SIF1) potently inhibited FcγR activation by IC, whereas a penta-valent Fc molecule (PentX) activated FcγR, potentially mimicking ICs and leading to Syk phosphorylation. Thus, a precise balance exists between the number of engaged FcγRs for inhibition versus activation. Here, we demonstrate that Fc valency differentially controls FcγR activation and inhibition within distinct subcellular compartments. Large Fc multimer clusters consisting of 5-50 Fc domains predominately recruited Syk-mScarlet to patches on the plasma membrane, whereas PentX exclusively recruited Syk-mScarlet to endosomes in human monocytic cell line (THP-1 cells). In contrast, SIF1, similar to monomeric Fc, spent longer periods docked to FcγRs on the plasma membrane and did not accumulate and recruit Syk-mScarlet within large endosomes. Single particle tracking (SPT) of fluorescent engineered Fc molecules and Syk-mScarlet at the plasma membrane imaged by total internal reflection fluorescence microscopy (SPT-TIRF), revealed that Syk-mScarlet sampled the plasma membrane was not recruited to FcγR docked with any of the engineered Fc molecules at the plasma membrane. Furthermore, the motions of FcγRs docked with recombinant Fc (rFc), SIF1 or PentX, displayed similar motions with D ~ 0.15 μm2/s, indicating that SIF1 and PentX did not induce reorganization or microclustering of FcγRs beyond the ligating valency. Multicolor SPT-TIRF and brightness analysis of docked rFc, SIF1 and PentX also indicated that FcγRs were not pre-assembled into clusters. Taken together, activation on the plasma membrane requires assembly of more than 5 FcγRs. Unlike rFc or SIF1, PentX accumulated Syk-mScarlet on endosomes indicating that the threshold for FcγR activation on endosomes is lower than on the plasma membrane. We conclude that the inhibitory effects of SIF1 are mediated by stabilizing a ligated and inactive FcγR on the plasma membrane. Thus, FcγR inhibition can be achieved by low valency ligation with SIF1 that behaves similarly to FcγR docked with monomeric IgG.

Keywords: Fcγ receptor; antibodies; autoimmunity; immune complex; inhibitor; macrophage; monocyte; single molecule.


Conflict of interest statement

AC, DO, JS, AM, and CB were employed by Momenta Pharmaceuticals during the project and have equity interest. CB, AM, and DO are inventors on patent application PCT/US2015/028926 (WO/2015/168643) submitted by Momenta Pharmaceuticals that covers “Compositions and methods related to engineered Fc constructs”. The remaining authors declare that the research was conducted in the absence of any commercial or financial relationships that could be construed as a potential conflict of interest.

Figures

Figure 1
Figure 1
PentX recruits Syk to endosomes, whereas multimeric Fc-FcγR complexes recruit Syk to the plasma membrane (PM). (A) Confocal imaging of Syk-mScarlet localization in THP-1 cells relative to fluorescently labeled PentX-AF488 or unconstrained Fc multimer (UM-AF488). By 15 min of incubation with Fc constructs, Syk-mScarlet localized to PM patches of UM-AF488 and occasionally on endosomes, whereas Syk-mScarlet localized only to endosomes PentX-AF488 (scale bar, 5µm). (B) The percentage of cells exhibiting localization of UM-AF488 or PentX-AF488 or Syk-mScarlet to PM, PM-clusters or intracellular vesicles following15 min of incubation (error bars are standard deviation, n= 34 and 53 cells for PentX and UM respectively, two independent experiments).
Figure 2
Figure 2
SIF1 and rFc remain on PM and do not recruit Syk. (A) Molecular structure cartoons from (6). (B) Representative Hi-Lo images of Fc-AF488 constructs (100 µg/ml) and Syk-mScarlet distribution within 15 min. of exposure of differentiated THP-1 cells to Fc constructs (scale bar, 5µm). (C) Quantification of Fc-AF488 molecules and Syk-mScarlet localization within 15 min. post treatment (error bars = standard deviation, n=21 cells rFc, 16 cells SIF1, 14 cells across 3 experiments). Cells were categorized as exhibiting Fc and Syk localization at either the plasma membrane or intracellular, typically within distinct vesicles. Cells could show both localizations. (D) Representative Hi-Lo images of Fc-AF488 constructs (100 µg/ml) and Syk-mScarlet distribution between 16 min. and 30 min. of Fc treatment of differentiated THP-1 cells (scale bar, 5µm). (E) Data taken on cells within 16–30 min of Fc treatment were quantified in the same way as panel (C) (error bars = standard deviation, n=35 cells rFc, 35 cells SIF1, 33 cells across three experiments).
Figure 3
Figure 3
Syk is recruited to surface associated IgG bound FcγR, but not those docked with low Fc valencies. (A) TIRF imaging of intense Syk-mScarlet recruitment during frustrated phagocytosis by a THP-1 cell of SLB presenting AF647-IgG. Note that too many Syk-mScarlet molecules are recruited for single molecule detection. Image is representative of 20+ cells. Scale bar is 5µm. (B) Single particle detections of Syk-mScarlet molecules on the surface of cells docked with AF488-Fc molecules (100 µg/ml rFc, SIF1, or PentX). Scale bar is 5µm. (C) The frequency of Syk-mScarlet detections observed. No statistical significant difference. Data represents 10 rFc-treated cells, 20 SIF1-treated cells, and 20 PentX-treated cells from a single day that represents results of two experiments. Bars are mean +/- standard error of the mean. (D) Wild-type and Syk-KO FLMs exposed to DL594-rFc, SIF1 or PentX. Scale bar is 5µm. (E) Quantification of localization frequencies of DL594-rFc, SIF1, or PentX in WT and Syk-KO FLMs. ~150 cells/condition from two independent experiments. Error bars are standard deviation. (F) Antibody dependent phagocytosis of IgG-sRBC labeled with AF647 by WT, Syk-KO, and Syk-KO+Syk-mScarlet expressing FLMs. Scale bar is 10µm. (G) Quantification of the frequency of macrophages internalizing 5 or more IgG-sRBC. ~120 cells/condition. Error bars are standard deviation.
Figure 4
Figure 4
Motion analysis of Fc molecules docked to FcγR. (A) SPT tracks following analysis with DC-MSS, from TIRF imaging of THP-1 cells treated with 100 μg/ml rFc, SIF1 or Pentx, color coded by motion class. Note that transitions in track classifications (e.g. confined to free) can be observed within single tracks. All scale bars represent 2µm. (B) The average diffusion coefficient for each cell by diffusion class. (C) The percentage of tracks for each diffusion class. Data in panels A–C are from 22 rFc treated cell, 21 SIF1 treated cells, and 17 PentX treated cells from a single day experiment but are representative of multiple replicates. (D) Representative SPT tracks of THP-1 cells treated with fluorescently labeled Fc molecules and attached to supported lipid bilayers displaying cycloRGD, at sub-activating/inhibiting doses of 0.7 nM (0.03 µg/ml rFc, 0.11 µg/ml SIF1, and 0.17 µg/ml PentX). All scale bars represent 2µm. (E) The average diffusion coefficient for each cell plotted by diffusion class at 0.7 nM. (F) The percentage of tracks for each diffusion at 0.7nM. Data from panels (D–F) are from 24 rFc treated cells, 22 SIF1 treated cells, and 22 PentX treated cells taken across three different experiments. Red bars are the mean +/- standard error of the mean. Significance was calculated using Tukey’s one-way ANOVA where (*P < 0.05, **P < 0.005, *** < 0.0005).
Figure 5
Figure 5
Multicolor imaging of Fc molecules indicates an absence of FcγR superclustering. (A, B) Montages of cells treated with AF488 and DL594-labeled rFc (A), SIF1 (B), PentX (C) at 33 µg/ml and imaged with a time-lapse of 40 s. Scale bar is 5µm. (D) Montage illustrating path crossing of a green and red SIF1 molecules (arrows). Scale bar is 5 µm. (E) Co-association and disappearance of red and green PentX, indicating a putative endocytic event. Scale bar is 5 µm.
Figure 6
Figure 6
Fc receptors are not substantially preclustered and remain in small, mobile clusters upon binding multivalent Fcs. (A) Schematic of Fc-FcγR groupings and the resulting intensities of sub-resolution clusters. (B) Representative images of cells treated with 0.4 μM Fc molecule (Scale bar, 5 µm). (C) Zoom of the red region in B displaying individual detections of fluorescence spots. (D) Frequency of fluorescence of Fc molecules at 0.4 μM. Data is taken from 14 cells treated with rFc, 14 cells treated with SIF1, and 13 cells treated with PentX. (E) Example of stepwise photobleaching of rFc-DL594 over 200 frames taken 0.22 s apart. The rFc-DL594 was kept at 10 µg/ml to be able to track while, the rFc-AF488 was at 100 µg/ml to ensure cells remained at saturating levels. Scale bar represents 2µm. (F) Top: chymograph of single fluorophore bleach event from (E) example. Bottom: Intensity over time (frames) of bleached track. (G) Top: chymograph of multistep/fluorophore bleach event. Bottom: Intensity over time (frames) of the above chymograph. (H) Average amplitude of individual spots per cell taken over the first four frames of 100 µg/ml and 0.01 µg/ml dose multivalent Fc SPT data. (I–J) Histograms of single spots amplitudes averaged over 4 frames for all tracks for 0.01 µg/ml (I) and 100 µg/ml conditions (J).
Figure 7
Figure 7
Proposed mechanisms of spatio-temporal FcγR activation and Syk recruitment by multivalent-Fc molecules. IC-IgG : FcγR clusters at the plasma membrane with a valency of more than five Fc domains undergo Syk recruitment and activation at the cells surface. IC : FcγR clusters with a valency of five or fewer do not robustly recruit Syk to the plasma membrane and are unable to fully activate at the cell surface. However, at the valency of five, in a pentameric geometry, FcγR clusters are endocytosed and recruit Syk at the endosome. Molecules with less than 5 Fc domains can engage FcγRs at the cell surface but cannot recruit Syk. Created with BioRender.com.

Similar articles

Cited by

References

    1. Nimmerjahn F, Ravetch JV. Fcγ receptors as regulators of immune responses. Nat Rev Immunol (2008) 8:34. 10.1038/nri2206 - DOI - PubMed
    1. Li X, Kimberly RP. Targeting the Fc receptor in autoimmune disease. Expert Opin Ther Targets (2014) 18(3):335–50. 10.1517/14728222.2014.877891 - DOI - PMC - PubMed
    1. Cojocaru M, Cojocaru IM, Silosi I, Vrabie CD. Manifestations of systemic lupus erythematosus. Maedica (2011) 6(4):330–6. - PMC - PubMed
    1. Murphy KW. Casey, Janeway"s Immunology. Vol. 9 Vol. 924. New York and London: Garland Science Taylor and Francis Group; (2017).
    1. Ushio A, Arakaki R, Yamada A, Saito M, Tsunematsu T, Kudo Y, et al. . Crucial roles of macrophages in the pathogenesis of autoimmune disease. World J Immunol (2017) 7(1):1–8. 10.5411/wji.v7.i1.1 - DOI

Publication types

MeSH terms