Clinical Trial
. 2021 Feb 18:12:631226.
doi: 10.3389/fimmu.2021.631226. eCollection 2021.

Inflammation and Antiviral Immune Response Associated With Severe Progression of COVID-19

Affiliations
Clinical Trial

Inflammation and Antiviral Immune Response Associated With Severe Progression of COVID-19

Qiong Zhang et al. Front Immunol. .

Abstract

Coronavirus disease-2019 (COVID-19) is a novel respiratory disease induced by severe acute respiratory syndrome coronavirus 2 (SARS-CoV-2). It remains poorly understood how the host immune system responds to the infection during disease progression. We applied microarray analysis of the whole genome transcriptome to peripheral blood mononuclear cells (PBMCs) taken from severe and mild COVID-19 patients as well as healthy controls. Functional enrichment analysis of genes associated with COVID-19 severity indicated that disease progression is featured by overactivation of myeloid cells and deficient T cell function. The upregulation of TLR6 and MMP9, which promote the neutrophils-mediated inflammatory response, and the downregulation of SKAP1 and LAG3, which regulate T cells function, were associated with disease severity. Importantly, the regulation of these four genes was absent in patients with influenza A (H1N1). And compared with stimulation with hemagglutinin (HA) of H1N1 virus, the regulation pattern of these genes was unique in PBMCs response to Spike protein of SARS-CoV-2 ex vivo. Our data also suggested that severe SARS-CoV-2 infection largely silenced the response of type I interferons (IFNs) and altered the proportion of immune cells, providing a potential mechanism for the hypercytokinemia. This study indicates that SARS-CoV-2 infection impairs inflammatory and immune signatures in patients, especially those at severe stage. The potential mechanisms underpinning severe COVID-19 progression include overactive myeloid cells, impaired function of T cells, and inadequate induction of type I IFNs signaling.

Keywords: COVID-19; SARS-CoV-2; T cells; immune response; inflammation; interferons; myeloid cells; transcriptome.


Conflict of interest statement

The authors declare that the research was conducted in the absence of any commercial or financial relationships that could be construed as a potential conflict of interest.

Figures

Figure 1
Figure 1
Description of microarray based global gene expression profiles. (A) Results of a principal components analysis (PCA) on the expression levels of the global transcriptional genes derived from PBMC samples from all participants. Factor scores are plotted for each participant, with colors differentiating members of the mild, severe patient groups and the healthy control (HC) group. (B) Clustered heatmap depicting the expression levels of global genes in the mild and severe patients groups and the HC group. Each row represents a separate gene and each column represents a separate individual. (C) Venn diagrams of upregulated or downregulated DEGs in mild, severe and HC groups. The diagrams indicate the numbers of DEGs shared or unique between pairs of groups. (D) The enrichment of pathways in severe versus HC and mild versus HC was performed by GSEA. The top enriched pathways are shown (adjusted p-value<0.1).
Figure 2
Figure 2
Significant alteration of inflammation- and antiviral immune response-associated biological processes during the COVID-19 course. (A) Stacked bar diagram depicting the categories of major biological processes enriched in DEGs, as identified with GO analysis (p-value ≤ 0.001), for severe versus healthy control (HC) and mild versus HC group comparisons. (B) Composition of the categories of major biological processes enriched in DEGs in the severe group. The enriched biological process terms were determined using the threshold p-value ≤ 0.01. (C–E), Bar charts depicting enrichment of the top immune related-biological processes for the DEGs which are specifically upregulated in the severe group (C), incrementally upregulated across severity groups (D), or incrementally downregulated across severity groups (E). The enriched biological process terms were determined with using threshold p-value ≤ 0.01.
Figure 3
Figure 3
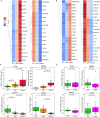
Expression of DEGs specifically enriched in biological processes of immune response associated with severe progression of COVID-19. (A) Heatmaps depicting the expression of incrementally upregulated or downregulated DEGs involved in immune and inflammation processes. (B) Heatmaps representing the expression of immune- and inflammation-associated DEGs specifically upregulated or downregulated in the severe group. (C, D) The results of the validation of relative mRNA expression of TLR6, SKAP1, MMP9, and LAG3 conducted by RT-qPCR in COVID-19 patients (C) or H1N1 patients (D), compared with HCs. GAPDH expression was used for normalization. The box plots present the relative normalized intensity scaled by the mean value of the HC group. 50% interquartile ranges are shown in box plots. The medians of each group are denoted as the horizontal lines in the boxes. The excluded outliers are marked as dots. The maximum and minimum values excluding outliers are presented as whiskers. p-values were calculated using the Mann-Whitney U test.
Figure 4
Figure 4
The regulation of LAG3, SKAP1, TLR6, and MMP9 by Spike-ECD, but not HA ex vivo. (A, B) PBMCs from healthy donors were combined with Spike-ECD (A) or HA (B) at a concentration of 0, 25, 50, or 100 ng/ml for 12 h. Cells were then harvested and the expression of indicated genes was measured by RT-qPCR. GAPDH expression was used for normalization. n = 3 independent experiments. Data are presented as mean ± S.D. p-values were calculated using a one-way ANOVA for multiple comparison.
Figure 5
Figure 5
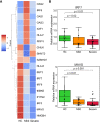
Muted response of the type I interferons (IFNs) signaling associated with severe progression of COVID-19. (A) The expression level of downregulated DEGs involved in IFN secretion (GO:1902741) or responding to type I IFNs (GO:0034340). (B) The relative mRNA expression of indicated genes was validated by RT-qPCR in the validated cohort. GAPDH expression was used for normalization. p-values were calculated using the Mann-Whitney U test.
Figure 6
Figure 6
Leukocyte composition evaluated by CIBERSORT based on gene expression. (A) Stacked bar diagram showing the proportions of nine different types of immune cells in patients and HCs. Each bar represents an individual. (B) Immune cell fractions were determined for each group. The relative normalized intensity was scaled by the mean value of the HC group. p-values were calculated using the Mann-Whitney U test.

Similar articles

Cited by

References

    1. Berlin DA, Gulick RM, Martinez FJ. Severe Covid-19. New Engl J Med (2020) 383(25):2451–60. 10.1056/NEJMcp2009575 - DOI - PubMed
    1. Huang C, Wang Y, Li X, Ren L, Zhao J, Hu Y, et al. . Clinical features of patients infected with 2019 novel coronavirus in Wuhan, China. Lancet (2020) 395(10223):497–506. 10.1016/S0140-6736(20)30183-5 - DOI - PMC - PubMed
    1. Wang D, Hu B, Hu C, Zhu F, Liu X, Zhang J, et al. . Clinical Characteristics of 138 Hospitalized Patients With 2019 Novel Coronavirus-Infected Pneumonia in Wuhan, China. JAMA (2020) 323(11):1061–9. 10.1001/jama.2020.1585 - DOI - PMC - PubMed
    1. Teijaro JR, Walsh KB, Rice S, Rosen H, Oldstone MB. Mapping the innate signaling cascade essential for cytokine storm during influenza virus infection. Proc Natl Acad Sci U S A (2014) 111(10):3799–804. 10.1073/pnas.1400593111 - DOI - PMC - PubMed
    1. Tate MD, Brooks AG, Reading PC. The role of neutrophils in the upper and lower respiratory tract during influenza virus infection of mice. Respir Res (2008) 9:57. 10.1186/1465-9921-9-57 - DOI - PMC - PubMed

Publication types

MeSH terms