. 2021 Feb 19:12:635825.
doi: 10.3389/fimmu.2021.635825. eCollection 2021.

Use of Flow Cytometry to Evaluate Phagocytosis of Staphylococcus aureus by Human Neutrophils

Affiliations

Use of Flow Cytometry to Evaluate Phagocytosis of Staphylococcus aureus by Human Neutrophils

Elena Boero et al. Front Immunol. .

Abstract

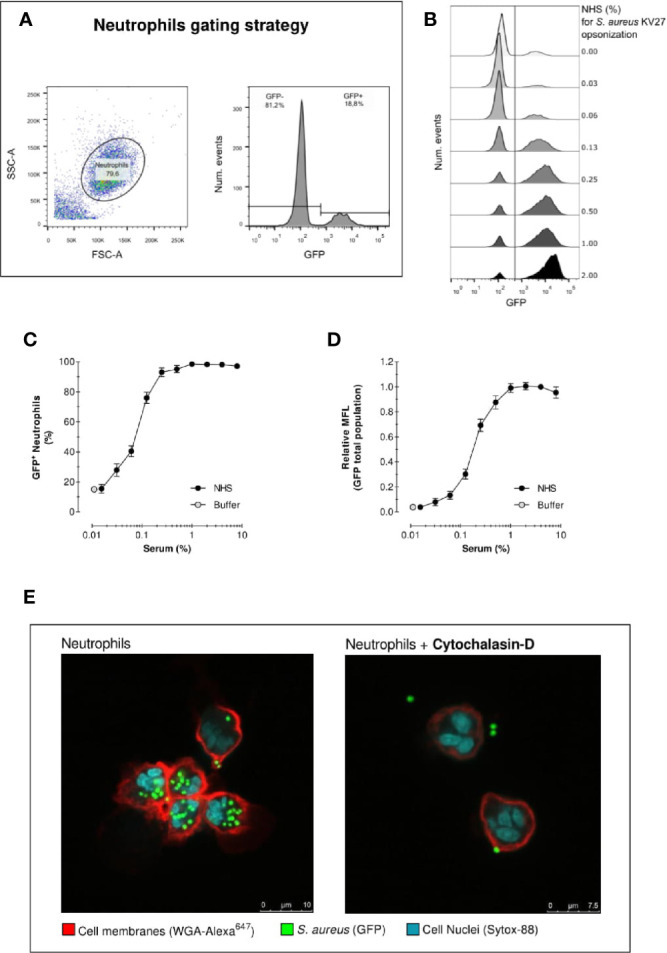
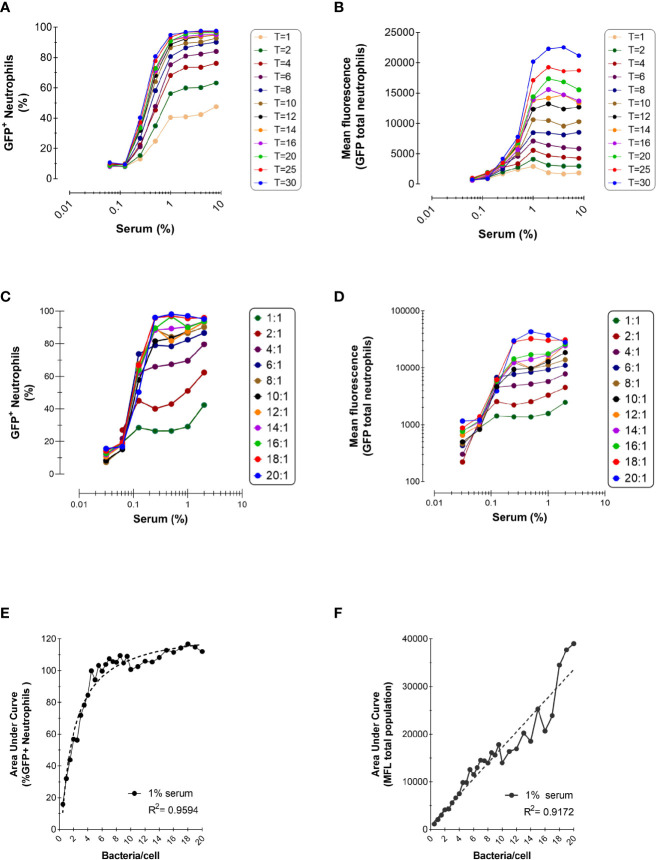
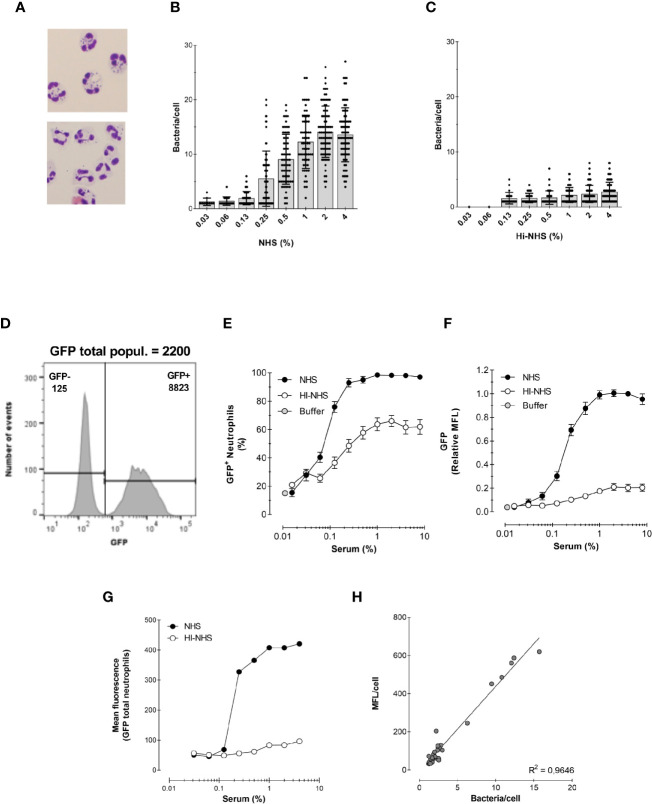
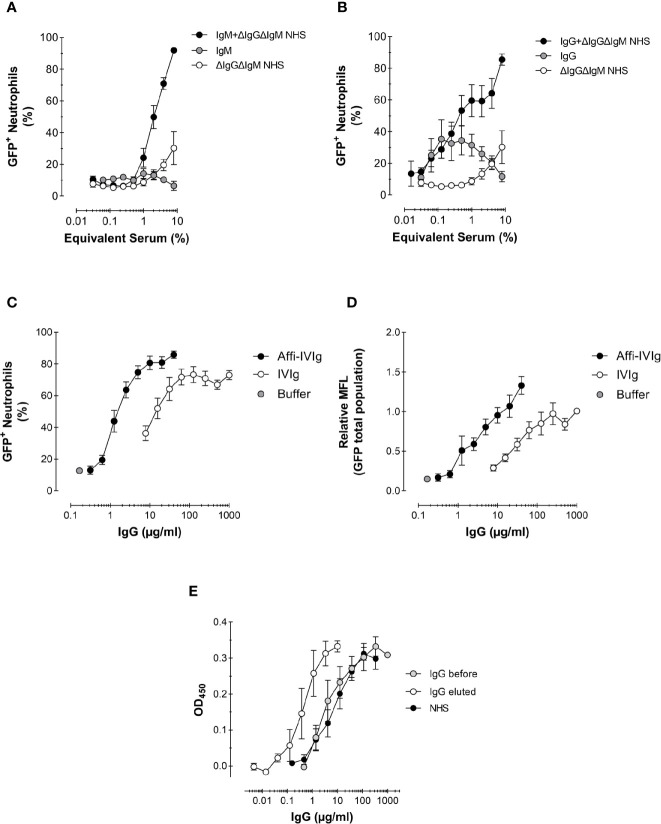
Neutrophils play a key role in the human immune response to Staphylococcus aureus infections. These professional phagocytes rapidly migrate to the site of infection to engulf bacteria and destroy them via specialized intracellular killing mechanisms. Here we describe a robust and relatively high-throughput flow cytometry assay to quantify phagocytosis of S. aureus by human neutrophils. We show that effective phagocytic uptake of S. aureus is greatly enhanced by opsonization, i.e. the tagging of microbial surfaces with plasma-derived host proteins like antibodies and complement. Our rapid assay to monitor phagocytosis can be used to study neutrophil deficiencies and bacterial evasion, but also provides a powerful tool to assess the opsonic capacity of antibodies, either in the context of natural immune responses or immune therapies.

Keywords: Staphylococcus aureus; flow cytometry; human; neutrophils; phagocytosis.


Conflict of interest statement

EB is participating in a post-graduate studentship program at GSK. The remaining authors declare that the research was conducted in the absence of any commercial or financial relationships that could be construed as a potential conflict of interest.

Figures

Figure 1
Figure 1
Acquisition of phagocytosis assay by flow cytometry. Acquisition of neutrophil phagocytosis of S. aureus KV27 opsonized with normal human serum (NHS) at a 10:1 bacteria-to-cell ratio after 15 min incubation. (A) Gating of PMNs in the linear FSC and SSC, required to eliminate cell debris and possible free or clumped bacteria from the analysis (left graph). Representative histogram describing the GFP intensity per number of events. The total population is composed by a percentage of GFP- and GFP+ PMNs (right graph). (B) Typical histogram overlay of the GFP intensity distribution of the total neutrophil population per each concentration point of opsonizing NHS. (C) Phagocytosis expressed as the % of GFP+ neutrophils per increasing % of NHS. Mean ± SEM for n=8–25 (D) Phagocytosis expressed as the Mean Fluorescence (MFL) of neutrophils relative to the MFL obtained with opsonization with 4% NHS. Mean ± SD for n=8–25. (E) Confocal image of S. aureus KV27 (green, GFP) incubated with 4% NHS engulfed by human neutrophils (red, membrane stain WGA-Alexa647 and blue, nuclear stain SYTO-82), control (right image) or treated with actin-blocking agent cytochalasin-D (left image).
Figure 2
Figure 2
Effect of Incubation Time and Bacteria-to-Cells Ratio on Opsonophagocytosis. (A, B) Time-dependent phagocytosis of KV27-GFP in the presence of pooled NHS. Bacteria and PMNs at a 10:1 ratio were incubated at 37°C in tubes and samples were withdrawn for each time point into ice cold formaldehyde to stop the reaction. Data are expressed as % GFP+ PMNs (A) and Mean fluorescence (B). Representative experiment of n=2. (C, D) Phagocytosis of GFP-expressing Newman ΔSpA ΔSbi using different ratios bacteria to neutrophils. Phagocytosis of NHS opsonized bacteria expressed as % GFP+ neutrophils for depicted ratios (C) and as MFL of total neutrophils (D). (E, F) For 1% serum at different ratios, data of % GFP+ neutrophils are fitted to a nonlinear regression curve [least squares fit; GraphPad, Agonist vs. response (three parameters)] (E) and data of total MFL are fitted to a linear regression curve (F). Data pooled from n=2 experiments.
Figure 3
Figure 3
Correlation between microscopy and flow cytometry. (A) Example of cytospin preparation after phagocytosis for 15 min with 1% NHS (top) and 1% HI-NHS (bottom). (B, C) Counting bacteria per neutrophil on cytospin preparations after phagocytosis with NHS (B) and HI-NHS (C). Individual counts and means ± SD (n=25–100) for only neutrophils with bacteria. (D) Representative histogram to show GFP− and GFP+ population and their corresponding MFL value versus their total MFL. (E, F) Flow cytometry analysis of phagocytosis with NHS and HI-NHS shown as % GFP+ neutrophils (E) and relative MFL to 8% NHS (F) for total neutrophil population. (G, H) Representative figure for MFL of only the GFP+ neutrophil population (G) and correlation of that with microscopic counts per cell (H) for n=2 experiments.
Figure 4
Figure 4
Role of antibodies and complement in the phagocytosis of S. aureus. (A, B) Phagocytosis expressed as percentage of GFP+ neutrophils of Newman ΔSpA ΔSbi opsonized with a complement source depleted of antibodies (ΔIgGΔIgM NHS), NHS-purified IgM (A) or IgG (B), or the combination of IgM (A) or IgG (B) reconstituted with complement. For purified IgM the equivalent concentration present in 8% serum is used, 120 µg/ml (A), and for purified IgG that is 1,000 µg/ml (B); these concentrations were also used to reconstitute into 8% ΔIgGΔIgM NHS. Data represent Mean ± SEM for n=2–8. (C, D) Phagocytosis of S. aureus KV27 opsonized with either commercial IgGs for intravenous use (IVIg), or the same IgGs affinity purified on a S. aureus Newman ΔSpA ΔSbi column (Affi-IVIg). Phagocytosis is expressed as the % of GFP+ neutrophils per increasing percentage of IVIgs or Affi-IVIgs. Mean ± SEM for n=7 (C) and as the Mean Fluorescence (MFL) of the total neutrophils engulfing GFP-expressing bacteria (D). Mean ± SEM for n=6. (E) Binding specificity of NHS, IVIg (IgG total) and Affi-IVIg (IgG eluted) antibodies assessed by ELISA, using S. aureus strain Newman ΔSpA ΔSbi. Mean ± SD for n = 2.
Figure 5
Figure 5
No correlation between phagocytosis by NHS versus HI-NHS or complement activity. (A, B) Phagocytosis of individual sera as compared to the same sera present in the pooled NHS expressed as % GFP+ neutrophils for NHS (A) and Heat-Inactivated serum (HI-NHS), without complement activity (B). Representative experiment for 16 individual sera and their pool (NHS) with some color coded for comparison. C–E) AUC value for each individual serum curve expressed relative to NHS phagocytosis (C; n=40), HI-NHS phagocytosis (D; n=37), and CH50 value relative to NHS (E; n=37). (F, G) No correlation between phagocytosis AUC for NHS versus HI-NHS (F) or for phagocytosis versus CH50 for NHS (G) with n=37.
Figure 6
Figure 6
Consistent donor opsonic capacity for multiple S. aureus strains. (A, B) Phagocytosis of different S. aureus strains opsonized with HI-serum of two individual donors chosen from the panel of 37 individual donors. Donor with “Low” (A) and donor with “High” (B) opsonic capacity as determined for Newman ΔSpA ΔSbi were compared with HI-NHS (graph not shown). (C) AUC values for each individual S. aureus curve were ranked in ascending order for HI-NHS as opsonic source. Data are from one experiment using standard 10:1 bacteria to neutrophil ratio and 15 min phagocytosis time and expressed as % GFP+ neutrophils.
Figure 7
Figure 7
Percentage of phagocytosing neutrophils vs. % phagocytosed bacteria. Heat map visualization of both % GFP+ neutrophils (left side panels) and % bacterial phagocytosis (right side panels) for increasing ratios of bacteria to neutrophils. Results for 15 (A, B) and 60 (C, D) min phagocytosis in the presence of increasing concentration NHS and for 60 min phagocytosis in the presence of HI-NHS (E, F). Data are mean values of n=3 experiments, and X are missing data points.

References

    1. Bagnoli F, Rappuoli R. Staphylococcus aureus. Bagnoli F, Rappuoli R, Grandi G, editors. Cham: Springer International Publishing; (2017). 10.1007/978-3-319-72063-0 - DOI
    1. David MZ, Daum RS. Treatment of Staphylococcus aureus infections. In: . Current Topics in Microbiology and Immunology. Switzerland: Springer Verlag; (2017), p. 325–83. 10.1007/82_2017_42 - DOI - PubMed
    1. Missiakas D, Schneewind O. Staphylococcus aureus vaccines: Deviating from the carol. J Exp Med (2016) 213:1645–53. 10.1084/jem.20160569 - DOI - PMC - PubMed
    1. Redi D, Raffaelli CS, Rossetti B, De Luca A, Montagnani F. Staphylococcus aureus vaccine preclinical and clinical development: current state of the art. New Microbiol (2018) 41:208–13. - PubMed
    1. Rigby KM, DeLeo FR. Neutrophils in innate host defense against Staphylococcus aureus infections. Semin Immunopathol (2012) 34:237–59. 10.1007/s00281-011-0295-3 - DOI - PMC - PubMed

Publication types

MeSH terms