Clinical Trial
. 2021 Feb 19:12:643529.
doi: 10.3389/fimmu.2021.643529. eCollection 2021.

Distinct Stromal and Immune Features Collectively Contribute to Long-Term Survival in Pancreatic Cancer

Affiliations
Clinical Trial

Distinct Stromal and Immune Features Collectively Contribute to Long-Term Survival in Pancreatic Cancer

Hassan Sadozai et al. Front Immunol. .

Abstract

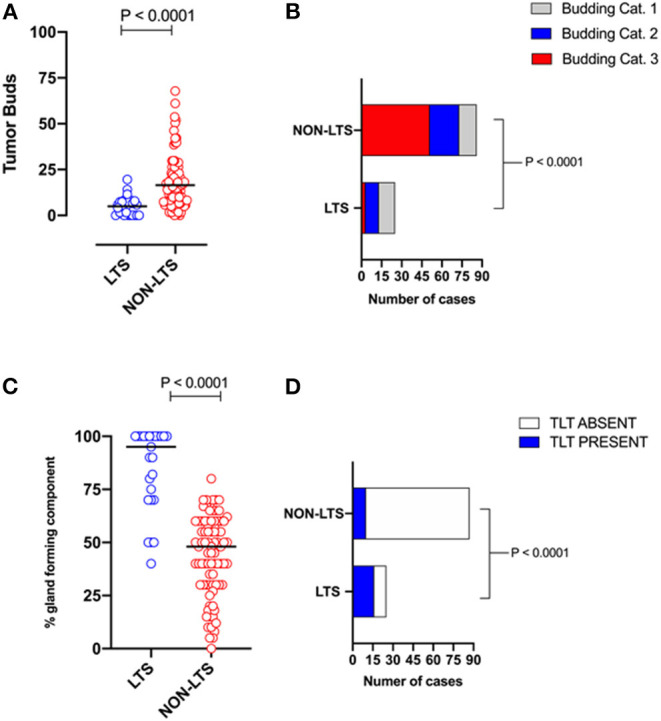
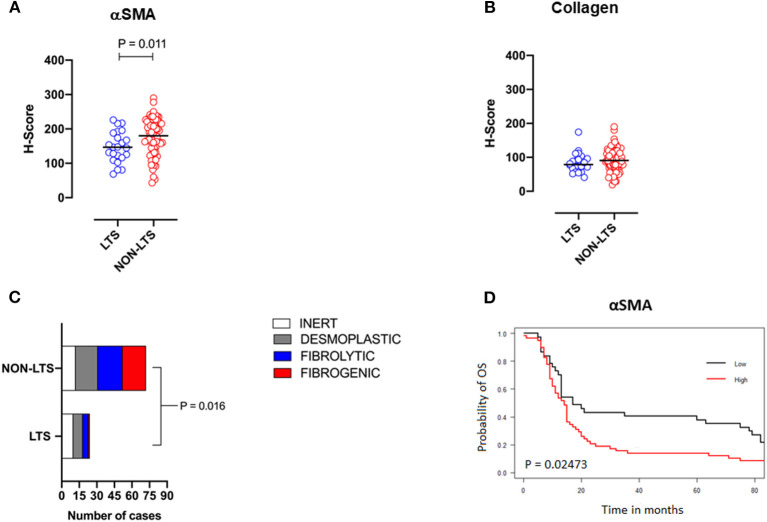
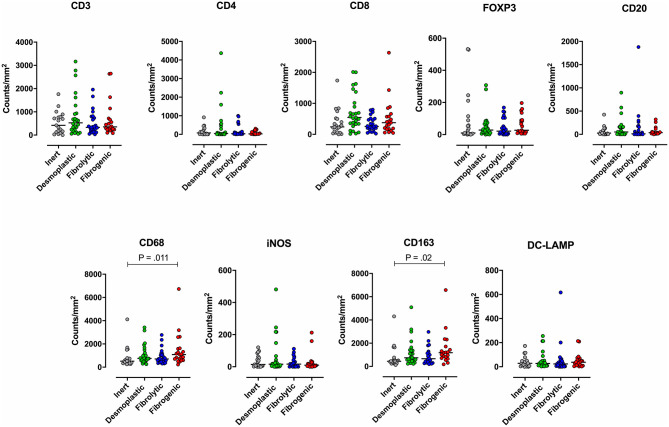
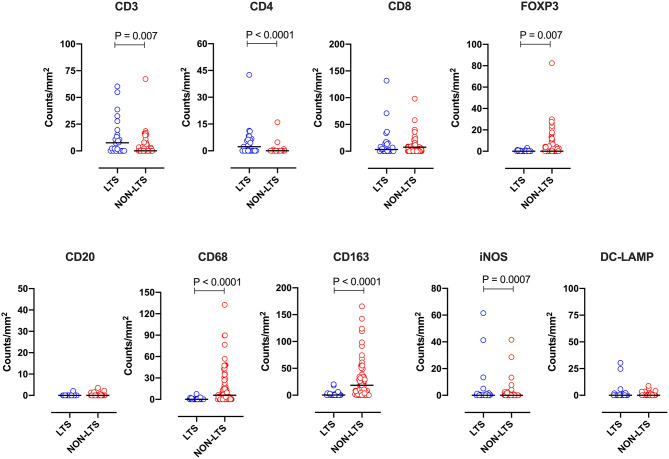
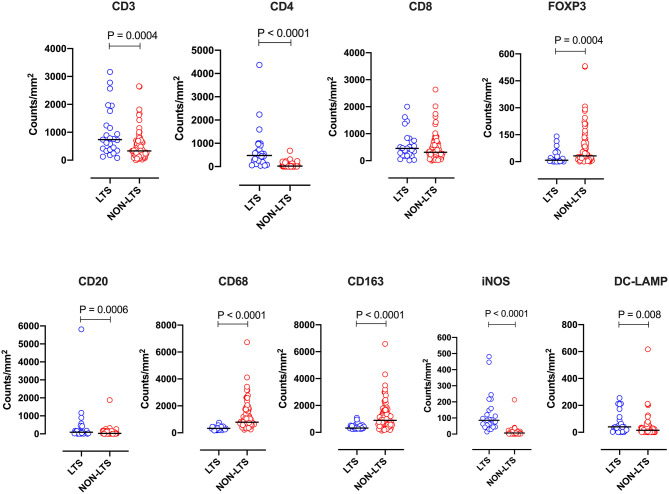
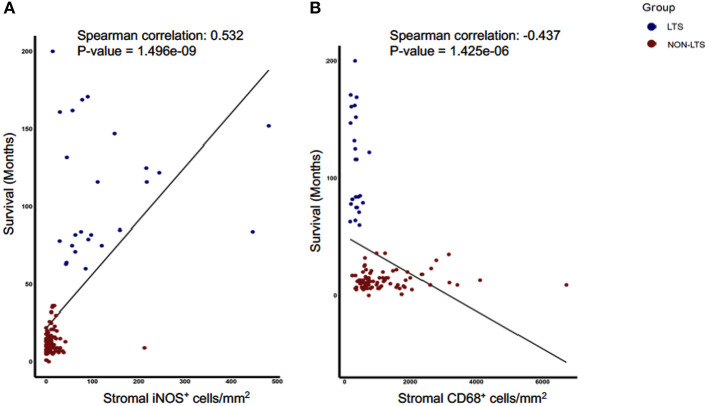
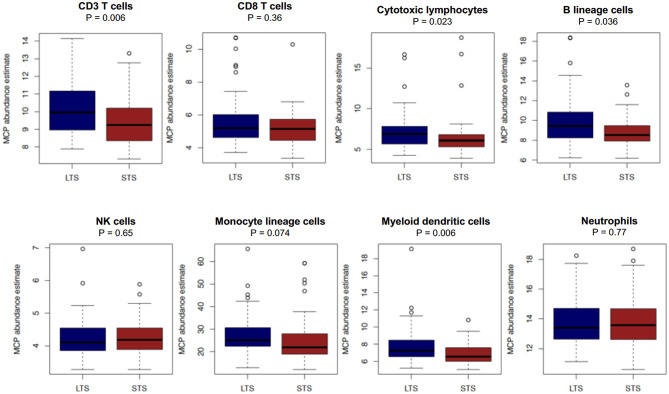
Background: The aggressive biology and treatment refractory nature of pancreatic ductal adenocarcinoma (PDAC) significantly limits long-term survival. Examining the tumor microenvironment (TME) of long-term survivors (LTS) of PDAC offers the potential of unveiling novel biological insights and therapeutic targets. Methods: We performed an integrated approach involving immunophenotyping, stromal scoring and histomorphological profiling of a cohort of 112 PDAC-cases, including 25 long-term survivors (LTSs, OS ≥ 60 months). Mutational frequencies were assessed using targeted next generation sequencing. Finally, we validated our findings in silico using an external cohort of microarray data from PDAC patients. Results: LTS cases exhibit a largely quiescent population of cancer-associated fibroblasts (CAFs). Immune profiling revealed key differences between LTS and NON-LTS cases in the intratumoral and stromal compartments. In both compartments, LTS cases exhibit a T cell inflamed profile with higher density of CD3+ T cells, CD4+ T cells, iNOS+ leukocytes and strikingly diminished numbers of CD68+ total macrophages, CD163+ (M2) macrophages and FOXP3+ Tregs. A large proportion of LTS cases exhibited tertiary lymphoid tissue (TLT) formation, which has been observed to be a positive prognostic marker in a number of tumor types. Using a Random-Forest variable selection approach, we identified the density of stromal iNOS+ cells and CD68+ cells as strong positive and negative prognostic variables, respectively. In an external cohort, computational cell-type deconvolution revealed a higher abundance of T cells, B lymphocytes and dendritic cells (DCs) in patients with long-term OS compared to short-term survivors. Thus, in silico profiling of long-term survivors in an external cohort, strongly corroborated the T cell-inflamed TME observed in our LTS group. Conclusions: Collectively, our findings highlight the prognostic importance of TME profiles in PDAC, underlining the crucial role of tumor associated macrophages (TAMs) and the potential interdependence between immunosuppressive TAMs and activated CAFs in pancreatic cancer. Additionally, our data has potential for precision medicine and patient stratification. Patients with a T cell inflamed TME might derive benefit from agonistic T cell antibodies (e.g., OX40 or CD137 agonists). Alternately, patients with activated CAFs and high infiltration of immunosuppressive TAMs are highly likely to exhibit therapeutic responses to macrophage targeted drugs (e.g., anti-CSF1R) and anti-CAF agents.

Keywords: PDAC–pancreatic ductal adenocarcinoma; cancer associated fibroblast (CAF); long term survival; tumor associated macrophage (TAM); tumor microenvironment (TME).


Conflict of interest statement

The authors declare that the research was conducted in the absence of any commercial or financial relationships that could be construed as a potential conflict of interest.

Figures

Figure 1
Figure 1
LTS cases exhibit distinct histopathological characteristics. (A) Scatterplot depicting the distribution of tumor buds in LTS vs. NON-LTS cases. Mann-Whitney U-test was used to determine differences between groups. Each symbol denotes an individual patient. The bars denote median values for each group. (B) Bar-graphs showing the distribution of tumor budding categories in LTS and NON-LTS patients. Statistical comparisons were performed using Chi-Square test. (C) Scatterplot depicting the distribution of gland-forming component (as a percentage) in LTS vs. NON-LTS cases. Mann-Whitney U-test was used to determine differences between groups. Each symbol denotes an individual patient. The bars denote median values for each group. (D) Bar-graphs depicting the number of cases exhibiting presence or absence of tertiary lymphoid tissue (TLT) in LTS and NON-LTS patients. Statistical comparisons were performed using Fisher's exact test.
Figure 2
Figure 2
Stromal subtyping of the TME. (A) Scatterplots depicting H-Scores for αSMA staining (IHC) in LTS vs. NON-LTS groups. (B) Scatterplots depicting H-Scores for Collagen staining (Masson's trichrome) in LTS vs. NON-LTS cases. Mann-Whitney U test was used to determine differences between groups. Each symbol denotes an individual patient. The bars denote median values for each group. (C) Barplots depicting number of cases belonging to each stromal subtype (inert, desmoplastic, fibrolytic and fibrogenic) in LTS vs. NON-LTS patients. Statistical comparisons were performed using Chi-square test. (D) Kaplan-Meier curve showing the correlation of αSMA values with overall survival (OS). Statistical comparisons were performed using log-rank test.
Figure 3
Figure 3
Immune contexture across stromal subtypes. Scatterplots representing the distribution of leukocyte density (counts/mm2) in the stromal compartment of PDAC cases exhibiting distinct stromal subtypes (Inert, Desmoplastic, Fibrolytic, Fibrogenic). Each symbol denotes an individual patient. The bars denote median values for each group. Differences between groups were analyzed by Kruskal-Wallis tests followed by Dunn's post-hoc test. Multiplicity adjusted P-values are reported.
Figure 4
Figure 4
Intratumoral (IT) immune contexture. Scatterplots displaying the distribution of intratumoral leukocyte density (counts/mm2) for LTS cases and NON-LTS cases. Each symbol denotes an individual patient. The bars denote median values for each group. Differences between LTS and NON-LTS groups were analyzed using the Mann-Whitney U test.
Figure 5
Figure 5
Stromal (S) immune contexture. Scatterplots displaying the distribution of stromal leukocyte density (counts/mm2) for LTS cases and NON-LTS cases. Each symbol denotes an individual patient. The bars denote median values for each group. Differences between LTS and NON-LTS groups were analyzed using Mann-Whitney U test.
Figure 6
Figure 6
Principal Component Analysis (PCA) demonstrates distinct immune landscape in LTS vs. NON-LTS samples. PCA performed using (A) stromal and (B) intratumoral immune cell densities show distinct clustering of LTS vs. NON-LTS patient groups. Each symbol denotes an individual patient and 95% confidence ellipses are drawn. The percent variation is explained by first principal component (PC1, x-axis) and the second principal component −2 (PC2, y-axis).
Figure 7
Figure 7
Stromal densities of iNOS and CD68 positive cells display strongest association with survival using Random Forest variable selection. Scatterplots demonstrating association between stromal density and survival for (A) iNOS+ cells, and (B) CD68+ cells. Each symbol represents an individual patient. Both the features are significantly (P < 0.05) associated with OS (months). Spearman correlation and P-values are plotted.
Figure 8
Figure 8
Comparison of immune cell abundance between LTS and STS cases in silico. Boxplots demonstrating the distribution of abundance scores for 8 leukocyte subsets as computed by the MCP-Counter method in LTS (n = 58) vs. STS (n = 58) samples in an external cohort of PDAC cases. The following cell types were quantified CD3+ T cells (Pan T cells), CD8+ T cells, cytotoxic lymphocytes, B lineage cells, NK cells, monocytic lineage cells, myeloid dendritic cells and neutrophils. Differences between groups were analyzed using the Mann-Whitney U test.

Similar articles

Cited by

References

    1. Kamisawa T, Wood LD, Itoi T, Takaori K. Pancreatic cancer. Lancet. (2016) 388:73–85. 10.1016/S0140-6736(16)00141-0 - DOI - PubMed
    1. Rahib L, Smith BD, Aizenberg R, Rosenzweig AB, Fleshman JM, Matrisian LM. Projecting cancer incidence and deaths to 2030: the unexpected burden of thyroid, liver, and pancreas cancers in the united states. Cancer Res. (2014) 74:2913–21. 10.1158/0008-5472.CAN-14-0155 - DOI - PubMed
    1. Serrano PE, Cleary SP, Dhani N, Kim PTW, Greig PD, Leung K, et al. . Improved long-term outcomes after resection of pancreatic adenocarcinoma: a comparison between two time periods. Ann Surg Oncol. (2015) 22:1160–7. 10.1245/s10434-014-4196-2 - DOI - PubMed
    1. Keck T, Wellner UF, Bahra M, Klein F, Sick O, Niedergethmann M, et al. . Pancreatogastrostomy vs. pancreatojejunostomy for RECOnstruction after PANCreatoduodenectomy (RECOPANC, DRKS 00000767). Ann Surg. (2016) 263:440–9. 10.1097/SLA.0000000000001240 - DOI - PMC - PubMed
    1. Conroy T, Hammel P, Hebbar M, Ben Abdelghani M, Wei AC, Raoul J-L, et al. . FOLFIRINOX or gemcitabine as adjuvant therapy for pancreatic cancer. N Engl J Med. (2018) 379:2395–406. 10.1056/NEJMoa1809775 - DOI - PubMed

Publication types