. 2021 Feb 17:12:646523.
doi: 10.3389/fimmu.2021.646523. eCollection 2021.

Systematic Pan-Cancer Analysis Identifies TREM2 as an Immunological and Prognostic Biomarker

Affiliations

Systematic Pan-Cancer Analysis Identifies TREM2 as an Immunological and Prognostic Biomarker

Xin Cheng et al. Front Immunol. .

Abstract

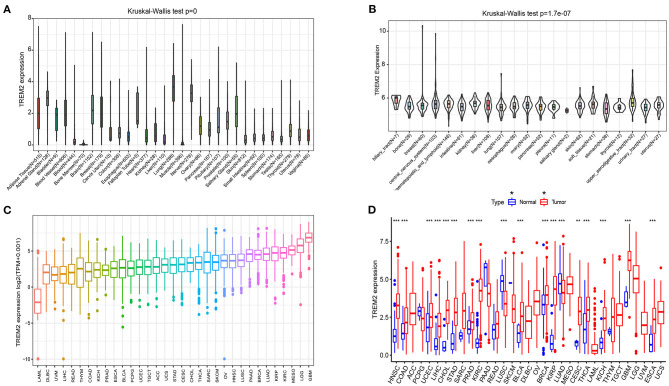
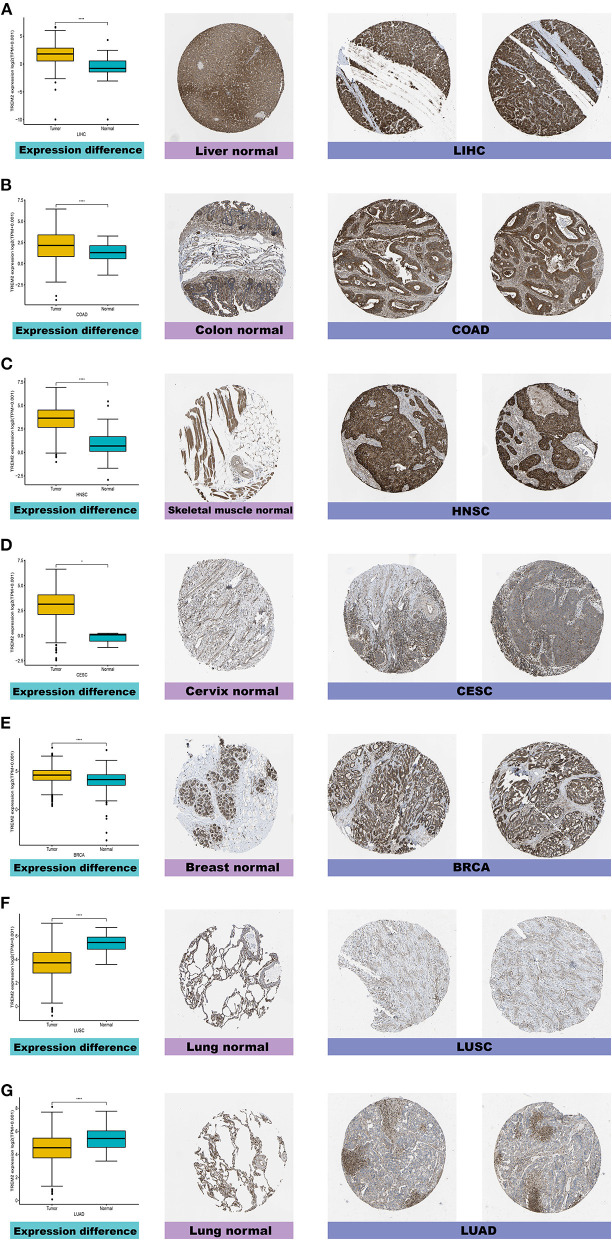
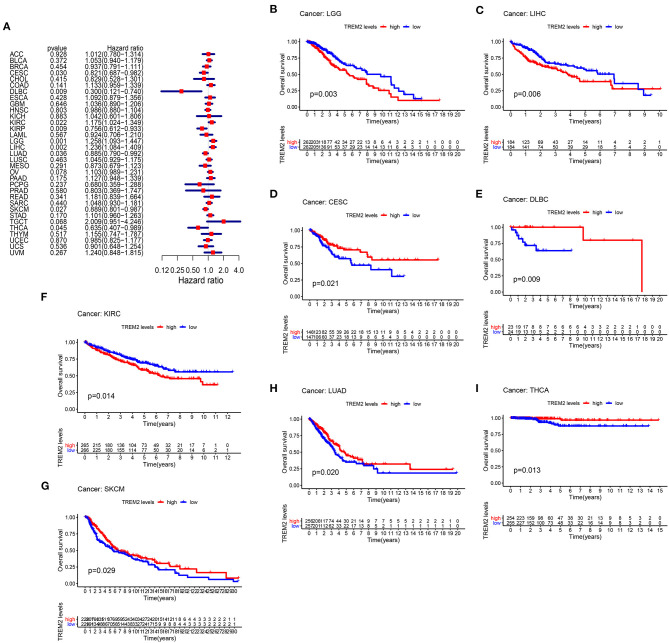
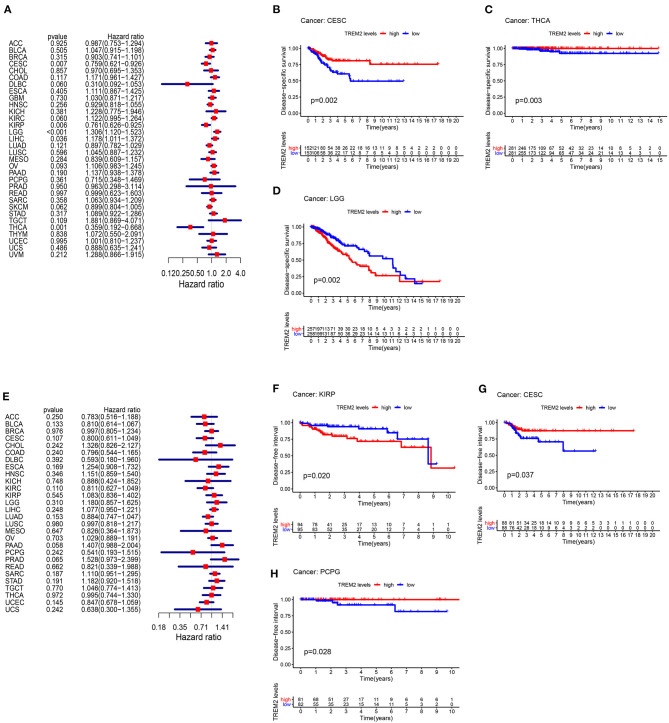
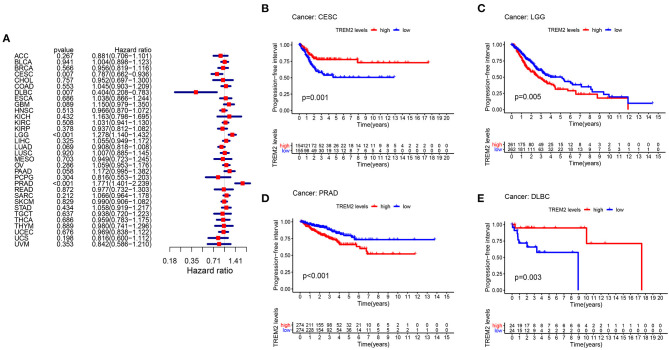
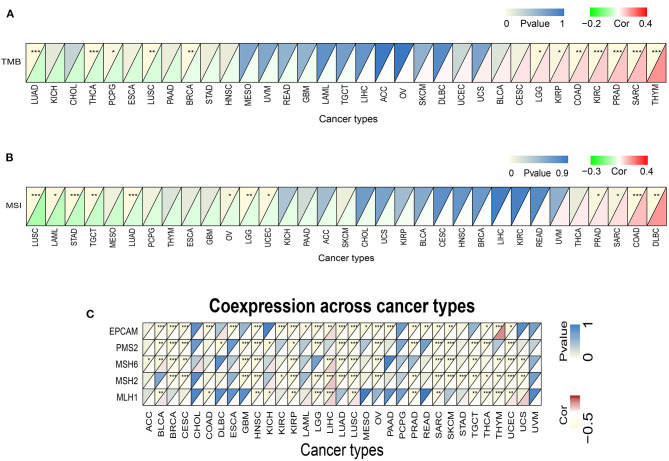
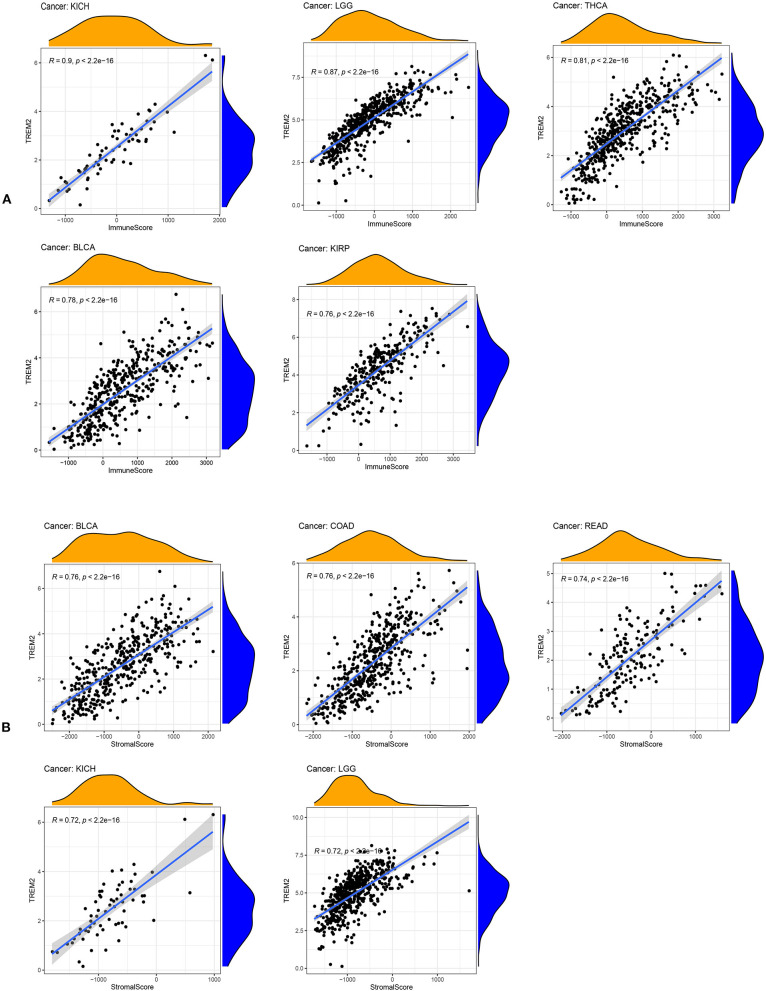
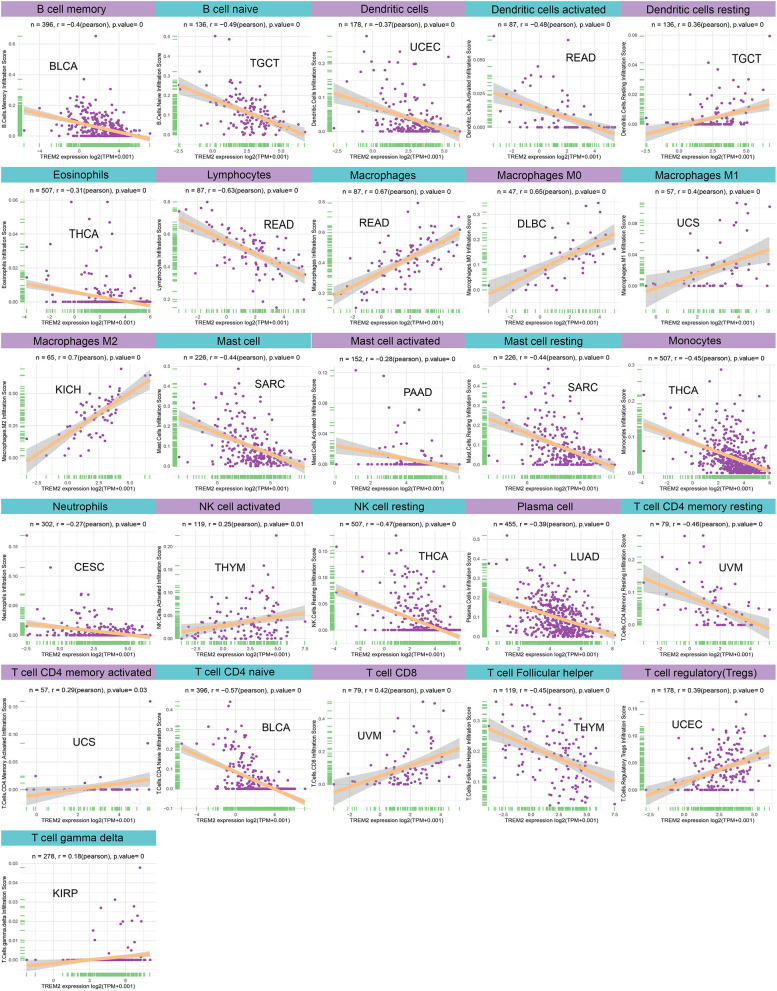
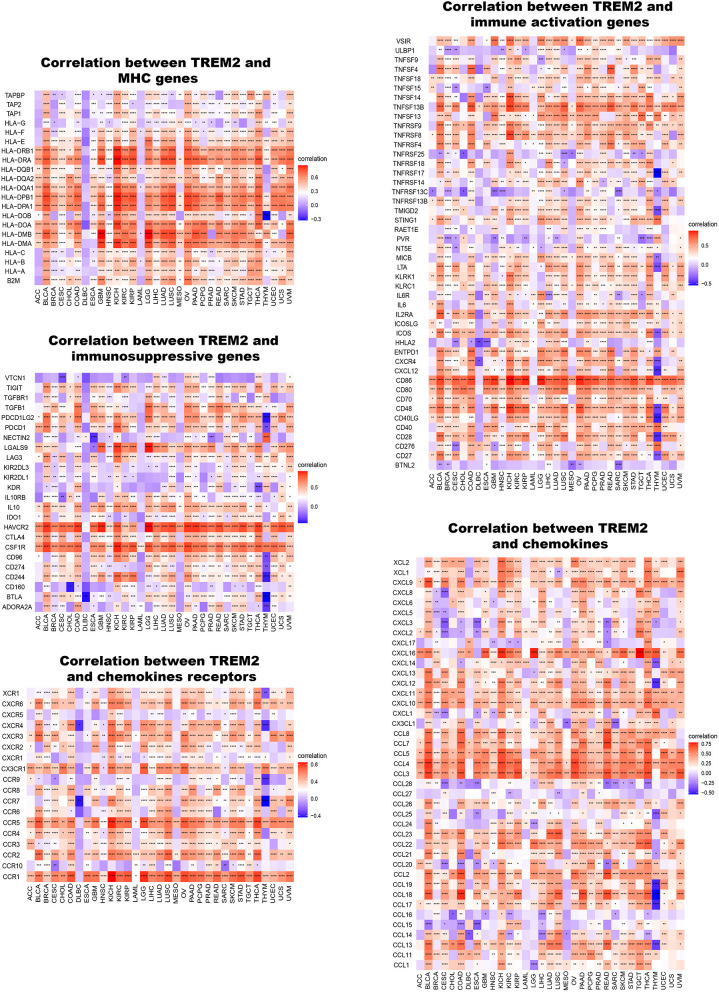
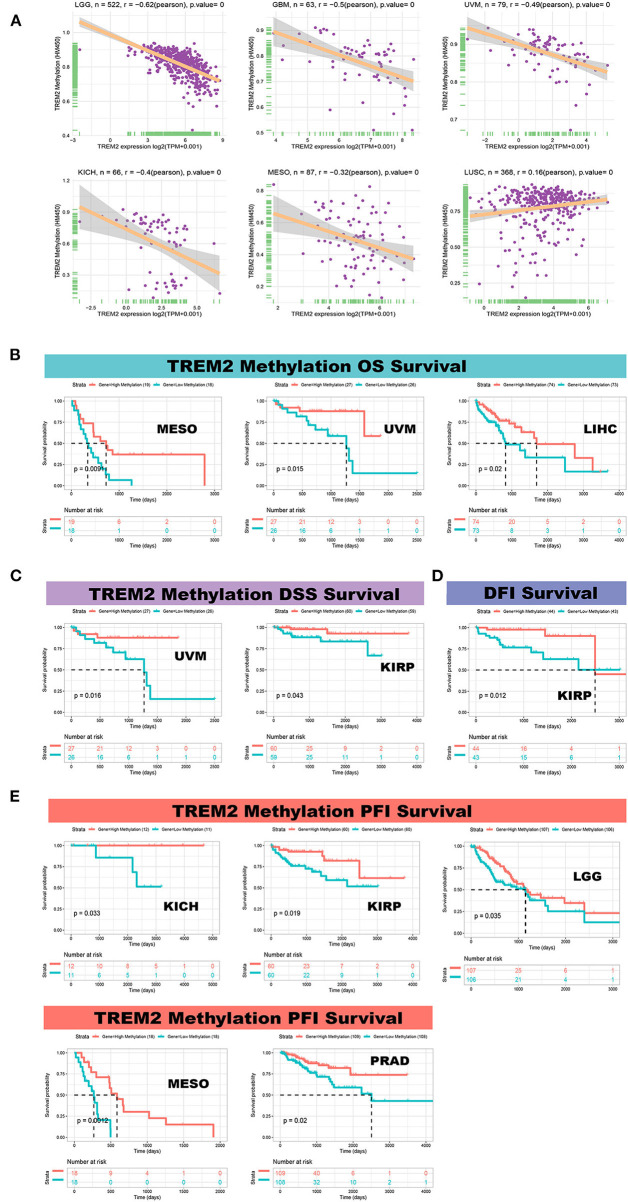
Triggering receptor expressed on myeloid cells-2 (TREM2) is a transmembrane receptor of the immunoglobulin superfamily and a crucial signaling hub for multiple pathological pathways that mediate immunity. Although increasing evidence supports a vital role for TREM2 in tumorigenesis of some cancers, no systematic pan-cancer analysis of TREM2 is available. Thus, we aimed to explore the prognostic value, and investigate the potential immunological functions, of TREM2 across 33 cancer types. Based on datasets from The Cancer Genome Atlas, and the Cancer Cell Line Encyclopedia, Genotype Tissue-Expression, cBioPortal, and Human Protein Atlas, we employed an array of bioinformatics methods to explore the potential oncogenic roles of TREM2, including analyzing the relationship between TREM2 and prognosis, tumor mutational burden (TMB), microsatellite instability (MSI), DNA methylation, and immune cell infiltration of different tumors. The results show that TREM2 is highly expressed in most cancers, but present at low levels in lung cancer. Further, TREM2 is positively or negatively associated with prognosis in different cancers. Additionally, TREM2 expression was associated with TMB and MSI in 12 cancer types, while in 20 types of cancer, there was a correlation between TREM2 expression and DNA methylation. Six tumors, including breast invasive carcinoma, cervical squamous cell carcinoma and endocervical adenocarcinoma, kidney renal clear cell carcinoma, lung squamous cell carcinoma, skin cutaneous melanoma, and stomach adenocarcinoma, were screened out for further study, which demonstrated that TREM2 gene expression was negatively correlated with infiltration levels of most immune cells, but positively correlated with infiltration levels of M1 and M2 macrophages. Moreover, correlation with TREM2 expression differed according to T cell subtype. Our study reveals that TREM2 can function as a prognostic marker in various malignant tumors because of its role in tumorigenesis and tumor immunity.

Keywords: MSI; TMB; TREM2; immune infiltration; pan-cancer; prognosis.


Conflict of interest statement

The authors declare that the research was conducted in the absence of any commercial or financial relationships that could be construed as a potential conflict of interest.

Figures

Figure 1
Figure 1
Differential expression of TREM2. (A) TREM2 expression in normal tissues. (B) TREM2 expression in tumor cell lines. (C) TREM2 expression in 33 types of cancer. (D) Comparison of TREM2 expression between tumor and normal samples. *P < 0.05, **P < 0.01, ***P < 0.001.
Figure 2
Figure 2
Comparison of TREM2 gene expression between normal and tumor tissues (left) and immunohistochemistry images in normal (middle) and tumor (right) tissues. TREM2 protein expression was significantly higher in liver hepatocellular carcinoma (LIHC), colon adenocarcinoma (COAD), head and neck squamous cell carcinoma (HNSC), cervical squamous cell carcinoma and endocervical adenocarcinoma (CESC), and breast invasive carcinoma (BRCA) tissues than normal tissues. (A) Liver. (B) Colon. (C) Skeletal muscle. (D) Cervix. (E) Breast. (F,G) Lung. ****P < 0.0001.
Figure 3
Figure 3
Association between TREM2 expression and overall survival time in days (OS). (A) Forest plot of OS associations in 33 types of tumor. (B–I) Kaplan-Meier analysis of the association between TREM2 expression and OS.
Figure 4
Figure 4
Association between TREM2 expression levels and disease-specific survival (DSS) and disease-free interval (DFI). (A) Forest plot of association of TREM2 expression and DSS in 33 types of tumor. (B–D) Kaplan-Meier analysis of the association between TREM2 expression and DSS. (E) Forest plot of association of TREM2 with DFI for 33 types of tumor. (F–H) Kaplan-Meier analysis of the association between TREM2 expression and DFI.
Figure 5
Figure 5
Association between TREM2 expression and progression-free interval (PFI). (A) Forest plot of PFI association with TREM2 expression in 33 tumor types. (B–E) Kaplan-Meier analysis of the association between TREM2 expression and PFI.
Figure 6
Figure 6
Association between TREM2 expression and age in (A) cholangiocarcinoma (CHOL), (B) lung adenocarcinoma (LUAD), (C) breast invasive carcinoma (BRCA), (D) prostate adenocarcinoma (PRAD), (E) sarcoma (SARC), and (F) thymoma (THYM).
Figure 7
Figure 7
Association between TREM2 expression and tumor stage in (A) colon adenocarcinoma (COAD), (B) esophageal carcinoma (ESCA), (C) kidney chromophobe (KICH), (D) rectum adenocarcinoma (READ), (E) stomach adenocarcinoma (STAD), (F) testicular germ cell tumors (TGCT), and (G) thyroid carcinoma (THCA).
Figure 8
Figure 8
Associations between TREM2 expression and tumor mutational burden (TMB), microsatellite instability (MSI), and mismatch repair (MMR). (A) Heatmap illustrating the relationship between TREM2 and TMB. The top left triangle represents the P-value, and the bottom right triangle represents the correlation coefficient *p < 0.05, **p < 0.01, and***p < 0.001. (B) Heatmap illustrating the relationship between TREM2 and MSI. The top left triangle represents the P-value, and the bottom right triangle represents the correlation coefficient *p < 0.05, **p < 0.01, and ***p < 0.001. (C) Heatmap illustrating the association between TREM2 expression and MMR genes. For each pair, the top left triangle represents the P-value, and the bottom right triangle represents the correlation coefficient *p < 0.05, **p < 0.01, and ***p < 0.001.
Figure 9
Figure 9
Five tumors with the highest correlation coefficients between TREM2 expression and the tumor microenvironment. (A) Correlation between TREM2 and immune scores in kidney chromophobe (KICH), brain lower grade glioma (LGG), thyroid carcinoma (THCA), bladder urothelial carcinoma (BLCA), and kidney renal papillary cell carcinoma (KIRP). (B) Correlation between TREM2 and stromal scores in BLCA, colon adenocarcinoma (COAD), rectum adenocarcinoma (READ), kidney chromophobe (KICH), and LGG.
Figure 10
Figure 10
Relationship between TREM2 expression and tumor infiltration of different immune cells.
Figure 11
Figure 11
Co-expression of TREM2 and immune-related genes. *P < 0.05, **P < 0.01, ***P < 0.001, ****P < 0.0001.
Figure 12
Figure 12
Correlation between TREM2 expression and gene promoter methylation. (A) Correlation between TREM2 expression and gene promoter methylation in brain lower grade glioma (LGG), glioblastoma multiforme (GBM), uveal melanoma (UVM), kidney chromophobe (KICH), mesothelioma (MESO), and lung squamous cell carcinoma (LUSC). (B) Correlation between TREM2 methylation overall survival in MESO, UVM, and liver hepatocellular carcinoma (LIHC). (C) Correlation between TREM2 methylation and disease-specific survival in UVM and kidney renal papillary cell carcinoma (KIRP). (D) Correlation between TREM2 methylation and disease-free interval in KIRP. (E) Correlation between TREM2 methylation and progression-free interval in KICH, kidney renal papillary cell carcinoma (KIPR), LGG, MESO, and prostate adenocarcinoma (PRAD).
Figure 13
Figure 13
Results of GSEA. (A) GO functional annotation of TREM2 in various cancers. (B) KEGG pathway analysis of TREM2 in multiple cancers. Curves of different colors show different functions or pathways regulated in different cancers. Peaks on the upward curve indicate positive regulation and peaks on the downward curve indicate negative regulation.
Figure 14
Figure 14
Results of GSVA. Yellow bars show the 15 pathways with the most significant positive correlation and blue bars show the 15 pathways with the most significant negative correlations. Horizontal axis represents the correlation coefficient. (A) Cervical squamous cell carcinoma and endocervical adenocarcinoma (CESC). (B) Kidney chromophobe (KICH). (C) Kidney renal papillary cell carcinoma (KIRP). (D) Brain lower grade glioma (LGG). (E) Ovarian serous cystadenocarcinoma (OV). (F) Rectum adenocarcinoma (READ). (G) Skin cutaneous melanoma (SKCM). (H) Stomach adenocarcinoma (STAD).

Similar articles

Cited by

References

    1. Bray F, Ferlay J, Soerjomataram I, Siegel RL, Torre LA, Jemal A. Global cancer statistics 2018: GLOBOCAN estimates of incidence and mortality worldwide for 36 cancers in 185 countries. Cancer J Clin. (2018) 68:394–424. 10.3322/caac.21492 - DOI - PubMed
    1. Ribas A, Wolchok JD. Cancer immunotherapy using checkpoint blockade. Science. (2018) 359:1350–5. 10.1126/science.aar4060 - DOI - PMC - PubMed
    1. Blum A, Wang P, Zenklusen JC. SnapShot: TCGA-analyzed tumors. Cell. (2018) 173:530. 10.1016/j.cell.2018.03.059 - DOI - PubMed
    1. Deczkowska A, Weiner A, Amit I. The physiology, pathology, and potential therapeutic applications of the TREM2 signaling pathway. Cell. (2020) 181:1207–17. 10.1016/j.cell.2020.05.003 - DOI - PubMed
    1. Guerreiro R, Wojtas A, Bras J, Carrasquillo M, Rogaeva E, Majounie E, et al. . TREM2 variants in Alzheimer's disease. N Engl J Med. (2013) 368:117–27. 10.1056/NEJMoa1211851 - DOI - PMC - PubMed

Publication types

MeSH terms