

The European Union One Health 2019 Zoonoses Report
- PMID: 33680134
- PMCID: PMC7913300
- DOI: 10.2903/j.efsa.2021.6406
The European Union One Health 2019 Zoonoses Report
Abstract
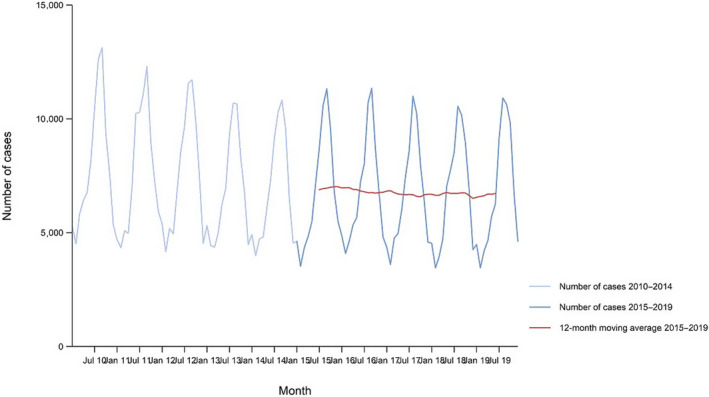
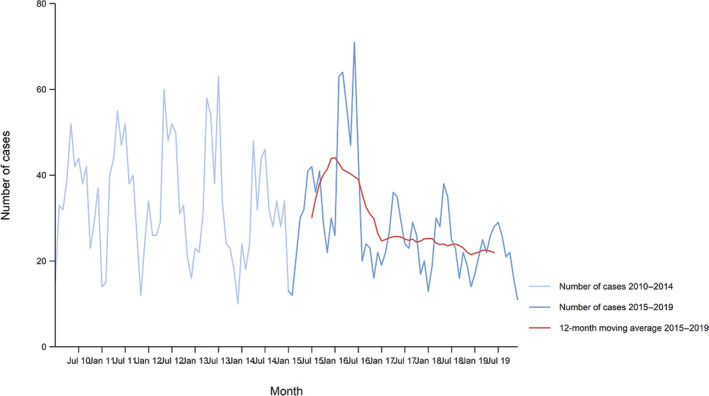
This report of the EFSA and the European Centre for Disease Prevention and Control presents the results of zoonoses monitoring activities carried out in 2019 in 36 European countries (28 Member States (MS) and eight non-MS). The first and second most reported zoonoses in humans were campylobacteriosis and salmonellosis, respectively. The EU trend for confirmed human cases of these two diseases was stable (flat) during 2015-2019. The proportion of human salmonellosis cases due to Salmonella Enteritidis acquired in the EU was similar to that in 2017-2018. Of the 26 MS reporting on Salmonella control programmes in poultry, 18 met the reduction targets, whereas eight failed to meet at least one. The EU prevalence of Salmonella target serovar-positive flocks has been stable since 2015 for breeding hens, laying hens, broilers and fattening turkeys, with fluctuations for breeding turkey flocks. Salmonella results from competent authorities for pig carcases and for poultry tested through national control programmes were more frequently positive than those from food business operators. Shiga toxin-producing Escherichia coli (STEC) infection was the third most reported zoonosis in humans and increased from 2015 to 2019. Yersiniosis was the fourth most reported zoonosis in humans in 2019 with a stable trend in 2015-2019. The EU trend of confirmed listeriosis cases remained stable in 2015-2019 after a long period of increase. Listeria rarely exceeded the EU food safety limit tested in ready-to-eat food. In total, 5,175 food-borne outbreaks were reported. Salmonella remained the most detected agent but the number of outbreaks due to S. Enteritidis decreased. Norovirus in fish and fishery products was the agent/food pair causing the highest number of strong-evidence outbreaks. The report provides further updates on bovine tuberculosis, Brucella, Trichinella, Echinococcus, Toxoplasma, rabies, West Nile virus, Coxiella burnetii (Q fever) and tularaemia.
Keywords: Campylobacter; Listeria; Salmonella; food‐borne outbreaks; monitoring; parasites; zoonoses.
© 2021 European Food Safety Authority and European Centre for Disease Prevention and Control.
Figures
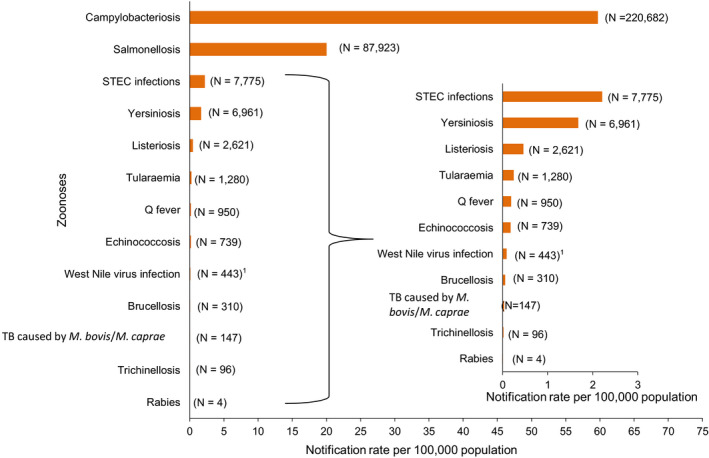
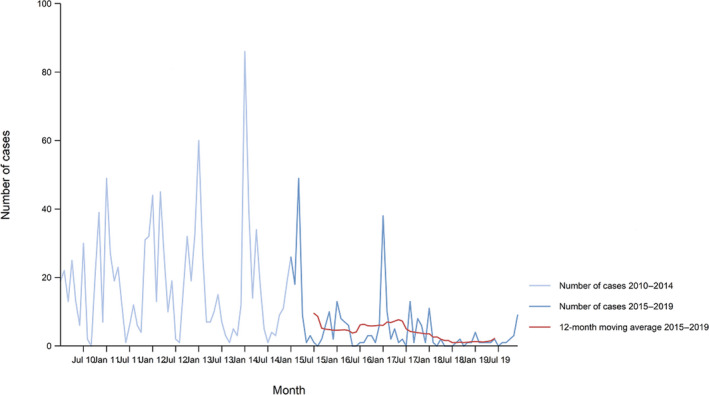
Note: The total number of confirmed cases is indicated between parentheses at the end of each bar.
1 Exception: West Nile virus infection for which the total number of cases was used.

Source(s): Austria, Cyprus, Czechia, Denmark, Estonia, Finland, France, Germany, Hungary, Iceland, Ireland, Italy, Latvia, Lithuania, Luxembourg, Malta, the Netherlands, Norway, Poland, Romania, Slovakia, Slovenia, Sweden and the United Kingdom. Belgium, Bulgaria, Croatia, Greece, Portugal and Spain did not report data to the level of detail required for the analysis.
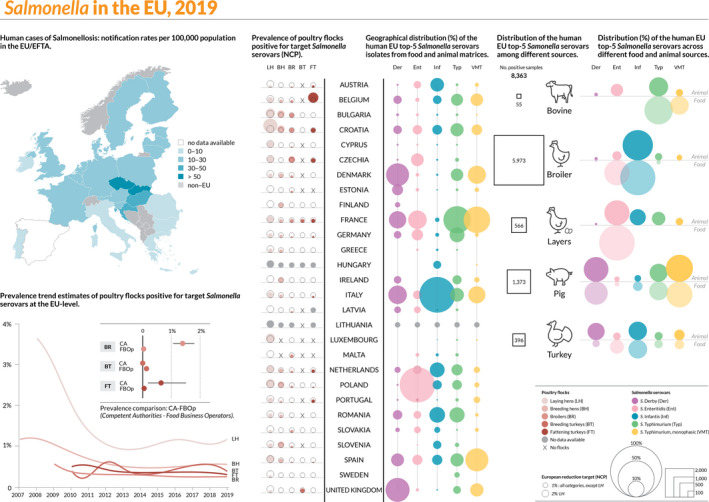
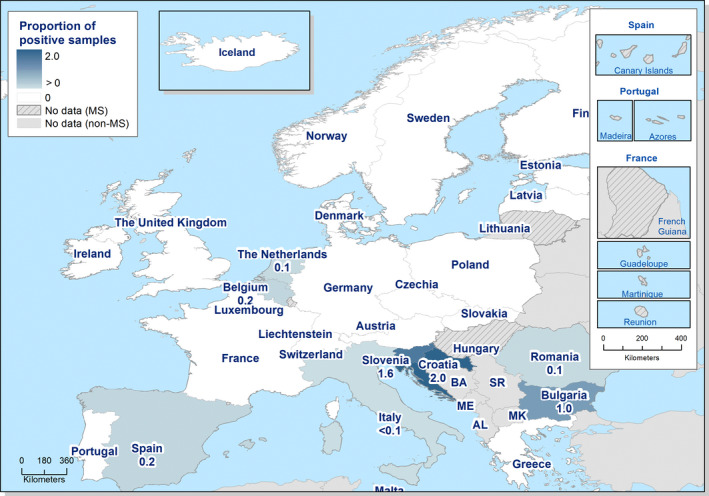
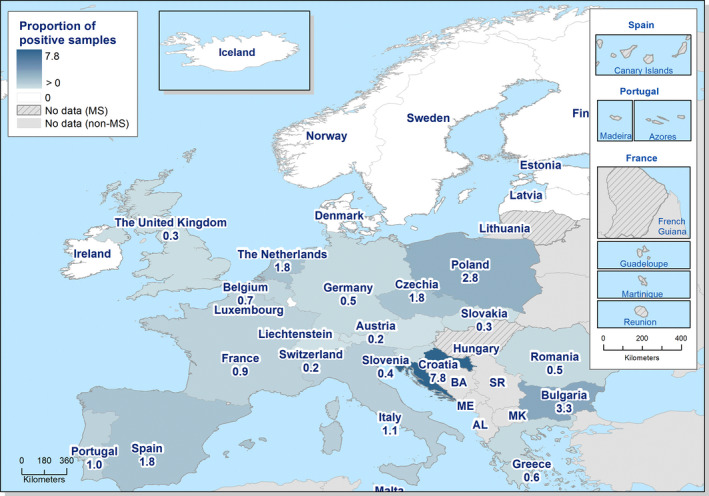
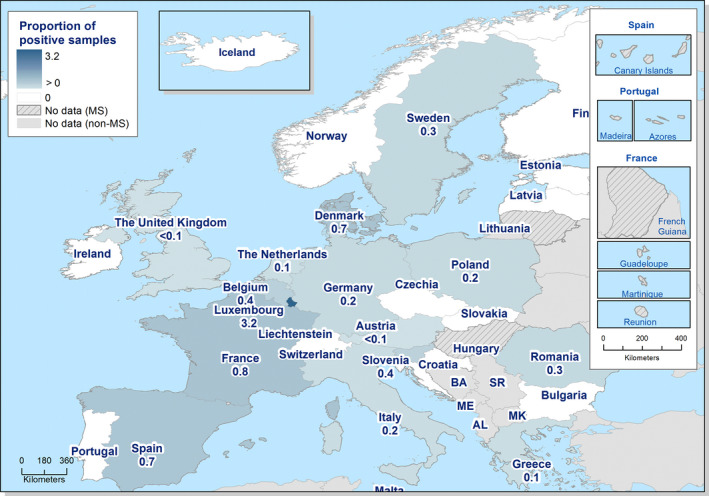
On the left side of the infographic are shown: (a) Map of the salmonellosis notification rates per 100,000 population in the
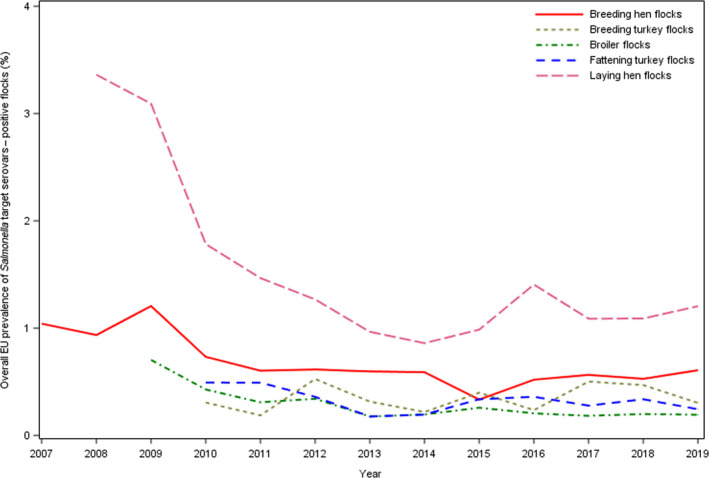
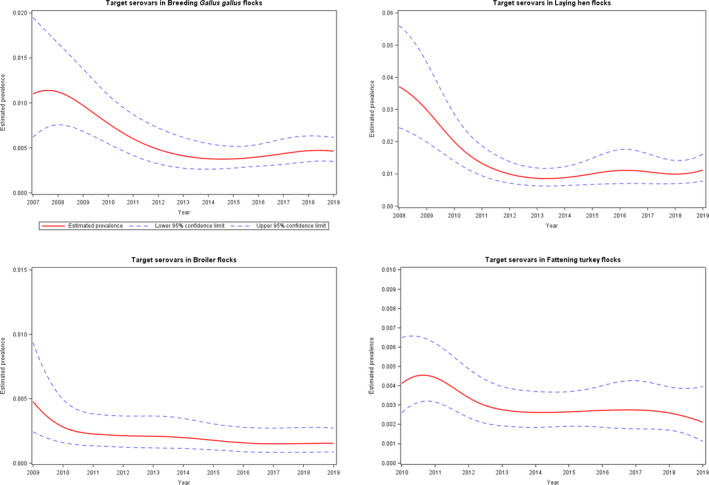
EU /EFTA ; (b) the single Member States’ prevalence in the context of national control programmes (NCP ) in poultry compared with the European reduction target for laying hens (2%) and other poultry populations (1%); (c) the trends of the prevalence of poultry flocks positive for Salmonella target serovars in the context ofNCP ; (d) the comparisons between the results of the competent authorities (CA ) and food business operators (FBO p) data in the context of theNCP ; on the right side; (e) the distribution of the human top five Salmonella serovars coming from serotyped isolates from food and animal matrices reported by reportingMS , and (f) the distribution of human top five Salmonella serovars isolates according to different food and animal matrices.

Source: Austria, Belgium, Cyprus, Czechia, Denmark, Estonia, Finland, France, Germany, Greece, Hungary, Iceland, Ireland, Italy, Lithuania, Luxembourg, Latvia, Malta, the Netherlands, Norway, Poland, Portugal, Romania, Slovakia, Slovenia, Sweden and the United Kingdom. Bulgaria, Croatia and Spain did not report data to the level of detail required for the analysis.
The number at the end of the bar indicates the number of tested samples and the number between brackets indicates the number of reporting
MS for each food category and sampling stage.

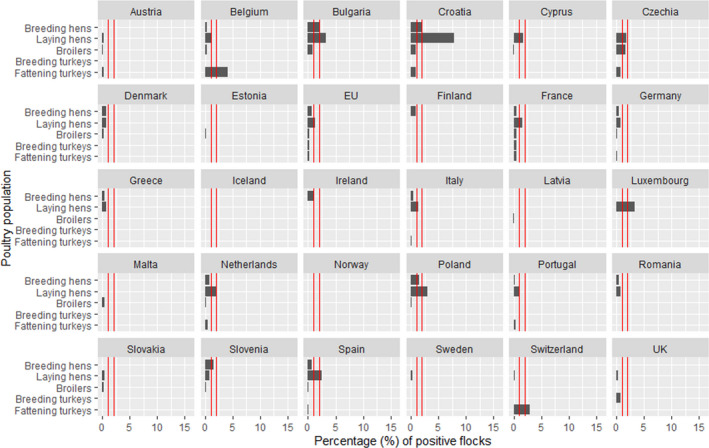
Red vertical bars indicate the target to be reached, which was fixed at 1% for all poultry populations with the exception of laying hens for which it was 2% for all
MS with the exception of Poland, for which it was 3.5%. Luxembourg met the target in laying hens (having less than 50 flocks with one positive for target serovars).

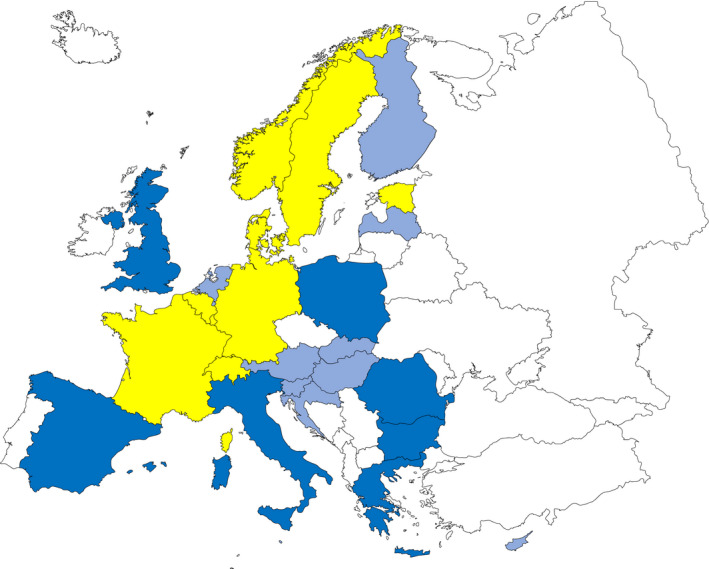
AL : Albania;BA : Bosnia and Herzegovina;ME : Montenegro;MK : Republic of North Macedonia; andSR : Serbia.Luxembourg and Malta do not have breeding flocks of Gallus gallus.

AL : Albania;BA : Bosnia and Herzegovina;ME : Montenegro;MK : Republic of North Macedonia; andSR : Serbia.Luxembourg and Malta do not have breeding flocks of Gallus gallus.
AL: Albania; BA: Bosnia and Herzegovina; ME: Montenegro; MK: Republic of North Macedonia; and SR: Serbia. Luxembourg and Malta do not have breeding flocks of Gallus gallus.
AL : Albania;BA : Bosnia and Herzegovina;ME : Montenegro;MK : Republic of North Macedonia; andSR : Serbia.
AL : Albania;BA : Bosnia and Herzegovina;ME : Montenegro;MK : Republic of North Macedonia; andSR : Serbia.
AL : Albania;BA : Bosnia and Herzegovina;ME : Montenegro;MK : Republic of North Macedonia andSR : Serbia.
AL : Albania;BA : Bosnia and Herzegovina;ME : Montenegro;MK : Republic of North Macedonia; andSR : Serbia.
AL : Albania;BA : Bosnia and Herzegovina;ME : Montenegro;MK : Republic of North Macedonia; andSR : Serbia.The following
MS do not have turkey breeding flocks: Austria, Belgium, Cyprus, Czechia, Denmark, Estonia, Latvia, Lithuania, Luxembourg, Malta, the Netherlands, Portugal, Romania, Slovakia and Slovenia. Also the non‐MS Switzerland does not have such flocks.
AL : Albania;BA : Bosnia and Herzegovina;ME : Montenegro;MK : Republic of North Macedonia; andSR : Serbia.The following
MS do not have turkey breeding flocks: Estonia, Latvia, Luxembourg and Malta.
Source(s): Austria, Czechia, Denmark, Estonia, Finland, Germany, Greece, Hungary, Ireland, Italy, Latvia, Malta, the Netherlands, Portugal, Slovakia, Spain, Sweden and the United Kingdom. Belgium, Bulgaria, Cyprus, Croatia, France, Lithuania, Luxembourg, Poland, Romania and Slovenia did not report data to the level of detail required for the analysis.
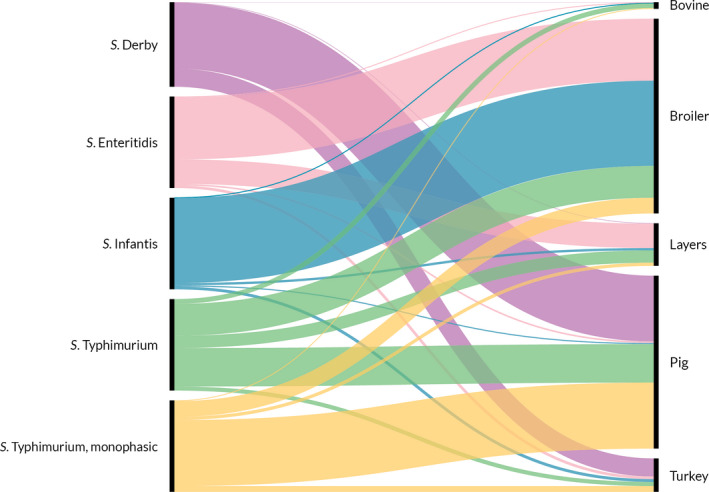
The left side of the diagram shows the five most reported Salmonella serovars from human salmonellosis cases acquired in the
EU : S. Enteritidis (pink), S. Typhimurium (green), monophasic S. Typhimurium (yellow), S. Infantis (blue) and S. Derby (violet). Animal and food data from the same source were merged: ‘broiler’ includes isolates from broiler flocks and broiler meat, ‘bovine’ includes isolates from bovines for meat production and bovine meat, ‘pig’ includes isolates from fattening pigs and pig meat, ‘turkey’ includes isolates from fattening turkey flocks and turkey meat and ‘layers’ includes isolates from laying hen flocks and eggs. The right side shows the five sources considered (broiler, bovine, pig, turkey and layers). The width of the coloured bands linking sources and serovars is proportional to the percentage of isolates of each serovar from each source.
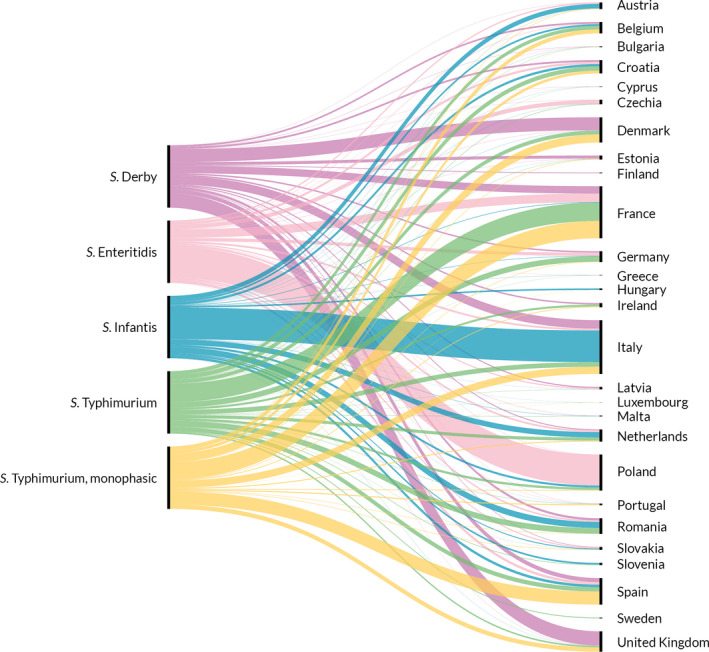
The left side of the diagram shows the five most reported Salmonella serovars from human salmonellosis cases acquired in the
EU : S. Enteritidis (pink), S. Typhimurium (green), monophasic S. Typhimurium (yellow), S. Infantis (blue) and S. Derby (violet). The right side shows the reportingMS . The width of the coloured bands linkingMS and serovars is proportional to the percentage of isolates of each serovar reported by eachMS .

The percentages were calculated based on the total number of isolates serotyped for each of the five animal/food categories (bovine, broiler, layers, pig and turkey). The values at the top of each box are the numbers of Salmonella serovar isolates and the numbers in parentheses are the number of reporting
MS , for animal matrices (grey) and food matrices (black). Each plot shows the percentage of isolates belonging to the reported serovar out of the total number of serotyped isolates.
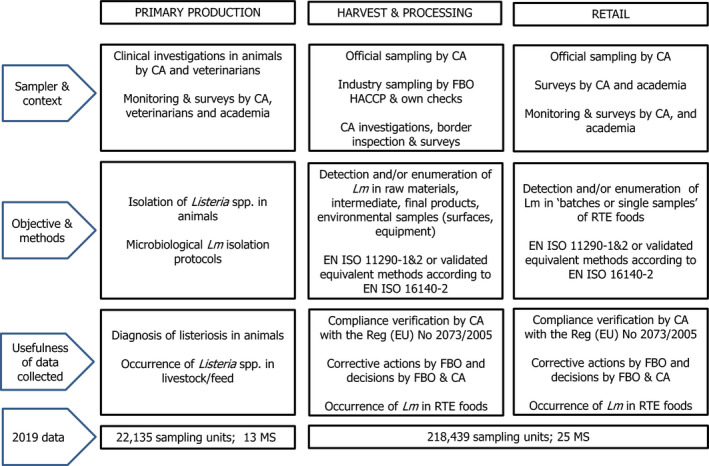
CA : Competent Authority;FBO p: Food business operator; Lm: Listeria monocytogenes;MS : Member State;RTE : ready‐to‐eat.
Source: Austria, Belgium, Cyprus, Czechia, Denmark, Estonia, Finland, France, Germany, Greece, Hungary, Iceland, Ireland, Italy, Latvia, Lithuania, Malta, the Netherlands, Norway, Poland, Romania, Slovakia, Slovenia, Sweden and the United Kingdom. Bulgaria, Croatia, Luxembourg, Portugal and Spain did not report data to the level of detail required for the analysis.
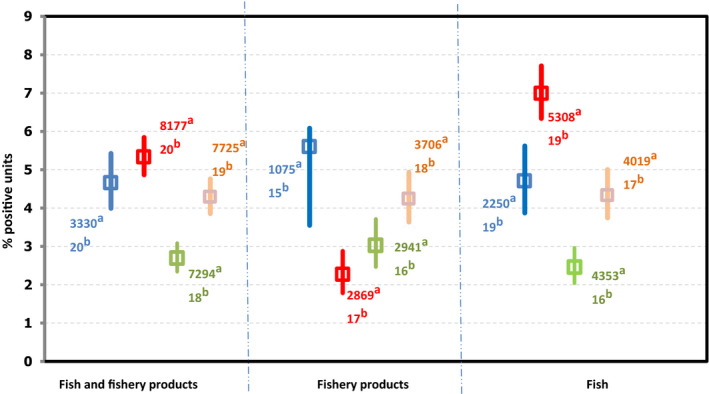
(a): Number of sampling units tested by the
MS for the corresponding category and year.(b): Number of
MS which have reported tested sampling units for the corresponding category and year.‘Fish,
RTE ’ includes data on ‘fish’ of the following types: ‘chilled’, ‘cooked‐chilled’, ‘gravad/slightly salted’, ‘marinated’ and ‘smoked – cold‐smoked’, ‘smoked – hot‐smoked’, ‘smoked’.‘Fishery products,
RTE ’ includes the following types: ‘crustaceans – prawns – cooked’, ‘crustaceans – lobsters – cooked’, ‘crustaceans – unspecified – cooked’, ‘crustaceans – shrimps – shelled, shucked and cooked’, ‘crustaceans – unspecified – shelled, shucked and cooked’, ‘crustaceans – shrimps – cooked’, ‘fish – fishery products from fish species associated with a high amount of histidine – not enzyme maturated’, ‘fish – fishery products from fish species associated with a high amount of histidine – which have undergone enzyme maturation treatment in brine’, ‘fishery products, unspecified – cooked’, ‘fishery products, unspecified –RTE – chilled’, ‘fishery products, unspecified – smoked’, ‘fishery products, unspecified –RTE ’, ‘molluscan shellfish – shelled, shucked and cooked’, ‘molluscan shellfish – cooked’, ‘molluscan shellfish – cooked – frozen’, ‘Surimi – frozen’, ‘surimi – chilled’, ‘surimi’.
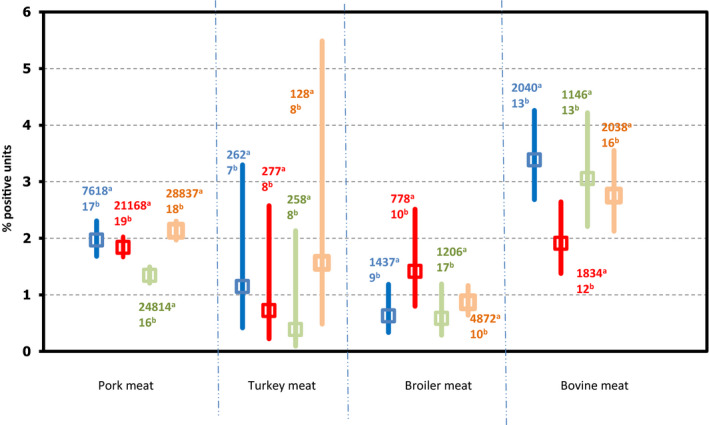
(a): Number of samples tested by the
MS for the corresponding category and year.(b): Number of
MS which have reported tested samples for the corresponding category and year.Since data were mostly reported by a limited number of
MS and are of a heterogeneous nature as these include various diverse subcategories, the findings presented in this figure may not be representative of theEU level or directly comparable across years.RTE pig meat products includes ‘meat from pig, meat products’ of the following types: ‘cooked ham’, ‘cooked,RTE ’, ‘fermented sausages’, ‘pâté’, ‘raw and intended to be eaten raw’, ‘raw ham’, ‘unspecified, ready‐to‐eat’ and ‘ready‐to‐eat’ and ‘meat from pig – meat preparation’ of the following type ‘intended to be eaten raw’. ‘RTE turkey meat’ includes turkey ‘meat products’ of the following types: ‘cooked,RTE ’, ‘ready‐to‐eat’ and ‘raw and intended to be eaten raw’. ‘RTE broiler meat’ includes broiler ‘meat products’ of the following types: ‘cooked,RTE ’. ‘RTE bovine meat’ includes ‘meat from bovine animals, meat products’ of the following types: ‘cooked,RTE ’, ‘fermented sausages’, ‘raw and intended to be eaten raw’, ‘pâté’; ‘ready‐to‐eat’; and ‘unspecified,RTE ’; ‘meat from bovine animals, meat preparation’ of the following types: ‘intended to be eaten raw’ and ‘meat from bovine animals, minced meat’ of the following types: ‘intended to be eaten raw’.
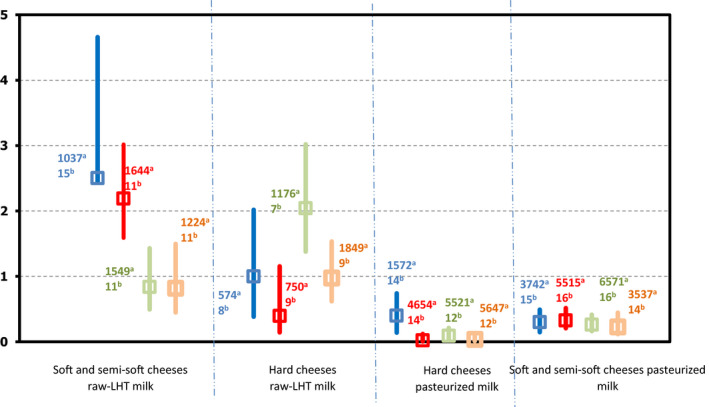
(a): Number of samples tested by the
MS for the corresponding category and year.(b): Number of
MS which have reported tested samples for the corresponding category and year.LHT : low heat treated. ‘Overall’ and the number ofMS correspond to data across all major sampling stages (‘retail’ + ‘processing’ + ‘farm’ + ‘border inspection activities’ + ‘unspecified’). ‘Retail’ corresponds to data obtained from catering, hospital or medical care facilities, retail, wholesale and restaurants or cafes or pubs or bars or hotels or catering services. For each sampling stage (‘overall’, ‘retail’ and ‘processing’), data are pooled across both types of sampling units (‘single’ and ‘batch’). ‘Processing’ corresponds to data obtained from packing centres, cutting plants and processing plants. Since data were mostly reported by a limited number ofMS , the findings presented in this figure may not be presentative of theEU level.‘Hard cheeses pasteurised milk’ and ‘hard cheeses from raw or low heat‐treated milk’ includes cheeses made from cows’ milk, sheep's milk, goats’ milk, mixed milk from cows, sheep and/or goats and unspecified milk or other animal milk.
‘Soft and semi‐soft cheeses’ includes both soft and semi‐soft and fresh cheese made from cows’ milk, sheep's milk, goats’ milk, mixed milk from cows, sheep and/or goats and unspecified milk or other animal milk.
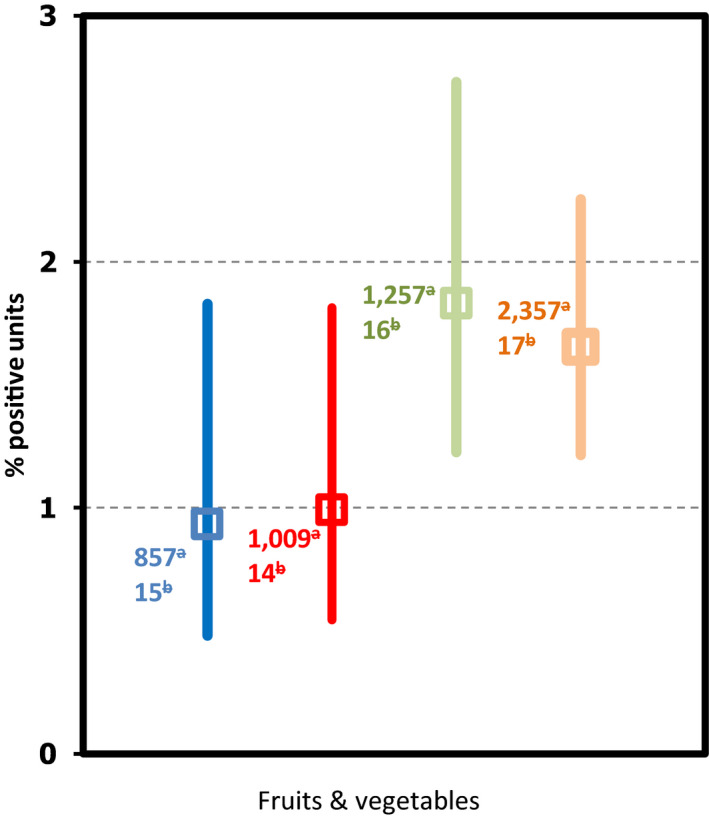
(a): Number of samples tested by the
MS for the corresponding category and year.(b): Number of
MS which have reported tested samples for the corresponding category and year.The fruit and vegetables group data provided included fruit juice, mixed juice, pre‐cut fruit and/or vegetables, fruit or vegetable products and the edible part of fruit.

Source: Austria, Cyprus, Denmark, Estonia, Finland, France, Germany, Greece, Hungary, Iceland, Ireland, Italy, Latvia, Lithuania, Luxembourg, Malta, the Netherlands, Norway, Poland, Romania, Slovakia, Slovenia, Sweden and the United Kingdom. Belgium, Bulgaria, Czechia, Croatia, Portugal and Spain did not report data to the level of detail required for the analysis.
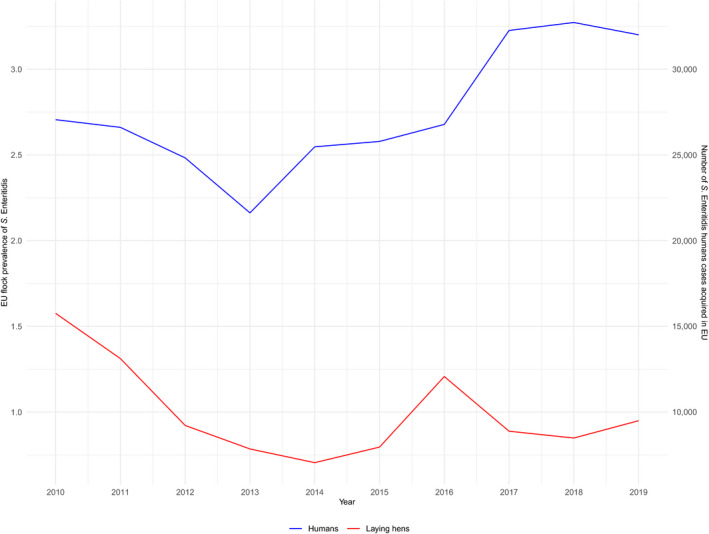
Data for
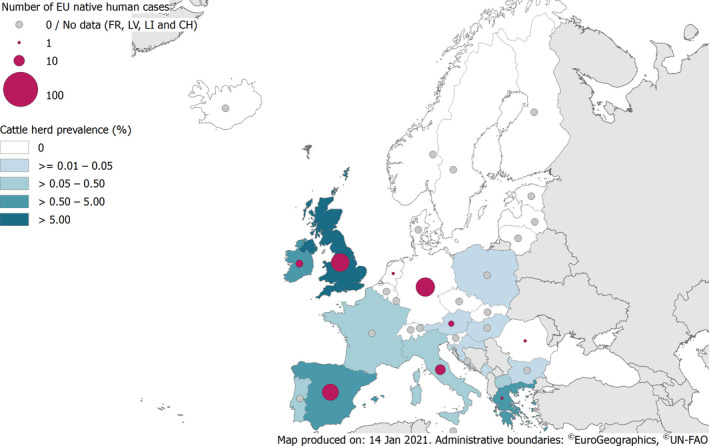
EU /EEA human cases provided byECDC .
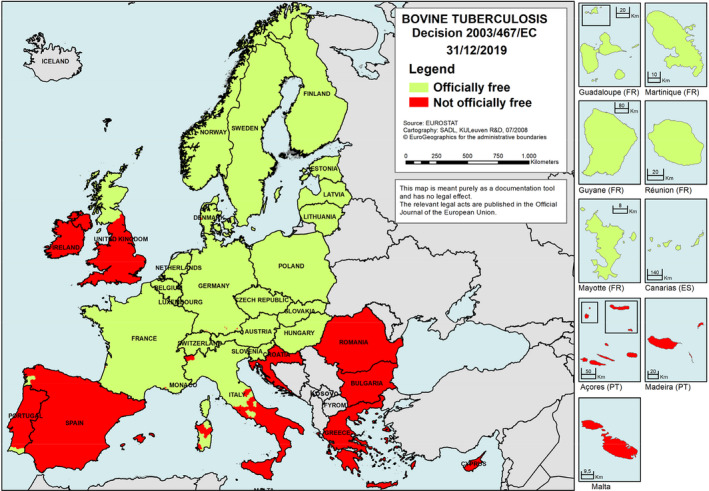

OTF : Officially bovine tuberculosis free in cattle.

OTF : Officially bovine tuberculosis free in cattle.
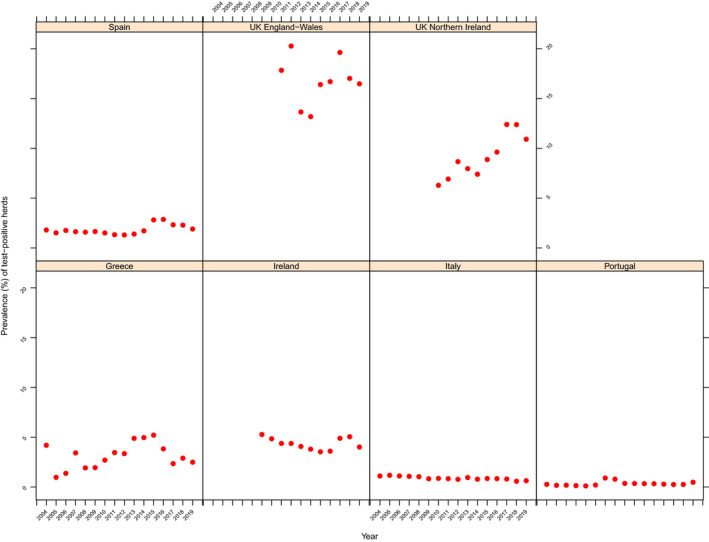
Source: Austria, Cyprus, Czechia, Estonia, Finland, France, Germany, Greece, Hungary, Iceland, Ireland, Italy, Latvia, Lithuania, Malta, the Netherlands, Norway, Poland, Portugal, Romania, Slovakia, Slovenia and Sweden. Belgium, Bulgaria, Croatia, Luxembourg, Spain and the United Kingdom did not report data to the level of detail required for the analysis. Denmark does not have a surveillance system for this disease.

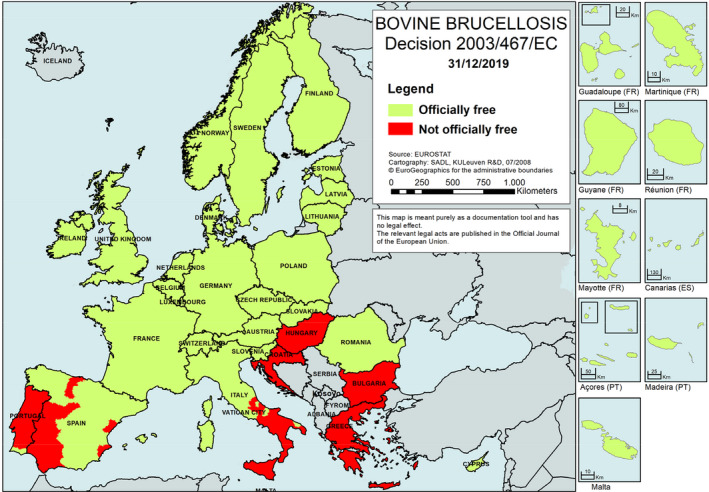
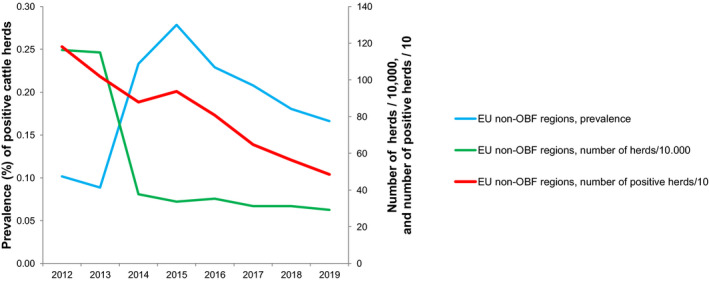
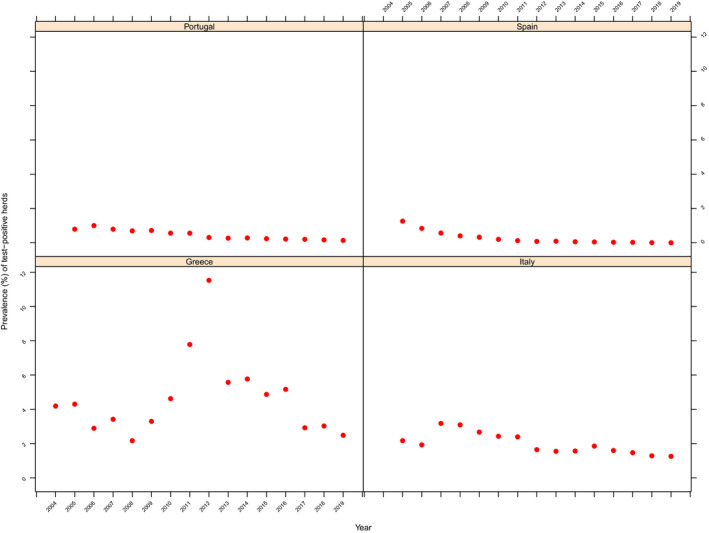
Non‐
OBF : Non‐officially brucellosis free in cattle.

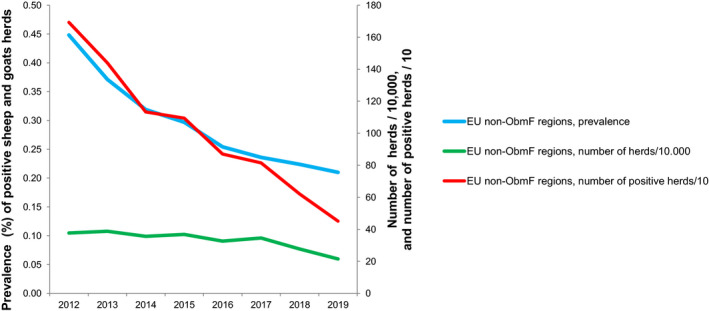
Non‐ObmF: Non‐officially B. melitensis free in sheep and goats.

Source: Austria, Cyprus, Czechia, Estonia, Finland, Germany, France, Greece, Hungary, Ireland, Italy, Latvia, Lithuania, Luxembourg, Malta, the Netherlands, Norway, Poland, Portugal, Romania, Slovakia, Slovenia, Sweden and the United Kingdom. Belgium, Bulgaria, Croatia, Spain and Iceland did not report data to the level of detail required for the analysis. Denmark does not have any formal surveillance system for the disease.
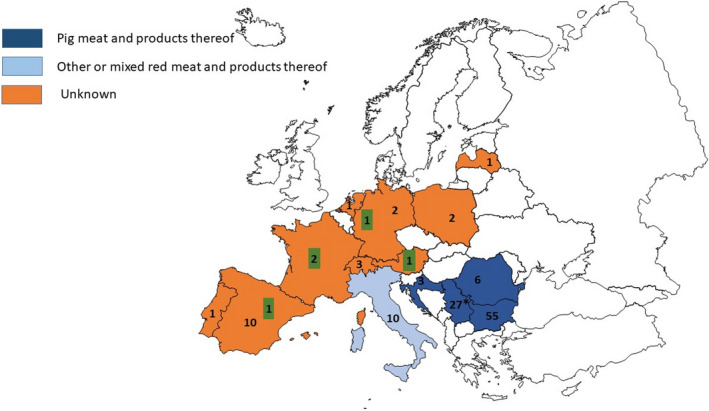
Countries that reported food‐borne human trichinellosis cases are coloured according the food vehicle causing the outbreaks (‘pig meat and products thereof’, ‘other or mixed red meat and products thereof’ or ‘unknown’ food vehicle) (data reported to
EFSA ). The numbers without green box indicate the number of domestic trichinellosis human cases and the numbers in a green box indicate the number of travel‐related trichinellosis human cases (data reported toECDC except for Serbia (*) data reported toEFSA ).
These distribution maps have been built based on data from reports (EFSA and ECDC, 2015a, 2015b, 2016, 2017a, 2018b, 2019c).
Source: Austria, France, Germany, Lithuania, Norway, Poland, Slovakia and Sweden. Belgium, Bulgaria, Croatia, Czechia, Cyprus, Denmark, Estonia, Finland, Greece, Hungary, Iceland, Italy, Ireland, Latvia, Luxembourg, Malta, the Netherlands, Portugal, Romania, Slovenia, Spain and the United Kingdom did not report data to the level of detail required for the analysis.

Source: Austria, Czechia, Estonia, Finland, France, Germany, Greece, Hungary, Ireland, Latvia, Lithuania, Malta, Norway, Malta, Poland, Portugal, Romania, Slovakia, Slovenia, Spain and Sweden. Belgium, Bulgaria, Croatia, Cyprus, Denmark, Iceland, Italy Luxembourg, the Netherlands and the United Kingdom did not report data to the level of detail required for the analysis.

Total number of animals reported positive for Echinococcus granulosus s.l. was 977,697: number of positive sheep (N = 630,915), goats (N = 86,948), pigs (N = 165,572), cattle (N = 84,003), sheep and goats (N = 9,260), wild boars (N = 428), water buffalos (N = 406), domestic solipeds (N = 33), deer (N = 98), reindeer (N = 25), moose (N = 7) and mouflons (N = 2). Positive pigs could be overestimated in co‐endemic countries with Echinococcus multilocularis.
Intermediate hosts included in map are cattle, deer, goats, horses, moose, mouflons, pigs, reindeer, sheep, water buffalos and wild boars.
Legend: dark blue ≥ 500 positive cases; light blue < 500 cases; yellow = 0 cases reported; white = data not reported. Because of the co‐endemicity with Echinococcus multilocularis, pigs were excluded from Latvia, Hungary, Poland, Germany, Slovakia and Switzerland when Echinococcus species information was not reported.

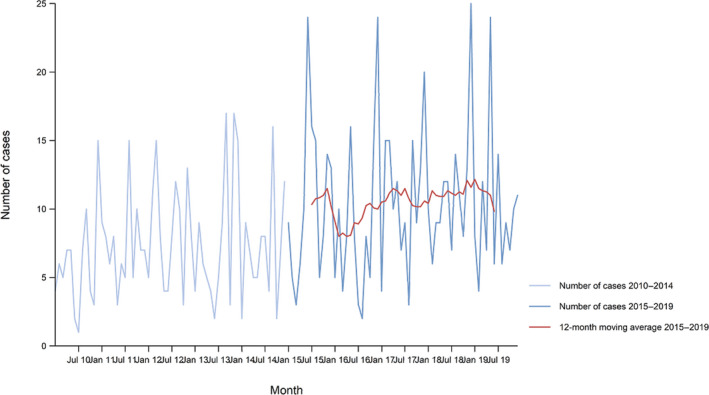
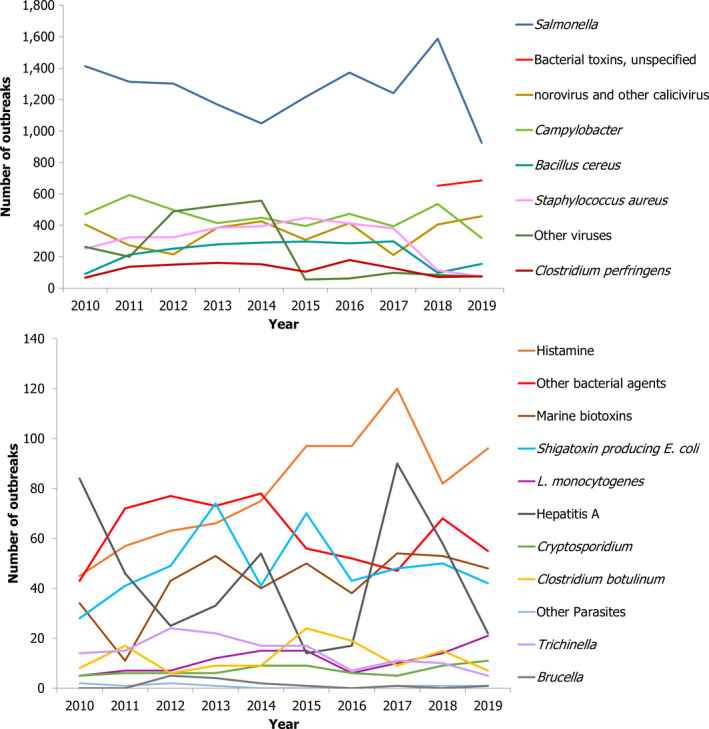
Note: both strong‐evidence outbreaks and weak‐evidence outbreaks are considered in the figure.

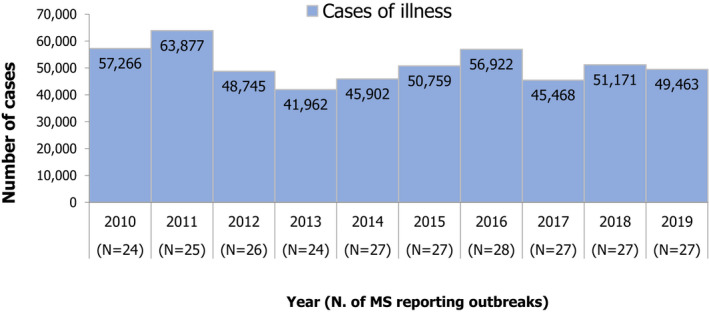
Note: the number of
MS reporting outbreaks is indicated in the bottom (N).Data on food‐borne outbreaks for 2018 differ from those published in the European Union One Health 2018 Zoonoses Report, due to a delay in reporting from one
MS (the Netherlands).
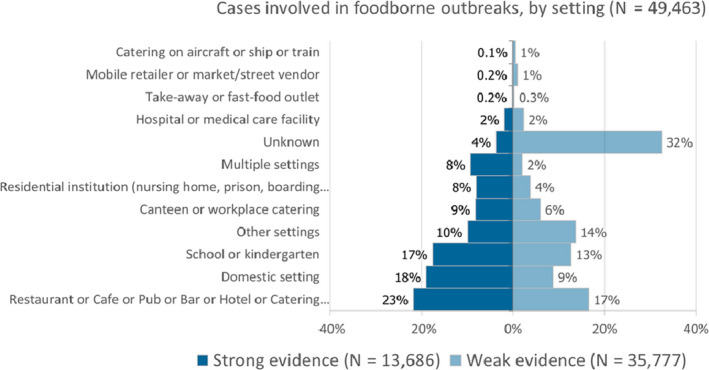
Note: the number of
MS reporting outbreaks is indicated in the bottom (N).Cases involved in both strong‐evidence outbreaks and weak‐evidence outbreaks are counted in the figure.
Data on food‐borne outbreaks for 2018 differ from those published in the European Union One Health 2018 Zoonoses Report, due to a delay in reporting from one
MS (the Netherlands).
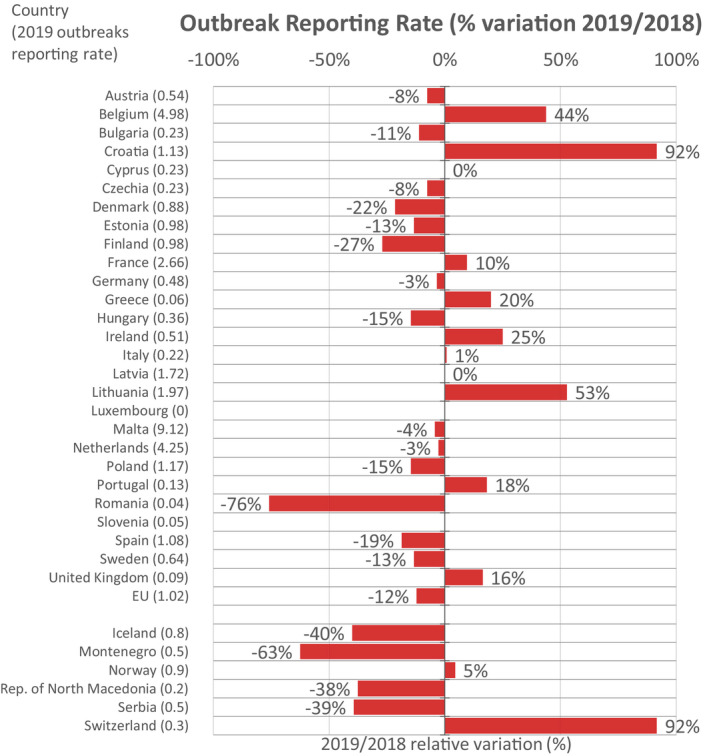
For Slovenia the % variation cannot be calculated due to missing data reporting for 2018. Slovakia did not report data on outbreaks in 2019.
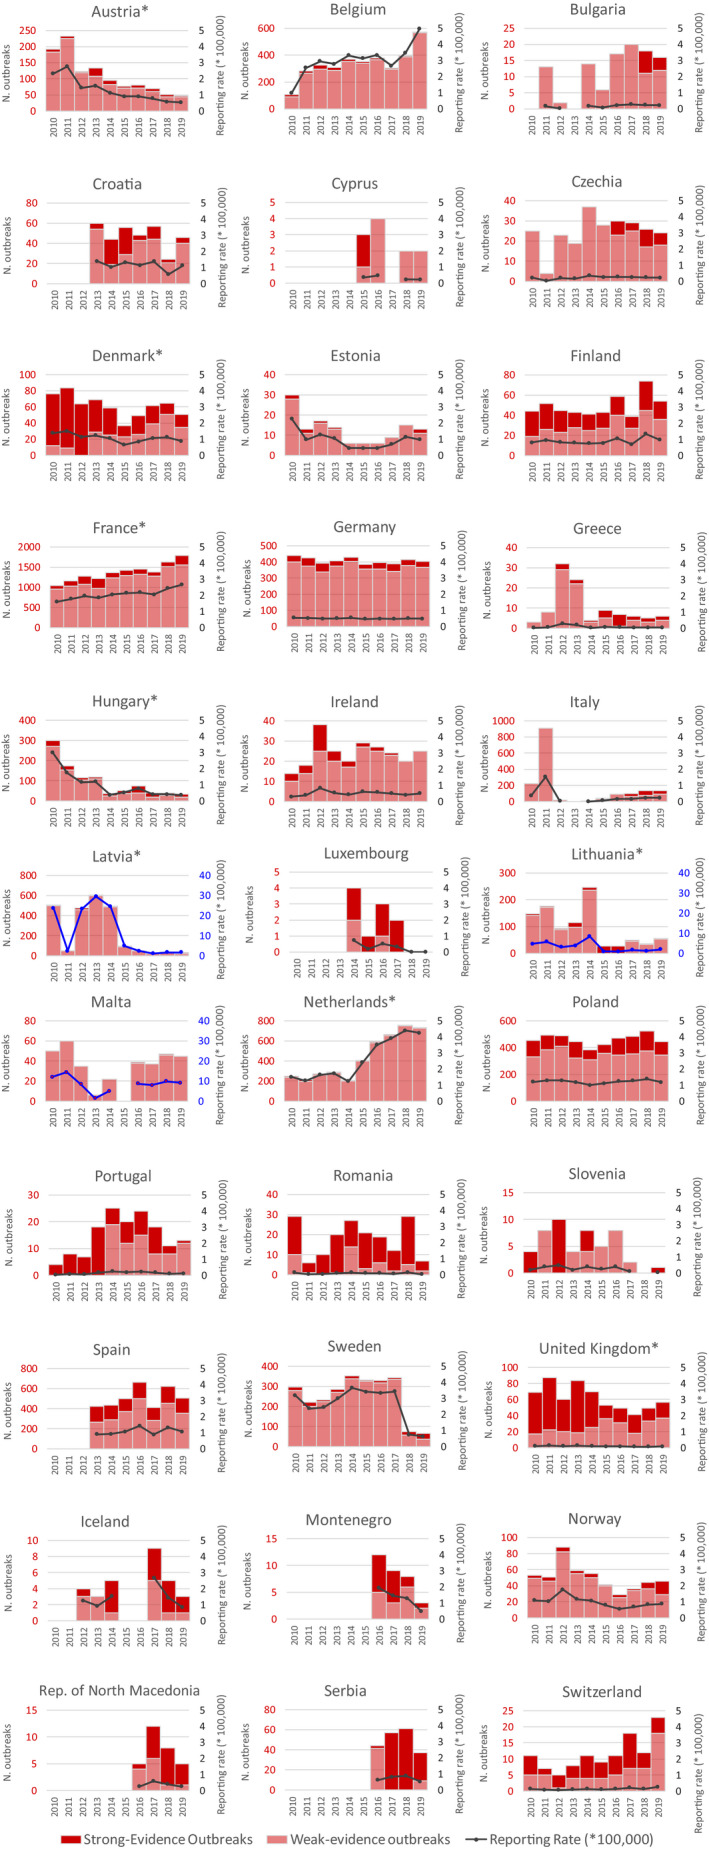
Note: * indicates countries with a statistical significant trend (P < 0.05) over years.
Blue colour for both the trend line and the secondary Y‐axis representing the
FBO reporting rate was adopted for Latvia, Lithuania and Malta to highlight that the scale was different from the other countries. Slovakia did not report data on outbreaks in 2019.
Note: Only
FBO s reported byEU Member States are visualised in the figure.FBO s are sorted by number of strong‐evidence outbreaks.‘Hepatitis A’ includes also
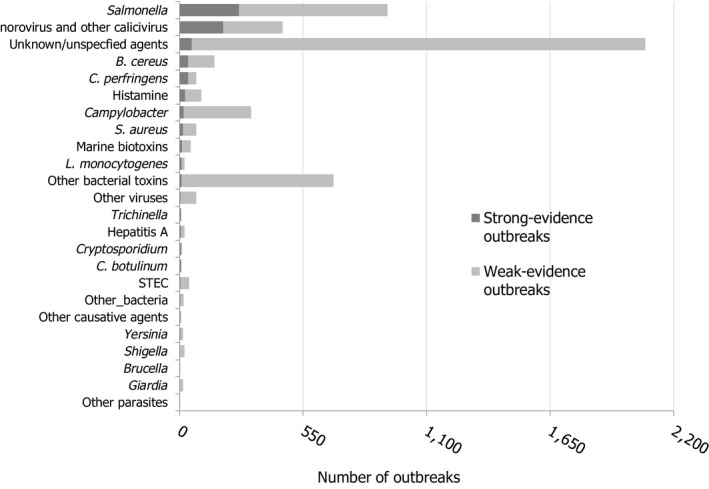
FBO s with causative agent encoded as ‘hepatitis virus, unspecified’. ‘Bacillus cereus’ includesFBO s with causative agent encoded as B. cereus enterotoxins. ‘Clostridium perfringens’ includesFBO s with causative agent encoded as Clostridium unspecified. ‘Staphylococcus aureus’ includesFBO s with causative agent encoded as Staphylococcus, unspecified’ or Staphylococcal enterotoxins. ‘Other bacteria’ includes Arcobacter butzleri, enteropathogenic Escherichia coli (EPEC ), Enterotoxigenic Escherichia coli (ETEC ), Escherichia coli, unspecified, Vibrio parahaemolyticus and other unspecified bacteria. ‘Other bacterial toxins’ includesFBO s by unspecified toxin‐producing bacteria.‘Other viruses’ includes adenovirus, flavivirus, hepatitis E virus, rotavirus and other viruses, unspecified. ‘Other causative agents’ includes atropine, mushroom toxins/mycotoxins and unspecified toxins.
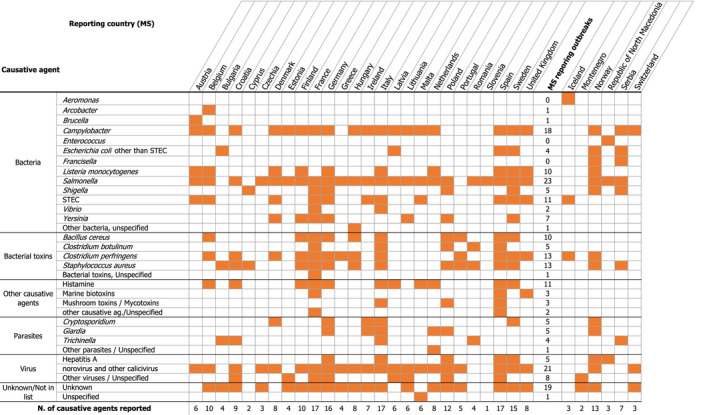
Note: the table may be read by column (country) or by row (causative agent). The number at each row end is the number of countries that reported for 2019 a given causative agent in outbreaks while the number at each column end are the numbers of causative agents identified in outbreaks by a given country in 2019. Luxembourg is not shown because no outbreaks were detected in 2019. Slovakia did not report data on outbreaks in 2019.
‘Hepatitis A’ includes also
FBO s with causative agent encoded as ‘hepatitis virus, unspecified’.‘B. cereus’ includes
FBO s with causative agent encoded as B. cereus enterotoxins. ‘C. perfringens’ includesFBO s with causative agent encoded as Clostridium unspecified. ‘S. aureus’ includesFBO s with causative agent encoded as Staphylococcus, unspecified’ or Staphylococcal enterotoxins. ‘Other bacteria’ includes Arcobacter butzleri, enteropathogenic Escherichia coli (EPEC ), enterotoxigenic Escherichia coli (ETEC ), Escherichia coli, unspecified, Vibrio parahaemolyticus and other unspecified bacteria. ‘Other bacterial toxins’ includesFBO s by unspecified toxin‐producing bacteria.‘Other viruses’ includes adenovirus, flavivirus, hepatitis E virus, rotavirus and other viruses, unspecified. ‘Other causative agents’ includes atropine, mushroom toxins/mycotoxins and unspecified toxins.
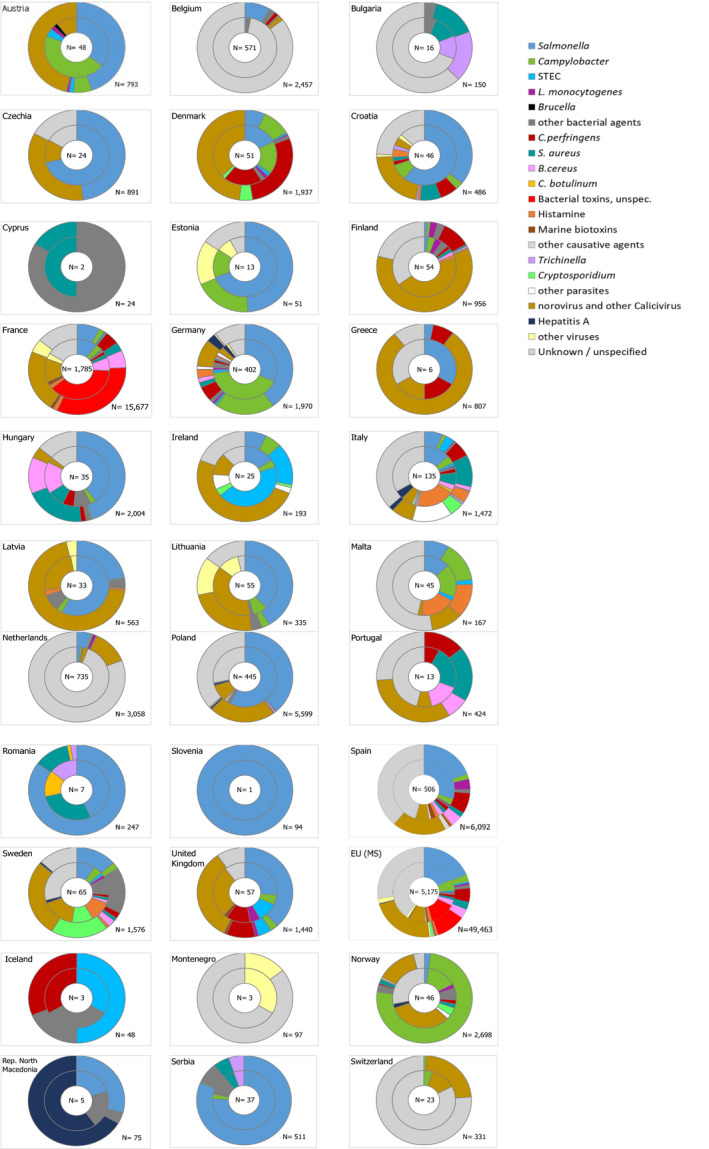
Causative agents are differently coloured. The size of each sector is proportional to the number of outbreaks (internal circle) and human cases (external circle) involved in outbreaks.
‘Hepatitis A’ also includes
FBO s with causative agent encoded as ‘hepatitis virus, unspecified’.‘B. cereus’ includes
FBO s with causative agent encoded as B. cereus enterotoxins. ‘C. perfringens’ includesFBO s with causative agent encoded as Clostridium unspecified. ‘S. aureus’ includesFBO s with causative agent encoded as Staphylococcus, unspecified’ or Staphylococcal enterotoxins. ‘Other bacteria’ includes Arcobacter butzleri, Enteropathogenic Escherichia coli (EPEC ), Enterotoxigenic Escherichia coli (ETEC ), Escherichia coli, unspecified, Vibrio parahaemolyticus and other unspecified bacteria. ‘Other bacterial toxins’ includesFBO s by unspecified toxin‐producing bacteria.‘Other viruses’ includes adenovirus, flavivirus, Hepatitis E virus, rotavirus and other viruses, unspecified. ‘Other causative agents’ includes atropine, mushroom toxins/mycotoxins and unspecified toxins.

Note: Both strong‐evidence outbreaks and weak‐evidence outbreaks are considered in the figure. Outbreaks caused by parasites are not shown due to paucity of data. Luxembourg is not shown since no outbreaks were detected in 2019. Slovakia did not report data on outbreaks in 2019.
* % of variation could not be calculated as no outbreaks were reported in 2018. For Lithuania, the % of difference of FBOs by ‘norovirus and other calicivirus’ is + 2000%.
‘Hepatitis A’ includes also
FBO s with causative agent encoded as ‘hepatitis virus, unspecified’. ‘B. cereus’ includesFBO s with causative agent encoded as ‘B. cereus enterotoxins’. ‘C. perfringens’ includesFBO s with causative agent encoded as ‘Clostridium unspecified’. ‘S. aureus’ includesFBO s with causative agent encoded as ‘Staphylococcus, unspecified’ or ‘Staphylococcal enterotoxins’.
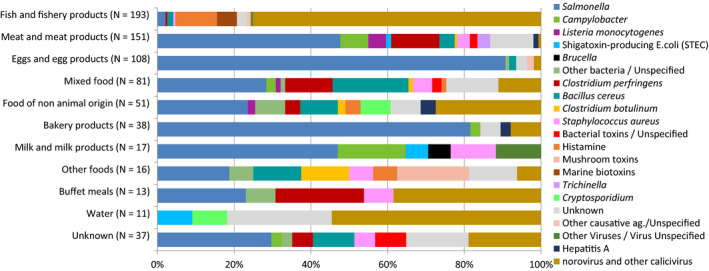
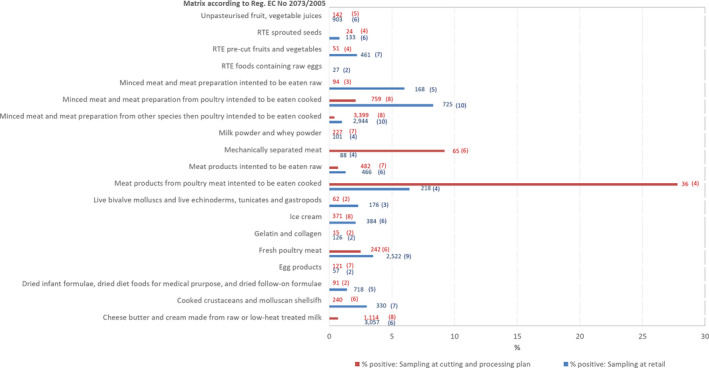
Note: N = number of strong‐evidence outbreaks by food type.
‘Hepatitis A’ includes also
FBO s with causative agent encoded as ‘hepatitis virus, unspecified’. ‘B. cereus’ includesFBO s with causative agent encoded as ‘B. cereus enterotoxins’. ‘C. perfringens’ includesFBO s with causative agent encoded as ‘Clostridium unspecified’. ‘S. aureus’ includesFBO s with causative agent encoded as ‘Staphylococcus, unspecified’ or ‘Staphylococcal enterotoxins’. ‘Other bacteria’ includes enteropathogenic Escherichia coli (EPEC ), enterotoxigenic Escherichia coli (ETEC ), Escherichia coli, unspecified, Shigella, Vibrio parahaemolyticus, Yersinia and other unspecified bacteria. ‘Other bacterial toxins’ includesFBO s caused by unspecified toxin‐producing bacteria.‘Other viruses’ includes flavivirus and other unspecified viruses. ‘Other causative agents’ includes atropine, mushroom toxins/mycotoxins and unspecified toxins. ‘Fish and fishery products’ include ‘crustaceans, shellfish, molluscs and products thereof’, as well as ‘fish and fish products’. ‘Meat and meat products’ include bovine meat and products thereof, broiler meat (Gallus gallus) and products thereof, other or mixed red meat and products thereof, other, mixed or unspecified poultry meat and products thereof, pig meat and products thereof, sheep meat and products thereof, turkey meat and products thereof.‘Food of non‐animal origin’ includes cereal products including rice and seeds/pulses (nuts, almonds), fruit, berries and juices and other products thereof, herbs and spices, sweets and chocolate, vegetables and juices and other products thereof.’ ‘Milk and milk products’ include cheese, dairy products (other than cheeses), milk. ‘Other foods’ includes canned food products and other foods, unspecified.‘Water’ includes Tap water, including well water.

‘Hepatitis A’ includes also
FBO s with causative agent encoded as ‘hepatitis virus, unspecified’.‘B. cereus’ includes
FBO s with causative agent encoded as B. cereus enterotoxins. ‘C. perfringens’ includesFBO s with causative agent encoded as Clostridium unspecified. ‘S. aureus’ includesFBO s with causative agent encoded as Staphylococcus, unspecified’ or Staphylococcal enterotoxins.

Note: Data on other settings (287) include: Camp or picnic (28), Farm (7), Others (243), Temporary mass catering (fairs or festivals) (9).
N = number of outbreaks.
Note: Data on cases who became infected in other settings (6,252 cases) include: camp or picnic (776), farm (118), others (4,565), temporary mass catering (fairs or festivals) (793).
N = number of cases.
Note: ‘Hepatitis A’ includes also FBOs with causative agent encoded as ‘hepatitis virus, unspecified’. ‘B. cereus’ includes FBOs with causative agent encoded as B. cereus enterotoxins. ‘C. perfringens’ includes FBOs with causative agent encoded as Clostridium unspecified. ‘S. aureus’ includes FBOs with causative agent encoded as Staphylococcus, unspecified’ or Staphylococcal enterotoxins. Other bacterial agents include enteropathogenic E. coli (
EPEC ), enterotoxigenic E. coli (ETEC ), Vibrio parahaemolyticus, Shigella and Yersinia.Other viruses include flavivirus (tick‐borne Encephalitis virus) and other unspecified viruses.
Other causative agents include atropine, mushrooms toxins and other toxins, unspecified.
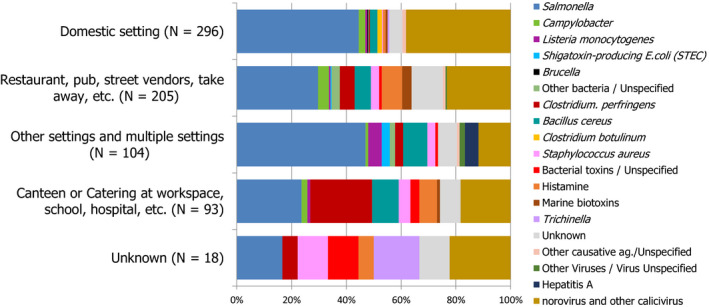
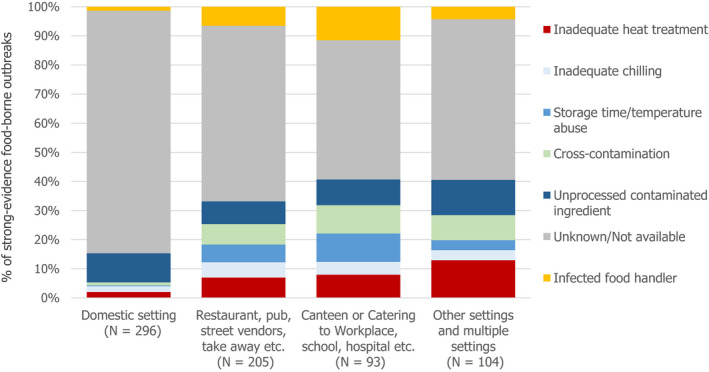
‘Restaurant, pub, street vendors, take‐away, etc.’ includes: restaurant or café or pub or bar or hotel or catering service, mobile retailer or market/street vendor, take‐away or fast‐food outlet.
‘Canteen or catering at workplace, school, hospital, etc.’ includes: school or kindergarten, residential institution (nursing home or prison or boarding school), canteen or workplace catering, hospital or medical care facility, catering on aircraft or ship or train.
‘Other settings’ includes: camp or picnic, farm, multiple places of exposure in one country, multiple places of exposure in more than one country, other settings unspecified, temporary mass catering (fairs or festivals).
Note: ‘Restaurant, pub, street vendors, take‐away, etc.’ includes; restaurant or café or pub or bar or hotel or catering service, mobile retailer or market/street vendor, take‐away or fast‐food outlet.
‘Canteen or catering at workplace, school, hospital, etc.’ includes; school or kindergarten, residential institution (nursing home or prison or boarding school), canteen or workplace catering, hospital or medical care facility, catering on aircraft or ship or train.
‘Other settings’ includes; camp or picnic, farm, multiple places of exposure in one country, multiple places of exposure in more than one country, other settings unspecified, temporary mass catering (fairs or festivals).
Note: other bacterial agents include Aeromonas, Arcobacter, enteroaggregative E. coli (
EAEC ), enterotoxigenic E. coli (ETEC ), enteroinvasive E. coli (EIEC ), enteropathogenic E. coli (EPEC ), E. coli unspecified, Francisella tularensis, Leptospira spp., Shigella spp., Streptococcus spp., Vibrio parahaemolyticus, Yersinia enterocolitica and other unspecified bacteria. ‘Hepatitis A’ includes alsoFBO s with causative agent encoded as ‘hepatitis virus, unspecified’. Other parasites include Anisakis, Cysticercus, Giardia and other unspecified parasites. Other causative agents include atropine, lectin, wax ester and other unspecified toxins.

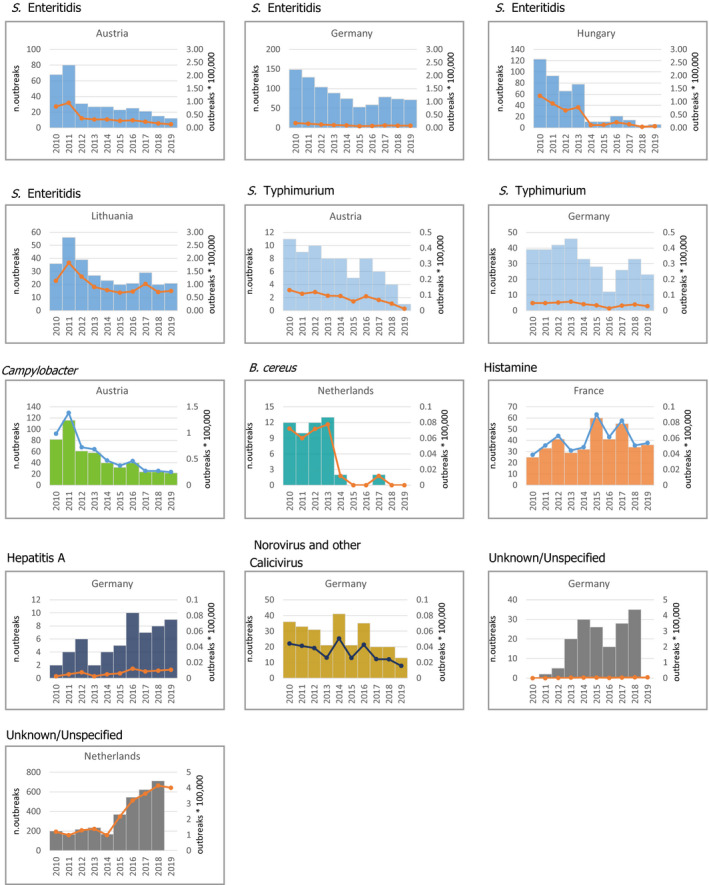
Note: The orange line (right axis) in the graphs represents the Salmonella outbreak reporting rate and was measured on the same scale for all
MS , to allow a direct comparability among countries. The blue bars present the trend over years in terms of absolute numbers of Salmonella outbreaks, using for each country the most appropriate scale (left axis).* indicates countries with a statistically significant trend (p < 0.05) over several years.
Note: only causative agents and countries with statistically significant trends and more than five outbreaks reported per year, on average, are visualised. ‘B. cereus’ includes FBOs with causative agent encoded as B. cereus enterotoxins. ‘Hepatitis A’ includes also FBOs with causative agent encoded as ‘hepatitis virus, unspecified’.
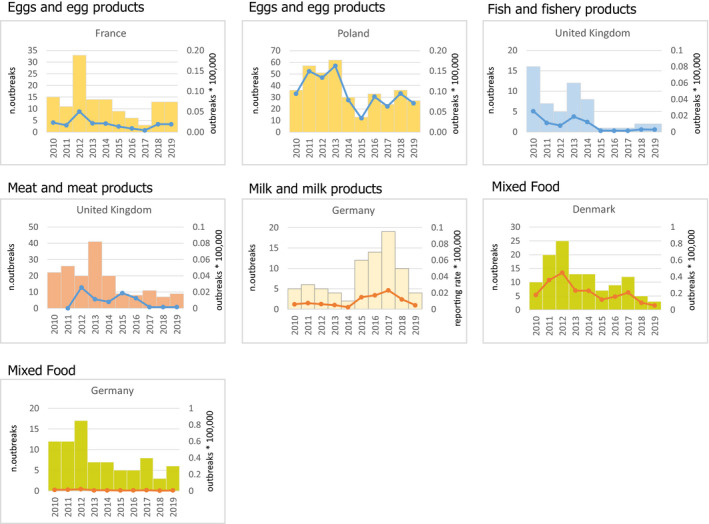
Note: only food vehicles and countries with statistically significant trends and more than five outbreaks reported per year, on average, are shown.
‘Fish and fishery products’ include ‘crustaceans, shellfish, molluscs and products thereof’, as well as ‘fish and fish products’. ‘Meat and meat products’ include bovine meat and products thereof, broiler meat (Gallus gallus) and products thereof, other or mixed red meat and products thereof, other, mixed or unspecified poultry meat and products thereof, pig meat and products thereof, sheep meat and products thereof, turkey meat and products thereof. ‘Milk and milk products include cheese, dairy products (other than cheeses), milk. ‘Other foods’ includes canned food products and other foods, unspecified.

Source: Cyprus, Czechia, Estonia, Finland, France, Germany, Greece, Hungary, Iceland, Ireland, Latvia, Lithuania, Luxembourg, Malta, the Netherlands, Norway, Poland, Portugal, Romania, Slovakia, Slovenia and Sweden. Austria, Belgium, Bulgaria, Croatia, Denmark, Italy, Spain, Switzerland and the United Kingdom did not report data to the level of detail required for the analysis.
Source: Austria, Belgium, Cyprus, Czechia, Estonia, Finland, France, Greece, Hungary, Ireland, Italy, Latvia, Lithuania, Luxembourg, Malta, the Netherlands, Norway, Poland, Romania, Slovakia, Slovenia, Spain, Sweden and the United Kingdom. Bulgaria, Croatia, Denmark, Germany, Iceland and Portugal did not report data to the level of detail required for the analysis.

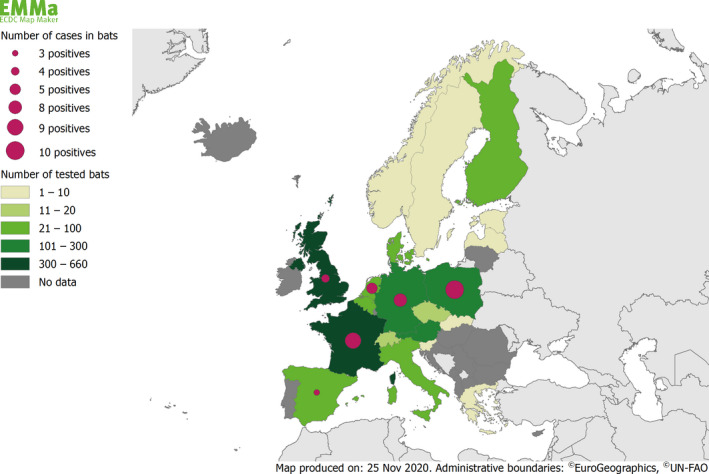
Source:
TESS y andADNS .
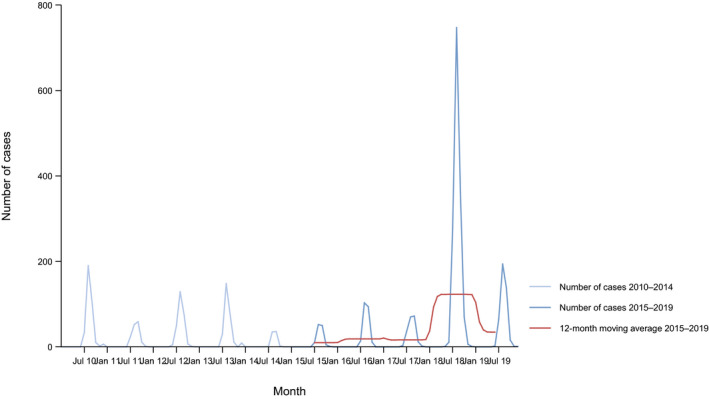
Source:
ADNS , extracted on 1 September 2020.

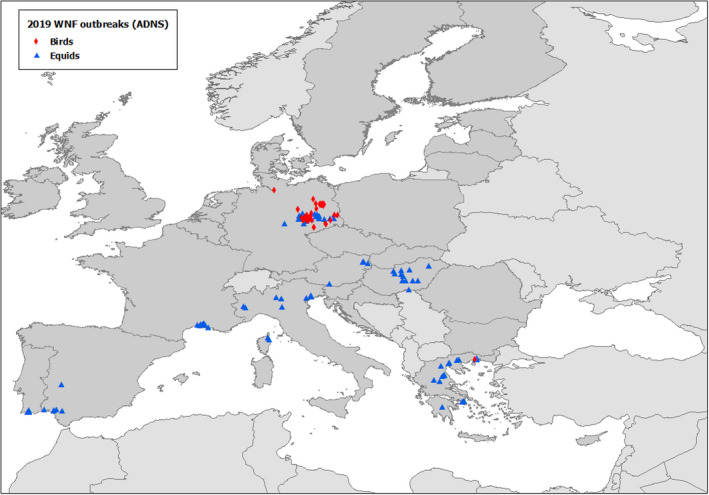
Source:
ADNS , extracted on 1 September 2020.
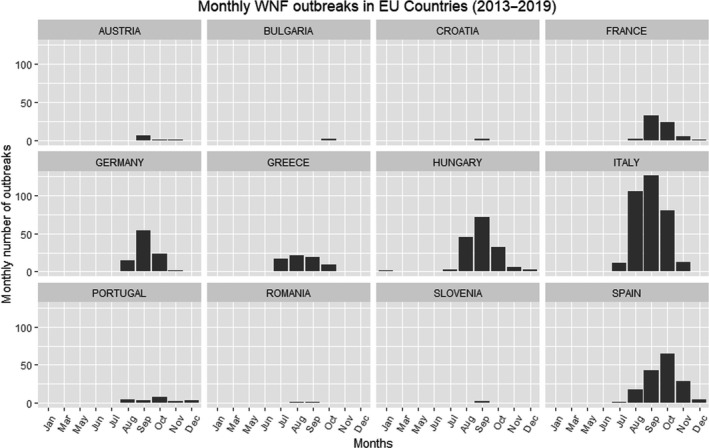
Source:
ADNS , extracted on 1 September 2020.

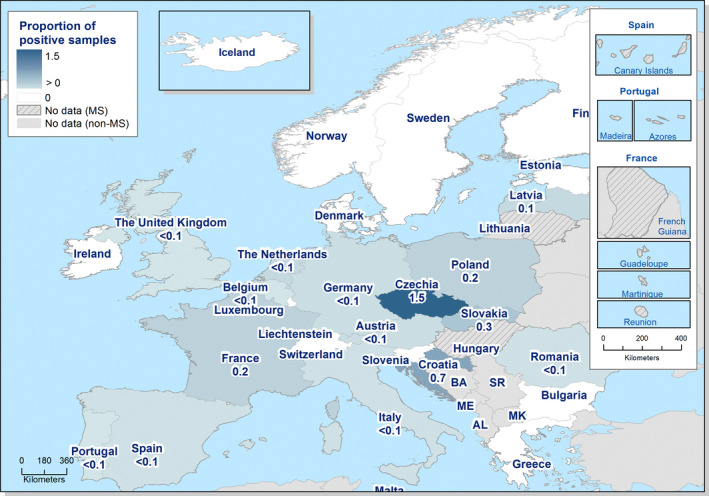
Note: The presence and absence of
STEC serogroups in foods (left) and animals (right). Red boxes > 1%, orange boxes > 0.1% and ≤ 1%, yellow boxes > 0.0001% and ≤ 0.1% of positive samples. White boxes indicate absence of the serogroup. An E. coli O104:H4 stx2+ eae‐ was isolated from sprouted seeds in 2015.
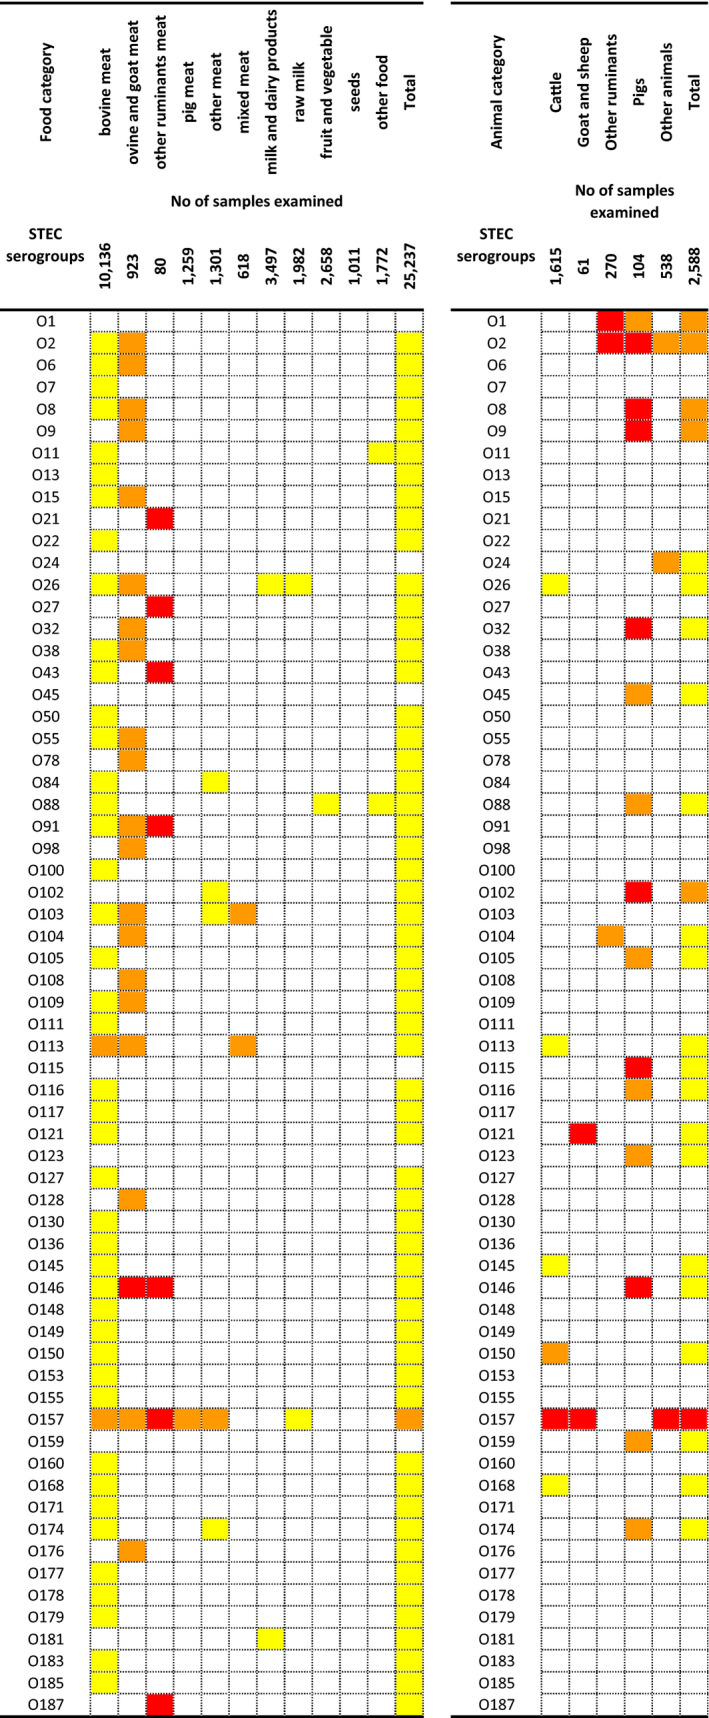
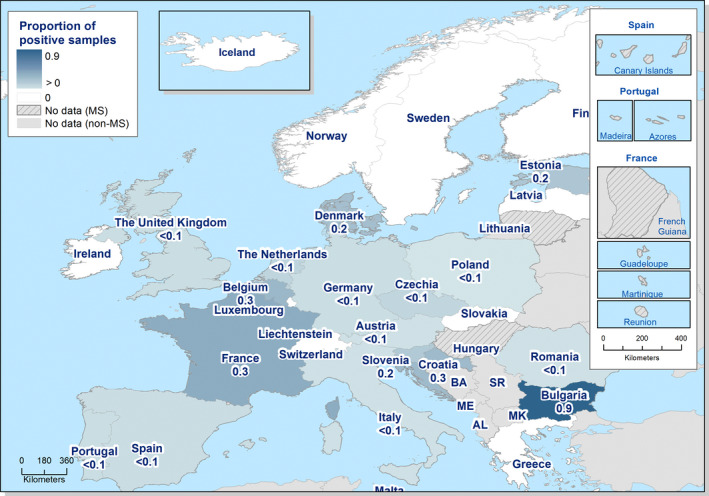
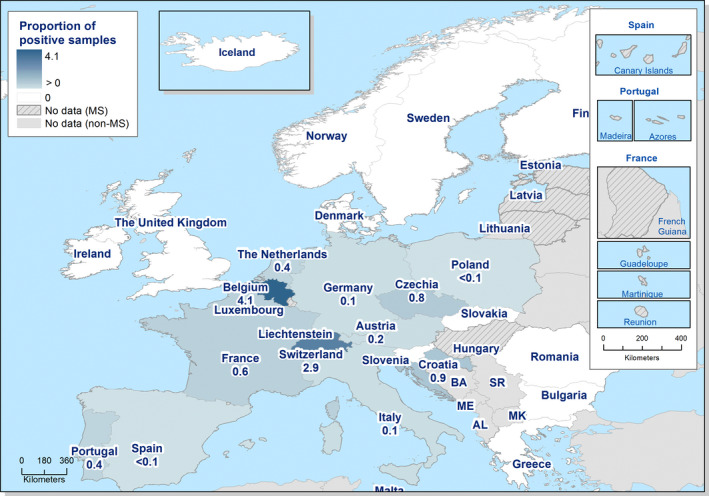
Proportions of
STEC serogroups: red boxes > 1%, orange boxes > 0.1% and ≤ 1%, yellow boxes > 0.0001% and ≤ 0.1% of positive samples. White boxes indicate absence of the serogroup.The food category ‘other ruminants’ meat’ includes meat from deer; ‘other meat’ includes meat from animals other than ruminants; ‘milk and dairy products’ include any type of dairy product, cheese and milk other than raw milk; ‘raw milk’ includes raw milk from different species, but most tested samples were from cows; ‘seeds’ includes mostly sprouted seeds, but dry seeds are also included.
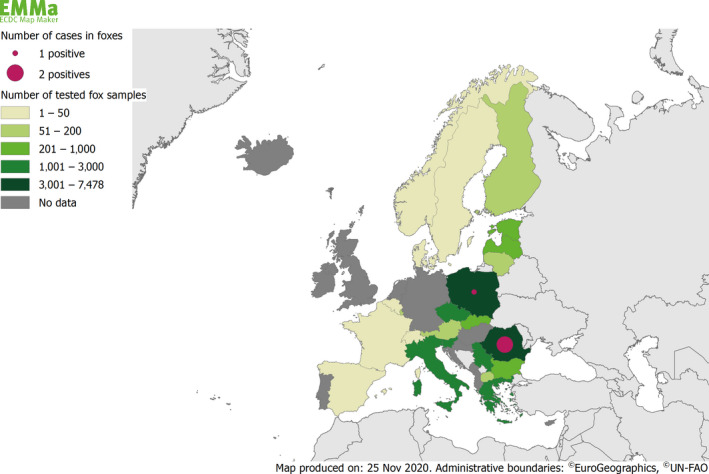
Source: Twenty‐two
MS .The animal category ‘other ruminants’ includes deer; ‘other animals’ comprises pigeons, cats, chinchillas, dogs, ferrets, foxes, Gallus gallus, guinea pigs, hedgehogs, mice, rabbits, rats solipeds, water buffalos, weasels and wild boars.
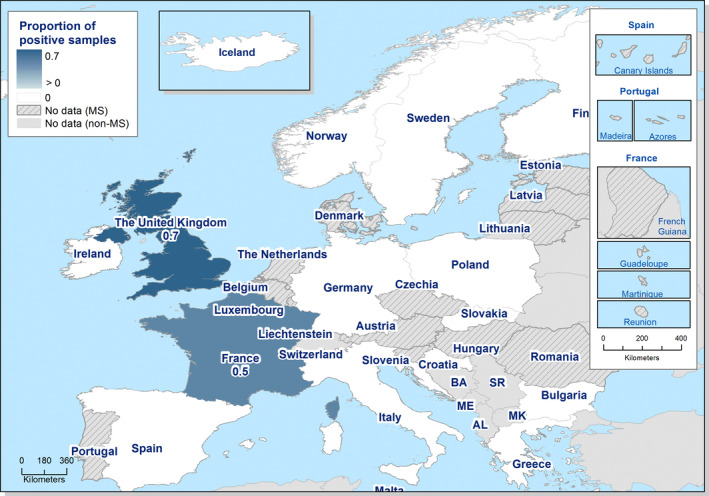
Source: nine
MS .
References
-
- Abubakar RH, Madoroba E, Adenubi O, Morar‐Leather D and Fasina FO, 2017. Bacterial pathogens of pigs with particular reference to Escherichia coli: a systematic review and meta‐analysis. Journal of Veterinary Medicine and Animal Health, 9, 159–185.
-
- Alban L, Pozio E, Boes J, Boireau P, Boué F, Claes M, Cook AJC, Dorny P, Enemark HL, van der Giessen J, Hunt KR, Howell M, Kirjusina M, Nöckler K, Rossi P, Smith GC, Snow L, Taylor MA, Theodoropoulos G, Vallée I, Viera‐Pinto MM and Zimmer IA, 2011. Towards a standardised surveillance for Trichinella in the European Union. Preventive Veterinary Medicine, 99, 148–160. - PubMed
-
- ANSES , 2011. Data sheet on foodborne biological hazards – Listeria monocytogenes. Available online: https://www.anses.fr/en/system/files/MIC2011sa0171FiEN.pdf)
LinkOut - more resources
Full Text Sources
Other Literature Sources
Miscellaneous