. 2021 Feb 10;7(1):e000876.
doi: 10.1136/bmjsem-2020-000876. eCollection 2021.

Diurnal variations in the expression of core-clock genes correlate with resting muscle properties and predict fluctuations in exercise performance across the day

Affiliations

Diurnal variations in the expression of core-clock genes correlate with resting muscle properties and predict fluctuations in exercise performance across the day

Alireza Basti et al. BMJ Open Sport Exerc Med. .

Abstract

Objectives: In this study, we investigated daily fluctuations in molecular (gene expression) and physiological (biomechanical muscle properties) features in human peripheral cells and their correlation with exercise performance.

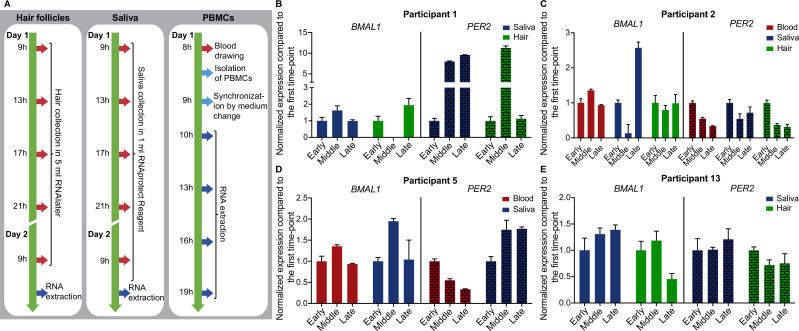
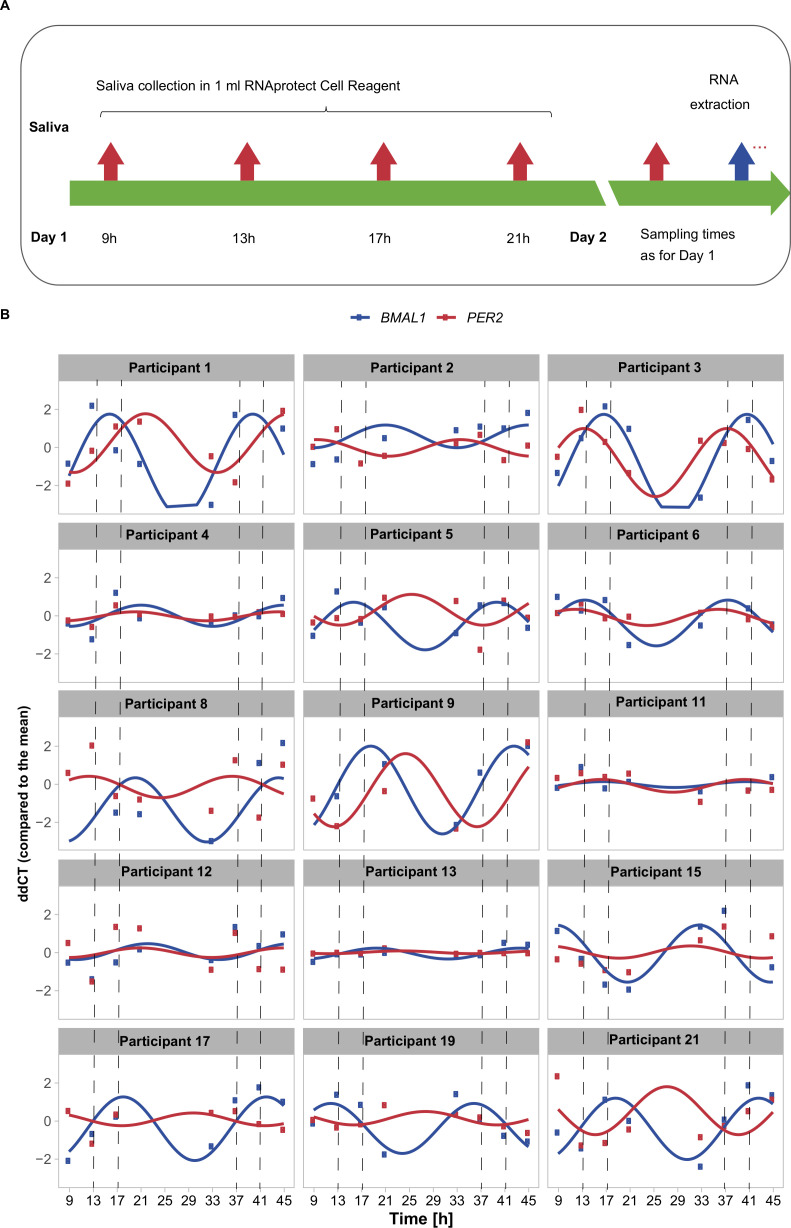
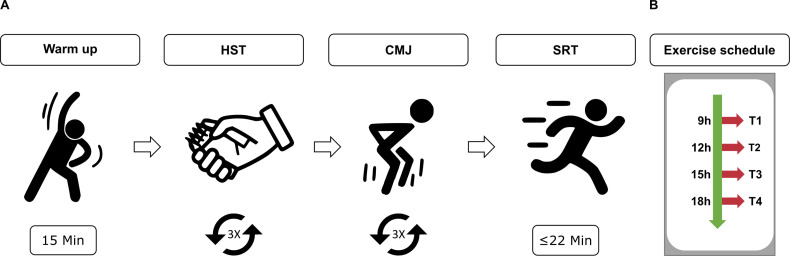
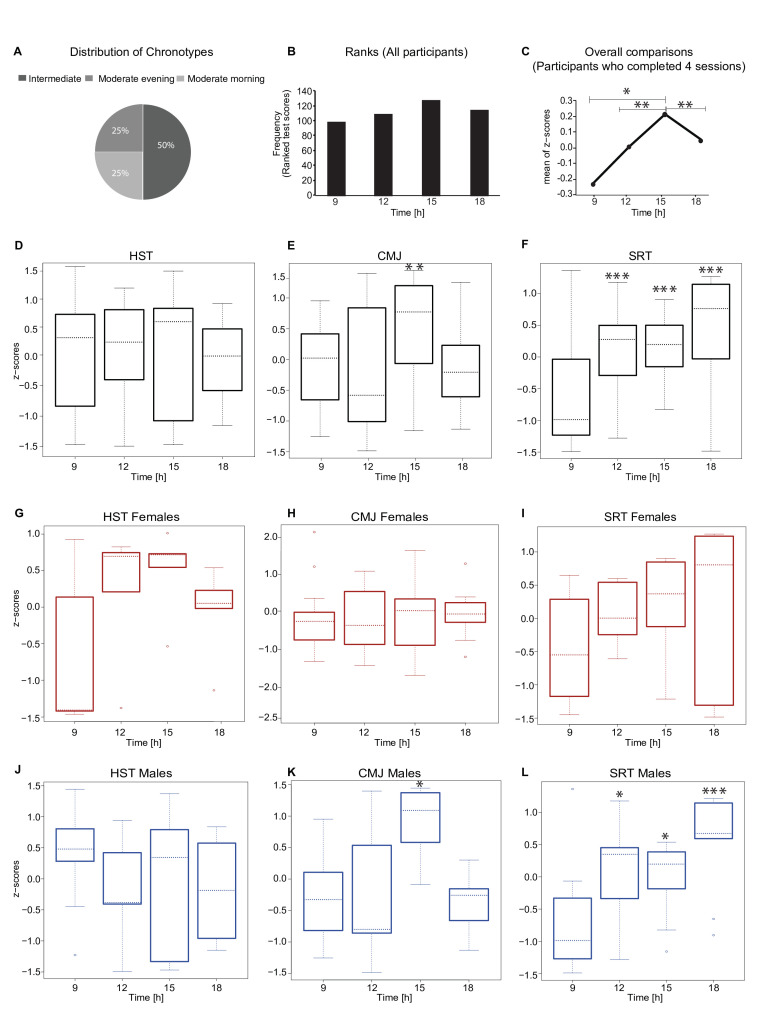
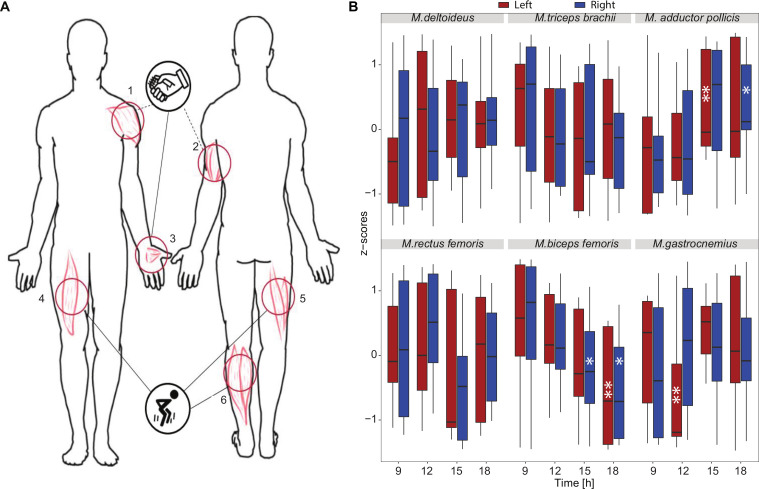
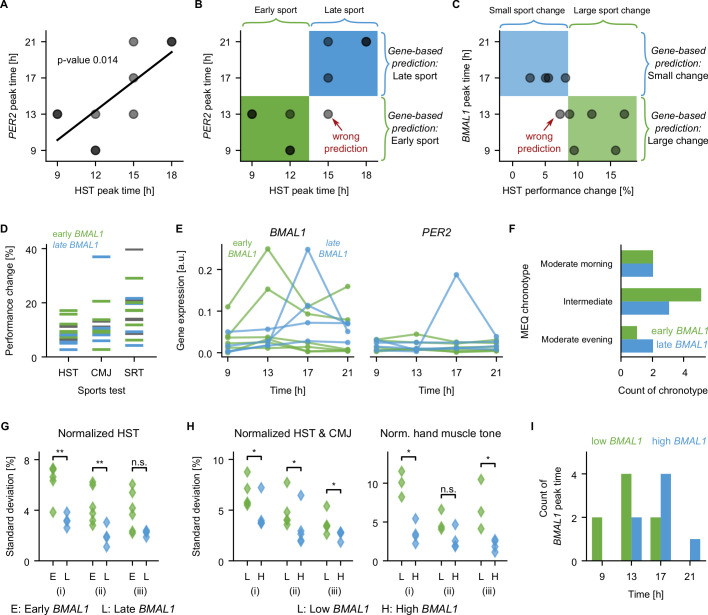
Methods: 21 healthy participants (13 men and 8 women) took part in three test series: for the molecular analysis, 15 participants provided hair, blood or saliva time-course sampling for the rhythmicity analysis of core-clock gene expression via RT-PCR. For the exercise tests, 16 participants conducted strength and endurance exercises at different times of the day (9h, 12h, 15h and 18h). Myotonometry was carried out using a digital palpation device (MyotonPRO), five muscles were measured in 11 participants. A computational analysis was performed to relate core-clock gene expression, resting muscle tone and exercise performance.

Results: Core-clock genes show daily fluctuations in expression in all biological samples tested for all participants. Exercise performance peaks in the late afternoon (15-18 hours for both men and women) and shows variations in performance, depending on the type of exercise (eg, strength vs endurance). Muscle tone varies across the day and higher muscle tone correlates with better performance. Molecular daily profiles correlate with daily variation in exercise performance.

Conclusion: Training programmes can profit from these findings to increase efficiency and fine-tune timing of training sessions based on the individual molecular data. Our results can benefit both professional athletes, where a fraction of seconds may allow for a gold medal, and rehabilitation in clinical settings to increase therapy efficacy and reduce recovery times.

Keywords: circadian rhythms; exercise performance times; molecular rhythmicity analysis; muscle tone.


Conflict of interest statement

Competing interests: None declared.

Figures

Figure 1
Figure 1
Experimental methodology and sampling schemes for circadian rhythmicity for different human peripheral tissues. (A) RNA for time-course RT-qPCR was extracted (dark blue arrows) from human hair follicles, human saliva and human PBMCs. Red arrows denote sampling time points. (B–E) Three time-point comparison of BMAL1 and PER2 expression for participants 1, 2, 5 and 13 (aged 30.60±7.02 years; mean, SD). Expression data are normalised to the first time-point (early). For hair and saliva data early, middle and late time-points represent 9h, 17h and 21h, respectively. For PBMCs data early, middle and late time-points represent 10h, 16h and 19h, respectively. Depicted are mean±SEM, error bars represent technical replicates. PBMCs, peripheral blood mononuclear cells.
Figure 2
Figure 2
Time-course measurements of unstimulated saliva show fluctuations in gene expression across 45 hours. (A) Sampling schemes for saliva collection at eight time points in two consecutive days (day 1—9h, 13h, 17h, 21h; day 2—as day 1). (B) Time-course RT-qPCR measurements of human saliva normalised to the mean of all time points (ΔΔCT) of BMAL1 (blue), and PER2 (red) of 15 participants (7 women and 8 men) with a fitted linear sine–cosine function (online supplemental table 1).
Figure 3
Figure 3
Schematic representation of the exercise. (A) An exercise session consisted of 15 min warm up and three exercises (approximate duration of 15 min/exercise): 3×HST, 3×CMJ, 1×SRT. (B) Exercise schedule. CMJ, counter-movement-jump; HST, hand-strength-test; SRT, shuttle-run-test.
Figure 4
Figure 4
Analysis of exercise performance for all participants. (A) Chronotype distribution from all individuals who performed the exercise tests (round one and two). (B) Cumulative ranking scores for all participants and exercise (n=19, three participants took part in both rounds). (C) Overall z-scores scores for participants who completed all four exercise sessions (n=15) (D, E, F) Z-scores per exercise (n=15), and overall z-scores (G, H, I) for women (n=6) and (J, K, L) men (n=9) who participated in all four exercise sessions. Significance is provided relative to the first time point (9h), the median value is indicated. *p<0.05, **p<0.01, ***p<0.001; Friedman test. CMJ, counter-movement-jump; HST, hand-strength-test; SRT, shuttle-run-test.
Figure 5
Figure 5
Myotonometric analysis shows daily variation in resting muscle tone (frequency, F). (A) Schematic representation of skin measurement points (MP) at the arms, hands and legs. MP1—M. deltoideus, MP2—M. triceps brachii, MP3—M. adductor pollicis, (activated mainly during HST), MP4—M. rectus femoris, MP5—M. biceps femoris, MP6—M. gastrocnemius (activated mainly during CMJ). Only participants who completed all exercise sessions were included in the myotonometric analysis (n=11). (B) Z-scores for the myotonometric parameter frequency (Hz) for each exercise session (9h, 12h, 15h, 18h) and each muscle (M. deltoidus, M. triceps brachii, M.adductor pollicis, M. rectus femoris, M. biceps femoris, M. gastrocnemius, respectively). The measurements were carried out from top to bottom on the right (R—blue line) and the corresponding left (L—red line) side of the body. A gender-based analysis is presented in online supplemental figure 5. Significance is provided relative to the first time point (9h), the median value is indicated. *p<0.05, **p<0.01, ***p<0.001; Friedman test. CMJ, counter-movement-jump; HST, hand-strength-test.
Figure 6
Figure 6
Correlations between molecular rhythms of core-clock genes, muscle tone, and exercise performance. (A) The peak time of PER2 correlates with the time of peak performance of the HST (linear regression with p=0.014). (B) The peak expression of PER2 plotted against the peak performance of the hand-strength-test (HST) as in (A) (dots). The peak expression of PER2 can be used to predict whether the HST performance peak is early (green, 9h or 12h) or late (blue, 15h or 18h). Using an early PER2 peak to predict of an early HST performance peak, and a late PER2 peak to predict a late HST performance peak, as marked on the right side of the graph, results in five correctly classified subjects with early HST performance peak (green box), four correctly classified subjects with late HST performance peak (blue box) and one subject with late HST performance peak classified wrongly as early (lower right quadrant). (C) The peak expression of BMAL1 plotted against the diurnal change in exercise performance of the hand-strength-test (HST) for 10 participants (dots). Using the peak expression of BMAL1 to predict whether the change in HST performance is large (top five subjects) or small (lower five participants) as marked on the right of the graph results in five correctly classified participants with large changes (green box), and four correctly classified participants with small changes (blue box), and one participant with small changes in HST performance classified wrongly as large change (lower left quadrant). (D) Performance change over the day (max compared with min), colour code as in (E). (E) Red and blue groups have an early and late BMAL1 peak time, respectively. (F) Early or late BMAL1 peaks occur in any of the three investigated MEQ chronotypes, see also online supplemental figure 6A). (G) SD calculated on the normalised HST performance for data from different (i) repetitions and timepoints (p=0.0095), (ii) timepoints (p=0.0095), (iii) repetitions (p=0.057), Mann-Whitney U test. (H) Separating the groups by the mean expression level of BMAL1 instead of the peak time results in significant differences in the SD of the exercise performance of HST and CMJ (left, Mann-Whitney U test, all p=0.0476) and of the hand muscle frequency (right, Mann-Whitney U test, p=0.0286, p=0.11, p=0.0286). Non-significant differences for exercise and muscles data are shown in online supplemental figure 6E–H). (I) Histogram of the time of the day with the highest BMAL1 expression based on the eight saliva samples. Significantly earlier peaks are found for the group with low BMAL1 expression (ranksum test, p=0.044). CMJ, counter-movement-jump; HST, hand-strength-test; MEQ, Morningness/Eveningness Questionnaire; SRT, shuttle-run-test.

References

    1. Fuhr L, Abreu M, Pett P, et al. Circadian systems biology: when time matters. Comput Struct Biotechnol J 2015;13:417–26. 10.1016/j.csbj.2015.07.001 - DOI - PMC - PubMed
    1. Castellana S, Mazza T, Capocefalo D, et al. Systematic analysis of mouse genome reveals distinct evolutionary and functional properties among circadian and ultradian genes. Front Physiol 2018;9:1178. 10.3389/fphys.2018.01178 - DOI - PMC - PubMed
    1. Astaburuaga R, Basti A, Li Y, et al. Circadian regulation of physiology: relevance for space medicine. REACH 2019;14-15:100029 10.1016/j.reach.2019.100029 - DOI
    1. Hastings MH, Reddy AB, Maywood ES. A clockwork web: circadian timing in brain and periphery, in health and disease. Nat Rev Neurosci 2003;4:649–61. 10.1038/nrn1177 - DOI - PubMed
    1. Borgs L, Beukelaers P, Vandenbosch R, et al. Cell "circadian" cycle: new role for mammalian core clock genes. Cell Cycle 2009;8:832–7. 10.4161/cc.8.6.7869 - DOI - PubMed

LinkOut - more resources